
|
市場調査レポート
商品コード
1666629
スマートバッジ市場の機会、成長促進要因、産業動向分析、2025~2034年の予測Smart Badge Market Opportunity, Growth Drivers, Industry Trend Analysis, and Forecast 2025 - 2034 |
||||||
カスタマイズ可能
|
|||||||
| スマートバッジ市場の機会、成長促進要因、産業動向分析、2025~2034年の予測 |
|
出版日: 2024年12月31日
発行: Global Market Insights Inc.
ページ情報: 英文 180 Pages
納期: 2~3営業日
|

全表示
- 概要
- 目次
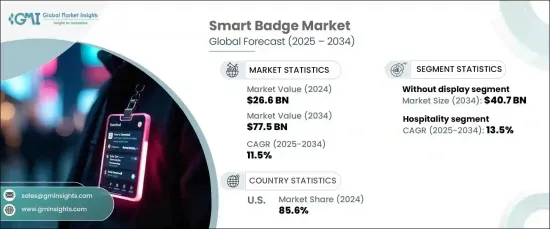
スマートバッジの世界市場は、2024年に266億米ドルと評価され、2025年から2034年にかけて11.5%の堅調なCAGRで拡大すると予測されています。
この成長は、スマートバッジ技術へのモノのインターネット(IoT)の統合が進み、リアルタイムのデータ交換と監視を可能にする機能が変化していることが背景にあります。高度な検出器と無線接続を備えたIoT対応スマートバッジにより、組織は従業員の動きを正確に追跡し、勤務時間を監視し、比類のない精度でアクセスレベルを管理することができます。
スマートバッジは、職場のセキュリティと業務効率を高めるために不可欠なツールになりつつあります。従業員のアクセス管理に安全な方法を提供することで、不正侵入のリスクを大幅に軽減します。アクセス管理、従業員管理、進化するセキュリティ・プロトコルへの準拠のための信頼できるソリューションとして、あらゆる産業でこれらのバッジが採用されています。シームレスで自動化されたシステムに対する需要の高まりは、市場の拡大をさらに促進し、スマートバッジは識別および追跡プロセスの近代化において中心的な役割を果たしています。
| 市場範囲 | |
|---|---|
| 開始年 | 2024 |
| 予測年 | 2025-2034 |
| 開始金額 | 266億米ドル |
| 予測金額 | 775億米ドル |
| CAGR | 11.5% |
スマートバッジ市場は、ディスプレイ付きバッジとディスプレイなしバッジの2種類に分類されます。ディスプレイなしのバッジは、シンプルで費用対効果が高いことから、2034年までに407億米ドルの売上が見込まれています。一方、ディスプレイ付きバッジは、リアルタイムの情報表示、通知、ユーザー識別などの強化された機能を提供します。これらは、即時のコミュニケーションやデータの可視化が不可欠なヘルスケア、企業オフィス、イベントなどの分野で特に重宝されています。LEDまたはe-inkスクリーンを特徴とするディスプレイ対応バッジにより、ユーザーはアラート、ステータス更新、重要データを一目で見ることができ、プロフェッショナルな環境におけるインタラクティブでダイナミックなエンゲージメントをサポートします。
用途の面では、スマートバッジは企業、ホスピタリティ、イベント・会議、政府、ヘルスケアなど、さまざまな分野で支持を集めています。2025年から2034年にかけてのCAGRは13.5%で、ホスピタリティセクターが最も急成長する見込みです。企業環境では、これらのバッジが入退室管理、出席追跡、ユーザー識別に革命をもたらしています。組織はスマートバッジを活用して、従業員の制限区域へのアクセスを合理化し、同時に労働力管理を改善しています。これらのバッジをより広範なセキュリティ・システムに統合することで、企業は従業員の位置や勤務時間をリアルタイムで監視し、効率性と安全性の両方を高めることができます。運用の最適化と拡張可能な識別ソリューションが重視されるようになり、大企業におけるスマートバッジの需要が高まっています。
2024年には、米国がスマートバッジの世界市場シェアの85.6%を占めるという目覚ましい結果が出ており、これは高度なセキュリティと労働力管理技術の普及を反映しています。企業、政府機関、教育機関など、さまざまな分野で個人の入退室管理に対する強い需要があるため、バイオメトリックおよびIoT対応スマートバッジは継続的に需要があります。同市場は、継続的な技術の進歩と大手テクノロジー企業によるサポートから恩恵を受けています。しかし、GDPRなどの厳しいデータプライバシー規制が課題となっており、こうした懸念に効果的に対処するための安全でコンプライアンスに準拠したソリューションの必要性が高まっています。
目次
第1章 調査手法と調査範囲
- 市場範囲と定義
- 基本推定と計算
- 予測計算
- データソース
- 1次データ
- 2次データ
- 有料情報源
- 公的情報源
第2章 エグゼクティブサマリー
第3章 業界洞察
- エコシステム分析
- バリューチェーンに影響を与える要因
- 利益率分析
- 破壊
- 将来の展望
- メーカー
- 流通業者
- サプライヤーの状況
- 利益率分析
- 主要ニュース
- 規制状況
- 影響要因
- 促進要因
- IoT(モノのインターネット)技術の採用拡大
- 強化されたセキュリティ・ソリューションに対する需要の高まり
- スマートバッジ機能の技術的進歩
- 労働力管理ソリューションへのニーズの高まり
- 非接触で衛生的なソリューションへのシフト
- 業界の潜在的リスク&課題
- 初期設定とメンテナンスのコストが高い
- プライバシーとデータセキュリティへの懸念
- 促進要因
- 成長可能性分析
- ポーターの分析
- PESTEL分析
第4章 競合情勢
- イントロダクション
- 企業シェア分析
- 競合のポジショニング・マトリックス
- 戦略展望マトリックス
第5章 市場推計・予測:通信別、2021年~2034年
- 主要動向
- 接触
- 非接触
第6章 市場推計・予測:タイプ別、2021年~2034年
- 主要動向
- ディスプレイ付きスマートバッジ
- ディスプレイなしのスマートバッジ
第7章 市場推計・予測:用途別、2021年~2034年
- 主要動向
- 企業
- ホスピタリティ
- イベント・会議
- 官公庁、ヘルスケア
- その他
第8章 市場推計・予測:地域別、2021年~2034年
- 主要動向
- 北米
- 米国
- カナダ
- 欧州
- 英国
- ドイツ
- フランス
- イタリア
- スペイン
- ロシア
- アジア太平洋
- 中国
- インド
- 日本
- 韓国
- オーストラリア
- ラテンアメリカ
- ブラジル
- メキシコ
- 中東・アフリカ
- 南アフリカ
- サウジアラビア
- アラブ首長国連邦
第9章 企業プロファイル
- Abeeway
- Aioi-Systems Co., Ltd.
- ASSA ABLOY
- Beamian
- Brady Worldwide, Inc.
- Canon Inc.
- CardLogix Corporation
- Cisco.
- Dorma+Kaba Holdings AG
- Evolis
- Giesecke+Devrient GmbH
- HID Global
- IDEMIA
- Johnson Controls
- Kaba
- Kontakt.io
- Sber
- Seiko Solutions Inc.
- Thales Group
- ThinkWill
- Xerox Corporation
- Zebra Technologies Corporation
The Global Smart Badge Market was valued at USD 26.6 billion in 2024 and is projected to expand at a robust CAGR of 11.5% from 2025 to 2034. This growth is driven by the increasing integration of the Internet of Things (IoT) into smart badge technology, transforming their capabilities to enable real-time data exchange and monitoring. IoT-enabled smart badges with advanced detectors and wireless connectivity allow organizations to accurately trace employee movements, monitor work hours, and manage access levels with unparalleled precision.
Smart badges are becoming indispensable tools for enhancing workplace security and operational efficiency. By providing secure methods for managing personnel access, they significantly reduce the risk of unauthorized entry. Industries across the board are adopting these badges as reliable solutions for access control, workforce management, and compliance with evolving security protocols. The rising demand for seamless and automated systems further fuels the market's expansion, with smart badges playing a central role in modernizing identification and tracking processes.
| Market Scope | |
|---|---|
| Start Year | 2024 |
| Forecast Year | 2025-2034 |
| Start Value | $26.6 Billion |
| Forecast Value | $77.5 Billion |
| CAGR | 11.5% |
The smart badge market is categorized into two types: badges with display and those without display. Badges without display are anticipated to generate USD 40.7 billion in revenue by 2034, owing to their simplicity and cost-effectiveness. Meanwhile, badges with display offer enhanced functionality, such as real-time information display, notifications, and user identification. These are particularly valuable in sectors like healthcare, corporate offices, and events, where immediate communication and data visualization are essential. Featuring LED or e-ink screens, display-enabled badges allow users to view alerts, status updates, and critical data at a glance, supporting interactive and dynamic engagement in professional environments.
In terms of application, smart badges are gaining traction across diverse sectors, including corporate, hospitality, events and conferences, government, and healthcare. The hospitality sector is poised for the fastest growth, with a CAGR of 13.5% between 2025 and 2034. In corporate environments, these badges are revolutionizing access control, attendance tracking, and user identification. Organizations are leveraging smart badges to streamline employee access to restricted areas while simultaneously improving workforce management. By integrating these badges into broader security systems, companies can monitor employee locations and working hours in real-time, enhancing both efficiency and safety. The increasing emphasis on operational optimization and scalable identification solutions drives the rising demand for smart badges in large enterprises.
In 2024, the U.S. accounted for an impressive 85.6% of the global smart badge market share, reflecting the widespread adoption of advanced security and workforce management technologies. With strong demand for private access control across sectors such as corporate, government, and education, biometric and IoT-enabled smart badges are in continuous demand. The market benefits from ongoing technological advancements and support from leading technology firms. However, stringent data privacy regulations, such as GDPR, pose challenges, driving the need for secure and compliant solutions to address these concerns effectively.
Table of Contents
Chapter 1 Methodology & Scope
- 1.1 Market scope & definitions
- 1.2 Base estimates & calculations
- 1.3 Forecast calculations
- 1.4 Data sources
- 1.4.1 Primary
- 1.4.2 Secondary
- 1.4.2.1 Paid sources
- 1.4.2.2 Public sources
Chapter 2 Executive Summary
- 2.1 Industry synopsis, 2021-2034
Chapter 3 Industry Insights
- 3.1 Industry ecosystem analysis
- 3.1.1 Factor affecting the value chain
- 3.1.2 Profit margin analysis
- 3.1.3 Disruptions
- 3.1.4 Future outlook
- 3.1.5 Manufacturers
- 3.1.6 Distributors
- 3.2 Supplier landscape
- 3.3 Profit margin analysis
- 3.4 Key news & initiatives
- 3.5 Regulatory landscape
- 3.6 Impact forces
- 3.6.1 Growth drivers
- 3.6.1.1 Increasing adoption of IoT (Internet of Things) technologies
- 3.6.1.2 Rising demand for enhanced security solutions
- 3.6.1.3 Technological advancements in smart badge features
- 3.6.1.4 Growing need for workforce management solutions
- 3.6.1.5 Shift toward contactless and hygienic solutions
- 3.6.2 Industry pitfalls & challenges
- 3.6.2.1 High initial setup and maintenance costs
- 3.6.2.2 Privacy and data security concerns
- 3.6.1 Growth drivers
- 3.7 Growth potential analysis
- 3.8 Porter’s analysis
- 3.9 PESTEL analysis
Chapter 4 Competitive Landscape, 2024
- 4.1 Introduction
- 4.2 Company market share analysis
- 4.3 Competitive positioning matrix
- 4.4 Strategic outlook matrix
Chapter 5 Market Estimates & Forecast, By Communication, 2021-2034 (USD Million)
- 5.1 Key trends
- 5.2 Contact
- 5.3 Contactless
Chapter 6 Market Estimates & Forecast, By Type, 2021-2034 (USD Million)
- 6.1 Key trends
- 6.2 Smart badges with display
- 6.3 Smart badges without display
Chapter 7 Market Estimates & Forecast, By Application, 2021-2034 (USD Million)
- 7.1 Key trends
- 7.2 Corporate
- 7.3 Hospitality
- 7.4 Events and conferences
- 7.5 Government and healthcare
- 7.6 Others
Chapter 8 Market Estimates & Forecast, By Region, 2021-2034 (USD Million)
- 8.1 Key trends
- 8.2 North America
- 8.2.1 U.S.
- 8.2.2 Canada
- 8.3 Europe
- 8.3.1 UK
- 8.3.2 Germany
- 8.3.3 France
- 8.3.4 Italy
- 8.3.5 Spain
- 8.3.6 Russia
- 8.4 Asia Pacific
- 8.4.1 China
- 8.4.2 India
- 8.4.3 Japan
- 8.4.4 South Korea
- 8.4.5 Australia
- 8.5 Latin America
- 8.5.1 Brazil
- 8.5.2 Mexico
- 8.6 MEA
- 8.6.1 South Africa
- 8.6.2 Saudi Arabia
- 8.6.3 UAE
Chapter 9 Company Profiles
- 9.1 Abeeway
- 9.2 Aioi-Systems Co., Ltd.
- 9.3 ASSA ABLOY
- 9.4 Beamian
- 9.5 Brady Worldwide, Inc.
- 9.6 Canon Inc.
- 9.7 CardLogix Corporation
- 9.8 Cisco.
- 9.9 Dorma+Kaba Holdings AG
- 9.10 Evolis
- 9.11 Giesecke+Devrient GmbH
- 9.12 HID Global
- 9.13 IDEMIA
- 9.14 Johnson Controls
- 9.15 Kaba
- 9.16 Kontakt.io
- 9.17 Sber
- 9.18 Seiko Solutions Inc.
- 9.19 Thales Group
- 9.20 ThinkWill
- 9.21 Xerox Corporation
- 9.22 Zebra Technologies Corporation
