
|
市場調査レポート
商品コード
1431780
視聴者の旅:ストリーミングオプションのナビゲートThe Viewer Journey: Navigating Streaming Options |
||||||
|
|||||||
| 視聴者の旅:ストリーミングオプションのナビゲート |
|
出版日: 2024年02月22日
発行: Parks Associates
ページ情報: 英文
納期: 即日から翌営業日
|

全表示
- 概要
- 目次
当レポートでは、視聴したいビデオコンテンツへのアクセスの道程を調査し、TV放送、従来型有料テレビ、SVOD、AVOD/FAST、TVOD、vMVPDサービスなど、多くのOTTストリーミングビデオサービスモデル全体に渡った消費者の視聴動向をまとめています。
サンプルビュー
目次
調査調査手法と定義
- 重要用語と定義
- 有料テレビの定義と分類
- ビデオサービスのエコシステム
エグゼクティブサマリー
- OTTサービスを利用する理由
- サービスの使用理由:主要サービス別
- すべてのデバイスでのビデオの消費量
- 見たいビデオコンテンツを探す方法
- ビデオコンテンツの視聴方法の発見
- 月々の支出額:ストリーミングに対する見解別
- OTT加入者の平均
- OTT解約率:ストリーミングエクスペリエンス別
全体的な見通し:ストリーミングの導入
- 普及率:従来型ビデオサービス vs OTTビデオサービス
- 有料TVとOTTサービスのサブスクリプション動向
- 有料TVとOTTサービスのサブスクリプション構成
- OTTサービスの契約数
- OTTサービスの平均サブスクリプション数
- OTTサービス加入数:所得別
- OTTサービス加入数:子供の数別
- 平均OTTサービス数:ビジネスモデル別
- 主要OTTサブスクリプションティア
- ソーシャル/ユーザー生成コンテンツを視聴するためのプラットフォーム
- vMVPDサービスのサブスクリプション方法
- OTTサービスのサブスクリプション方法
- ストリーミングTVサービスのサブスクリプション方法:サービス別
視聴消費:デバイスとサービス
- OTTサービスを利用する理由
- サービスの使用理由:主要サービス別
- サービスの使用理由:他のOTTサービス別
- 過去30日間のあらゆる種類のビデオデバイス使用
- 過去30日間のビデオデバイス使用:年齢層別
- 平均ビデオ消費量:プラットフォーム別
- ビデオ消費量:すべてのデバイス
- ビデオ消費量:テレビ
- ビデオ消費量:携帯電話
- ビデオ消費量:タブレット
- ビデオ消費量:コンピューター
- 視聴したオンラインコンテンツのジャンル
第一の選択と段階
- コンテンツ視聴の道程:テレビでのビデオ視聴
- テレビでテレビや映画を視聴するための第一の選択肢
- テレビでスポーツの生中継を視聴するための第一の選択肢
- テレビでライブニュースを視聴するための第一の選択肢
- 新しいものを見つけるときの最初のステップ
- コネクテッドTVデバイス上のビデオコンテンツの最初のソース
発見と体験
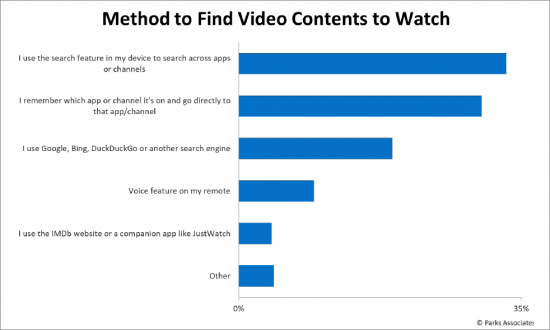
- 見たいビデオコンテンツを探す方法
- ビデオコンテンツの視聴方法の発見
- ビデオコンテンツの視聴方法の発見:ビデオコンテンツの第一のソース別
- 月々の支出額::ストリーミングに対する見解別
- OTTおよびvMVPD加入者の平均
- 広告ベースのOTTサービスの視聴体験
- ライブスポーツイベントの視聴体験
解約
- OTT加入者の解約
- OTTサービス維持インセンティブ
- OTT解約:ストリーミングエクスペリエンス別
付録
SYNOPSIS:
This report examines the viewer journey for accessing desired video content across broadcast, traditional pay-TV and the many over-the-top (OTT) streaming video service models, including SVOD, AVOD/FAST, TVOD and vMVPD (streaming TV) services. Included is research that analyzes how households view content, how households prioritize and spend money, and how decisions are made to pay for some services over others. This study draws from Parks Associates' Q3 2023 survey of 8,000 U.S. internet households. The survey is demographically representative of US internet households, with quotas for age, income, gender, and educational attainment.
SAMPLE VIEW
Key questions addressed:
- 1) How are households signing up for their streaming subscriptions? Why do households subscribe to certain services over others?
- 2) On what devices do households consume video, and what type of services do households watch on various device?
- 3) When viewers first sit to find something to watch, what steps do they take?
- 4) How does the viewer journey differ when a household wants to watch a TV show or movie versus live sports or news?
- 5) How easy or hard is it for households to find something to watch? What is the discovery experience like?
ANALYST INSIGHT:
"The viewer journey continues to evolve. A once manageable process of watching video curated from a single source is now a source of frustration due to an overwhelming amount of content from which to choose, spread out across numerous services and platforms, and ever changing." - Sarah Lee, Research Analyst, Parks Associates.
Table of Contents
Survey Methodology and Definitions
- Key Terms and Definitions
- Pay-TV Definitions and Categorization
- Video Services Ecosystem
Executive Summary
- Reasons for Using OTT Service
- Reasons for Using a Service by Top Services
- Video Consumption on All Devices
- Method to Find Video Contents to Watch
- Discovery Method of Watching Video Contents
- Monthly Spending by Agreement Towards Streaming Attitudes
- Average Among OTT Subscribers
- OTT Churn by Streaming Experience
Overall Outlook: Streaming Adoption
- Penetration of Traditional vs. OTT Video Services
- Pay-TV & OTT Service Subscription Trend
- Pay-TV* and OTT Service Subscription Mix
- Number of OTT Service Subscriptions
- Average Number of OTT Service Subscriptions
- Number of OTT Service Subscriptions by Income
- Number of OTT Service Subscriptions by Children at Home
- Avg Number of OTT Services Across Business Models
- Major OTT Subscription Tier
- Platforms for Watching Social/User Generated Content
- Method of Subscribing to vMVPD Services
- Method of Subscribing to OTT Services
- Method of Subscribing Streaming TV Services by Services
Viewing Consumption: Devices and Services
- Reasons for Using OTT Service
- Reasons for Using a Service by Top Services
- Reasons for Using a Service by Other OTT Services
- Use of Devices for Video of Any Kind in the Past 30 Days
- Use of Devices for Video in the Past 30 Days by Age Groups
- Total Average Video Consumption by Platforms
- Video Consumption on All Devices
- Video Consumption on TV Set
- Video Consumption on a Mobile Phone
- Video Consumption on Tablet
- Video Consumption on Computer
- Genres of Online Content Viewed
First Choice and Steps
- Viewing Path to Content To Video on a TV
- First Choice for Watching TV and Movies on TV
- First Choice for Watching Live Sports on TV
- First Choice for Watching Live News on TV
- First Step When Finding Something New to Watch
- First Sources for Video Content on Connected TV Devices
Discovery and Experience
- Method to Find Video Contents to Watch
- Discovery Method of Watching Video Contents
- Discovery Method of Watching Video Contents by First Sources for Video Contents
- Monthly Spending by Agreement Towards Streaming Attitudes
- Average Among OTT and vMVPD Subscribers
- Viewing Experience with Ad-Based OTT Services
- Viewing Experience with Live Sports Events
Churn
- OTT Subscriber Churn
- OTT Service Retention Incentives
- OTT Churn by Streaming Experience

