|
|
市場調査レポート
商品コード
1452473
ベビーキャリア市場の評価:タイプ・年齢層・価格帯・流通チャネル・地域別の機会および予測 (2017~2031年)Baby Carrier Market Assessment, By Type, By Age Group, By Price Range, By Distribution Channel, By Region, Opportunities and Forecast, 2017-2031F |
||||||

|
|||||||
カスタマイズ可能
|
|||||||

| ベビーキャリア市場の評価:タイプ・年齢層・価格帯・流通チャネル・地域別の機会および予測 (2017~2031年) |
|
出版日: 2024年03月18日
発行: Markets & Data
ページ情報: 英文 226 Pages
納期: 3~5営業日
|

全表示
- 概要
- 図表
- 目次
世界のベビーキャリアの市場規模は、2023年の7億5,140万米ドルから、2024年から2031年の予測期間中は5.96%のCAGRで推移し、2031年には11億9,378万米ドルの規模に成長すると予測されています。
さまざまなカラーオプションが需要を牽引
保護者や保育者は、市場で入手できるベビーキャリアの色の選択肢が限られていることにしばしば直面します。高温多湿な気候の地域に住む人々は、一般的に微妙な色調の衣服を好みますが、涼しい気候の地域に住む人々は、太陽光を比較的多く吸収する暗い色調を中心に、さまざまな混色オプションを好みます。黒は他のどの色よりもホコリを受けやすいため、使用を避ける人もいます。
快適性、人間工学、低カーボンフットプリントへの需要の高まり
保育者は快適で、使いやすいベビーキャリアを求めています。優れた人間工学と高い快適性は、乳児をそばで見守りたいユーザーの欲求を満たします。SSC (Soft Structured Carriers) は、乳児をそばに置きながら生活を楽しむことができる、保育者にとって素晴らしい選択肢です。メーカー各社は、二酸化炭素排出量の少ない快適なキャリアを提供するため、品質と安全性に絶えず重点を置いています。
バックル付きベビーキャリアが市場を独占
一般にバックル付きベビーキャリアと呼ばれるSSC (Soft Structured Carriers) は、その利便性、快適性、多用途性で世界に知られており、世界で最も好まれるタイプのベビーキャリアとなっています。これらのキャリアには、パッド入りのショルダーストラップとサポート力のあるウエストベルトが付いており、乳児の体重を効果的に分散し、抱っこする側とされる側に長時間快適さを提供します。また、調節可能なストラップが付属しているため、体型やサイズに合わせて調節することができます。
北米が最大の市場シェアを占める
ベビーキャリアの世界市場では、北米が市場を独占しています。これは、親の人口が多いこと、経済が発展していること、人々が快適さと移動性を求めていることなどのいくつかの要因によるものです。国連のWorld Population Prospectsによると、この地域の出生率は2021年から2023年にかけて0.07%の増加を示しており、これが市場の成長を後押ししています。
北米のキャリアメーカーや小売業者は、多様なニーズや好みに合わせて幅広い製品を提供しています。同地域では、安全性と人間工学に基づいた快適性が求められているため、製造業者は厳しい基準を満たす高品質の製品を開発する傾向にあります。調節可能なストラップ、通気性の良いメッシュ生地、さまざまな姿勢で乳児を抱っこしやすいなどのイノベーションが、この地域の市場成長に貢献しています。
さらに、オンライン小売プラットフォームの台頭により、消費者は多くの選択肢にアクセスし、製品を比較することが容易になり、メーカー間の競合と技術革新を促進しています。品質、安全性、利便性を重視する北米は、世界のベビーキャリア業界の動向と嗜好を形成する上で主導権を握り続けています。
当レポートでは、世界のベビーキャリアの市場を調査し、市場の定義と概要、市場規模の推移・予測、各種区分・地域別の詳細分析、産業構造、市場成長への影響因子の分析、ケーススタディ、競合情勢、主要企業のプロファイルなどをまとめています。
目次
第1章 調査手法
第2章 プロジェクトの範囲と定義
第3章 エグゼクティブサマリー
第4章 顧客の声
- 人口統計
- 市場認知度と製品情報
- ブランド認知度とロイヤルティ
- 購入の決定において考慮される要素
- 購入目的
- 購入媒体
- 友人や家族からの推薦
- 製品/ブランドの浸透におけるブランドアンバサダーまたはインフルエンサーマーケティングの役割
第5章 世界のベビーキャリア市場の展望
- 市場規模・予測
- タイプ別
- スリングベビーキャリア
- ラップベビーキャリア
- バックル付きベビーキャリア
- その他
- 年齢別
- 乳児
- 幼児
- 価格帯別
- 低価格
- 高価格
- 流通チャネル別
- スーパーマーケット/ハイパーマーケット
- 専門店
- オンライン小売
- その他
- 地域別
- 北米
- 欧州
- 南米
- アジア太平洋
- 中東・アフリカ
- 企業別市場シェア
第6章 世界のベビーキャリア市場の展望:地域別
- 北米
- 欧州
- 南米
- アジア太平洋
- 中東・アフリカ
第7章 市場マッピング
- タイプ別
- 年齢層別
- 価格帯別
- 流通チャネル別
- 地域別
第8章 マクロ環境と産業構造
- 需給分析
- 輸出入分析
- バリューチェーン分析
- PESTEL分析
- ポーターのファイブフォース分析
第9章 市場力学
- 成長促進要因
- 成長阻害要因 (課題・抑制要因)
第10章 主要企業の情勢
- 市場リーダー上位5社の競合マトリックス
- 市場リーダー上位5社の市場収益分析
- M&A・ジョイントベンチャー (該当する場合)
- SWOT分析(参入5社)
- 特許分析(該当する場合)
第11章 価格分析
第12章 ケーススタディ
第13章 主要企業の見通し
- Goodbaby International Holdings Limited
- Artsana S.p.A.
- Ergobaby Inc.
- Lalabu LLC
- Moby Wrap Inc. (Thrive International, Inc.)
- Boba Inc.
- Onya Baby Inc.
- Chimparoo (L'echarpe Porte-bonheur inc.)
- Artipoppe B.V.
- WildBird, LLC
第14章 戦略的提言
第15章 当社について・免責事項
List of Tables
- Table 1. Pricing Analysis of Products from Key Players
- Table 2. Competition Matrix of Top 5 Market Leaders
- Table 3. Mergers & Acquisitions/ Joint Ventures (If Applicable)
- Table 4. About Us - Regions and Countries Where We Have Executed Client Projects
List of Figures
- Figure 1.Global Baby Carrier Market, By Value, In USD Million, 2017-2031F
- Figure 2.Global Baby Carrier Market, By Volume, In Units, 2017-2031F
- Figure 3.Global Baby Carrier Market Share (%), By Type, 2017-2031F
- Figure 4.Global Baby Carrier Market Share (%), By Age Group, 2017-2031F
- Figure 5.Global Baby Carrier Market Share (%), By Price Range, 2017-2031F
- Figure 6.Global Baby Carrier Market Share (%), By Distribution Channel, 2017-2031F
- Figure 7.Global Baby Carrier Market Share (%), By Region, 2017-2031F
- Figure 8.North America Baby Carrier Market, By Value, In USD Million, 2017-2031F
- Figure 9.North America Baby Carrier Market, By Volume, In Units, 2017-2031F
- Figure 10.North America Baby Carrier Market Share (%), By Type, 2017-2031F
- Figure 11.North America Baby Carrier Market Share (%), By Age Group, 2017-2031F
- Figure 12.North America Baby Carrier Market Share (%), By Price Range, 2017-2031F
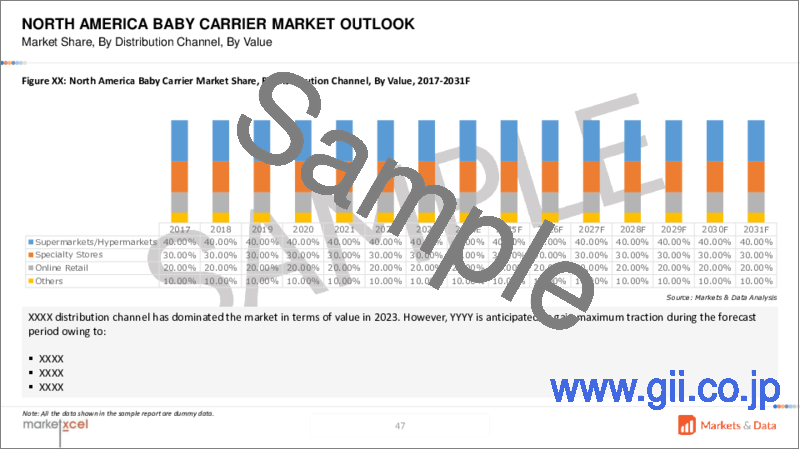
- Figure 13.North America Baby Carrier Market Share (%), By Distribution Channel, 2017-2031F
- Figure 14.North America Baby Carrier Market Share (%), By Country, 2017-2031F
- Figure 15.United States Baby Carrier Market, By Value, In USD Million, 2017-2031F
- Figure 16.United States Baby Carrier Market, By Volume, In Units, 2017-2031F
- Figure 17.United States Baby Carrier Market Share (%), By Type, 2017-2031F
- Figure 18.United States Baby Carrier Market Share (%), By Age Group, 2017-2031F
- Figure 19.United States Baby Carrier Market Share (%), By Price Range, 2017-2031F
- Figure 20.United States Baby Carrier Market Share (%), By Distribution Channel, 2017-2031F
- Figure 21.Canada Baby Carrier Market, By Value, In USD Million, 2017-2031F
- Figure 22.Canada Baby Carrier Market, By Volume, In Units, 2017-2031F
- Figure 23.Canada Baby Carrier Market Share (%), By Type, 2017-2031F
- Figure 24.Canada Baby Carrier Market Share (%), By Age Group, 2017-2031F
- Figure 25.Canada Baby Carrier Market Share (%), By Price Range, 2017-2031F
- Figure 26.Canada Baby Carrier Market Share (%), By Distribution Channel, 2017-2031F
- Figure 27.Mexico Baby Carrier Market, By Value, In USD Million, 2017-2031F
- Figure 28.Mexico Baby Carrier Market, By Volume, In Units, 2017-2031F
- Figure 29.Mexico Baby Carrier Market Share (%), By Type, 2017-2031F
- Figure 30.Mexico Baby Carrier Market Share (%), By Age Group, 2017-2031F
- Figure 31.Mexico Baby Carrier Market Share (%), By Price Range, 2017-2031F
- Figure 32.Mexico Baby Carrier Market Share (%), By Distribution Channel, 2017-2031F
- Figure 33.Europe Baby Carrier Market, By Value, In USD Million, 2017-2031F
- Figure 34.Europe Baby Carrier Market, By Volume, In Units, 2017-2031F
- Figure 35.Europe Baby Carrier Market Share (%), By Type, 2017-2031F
- Figure 36.Europe Baby Carrier Market Share (%), By Age Group, 2017-2031F
- Figure 37.Europe Baby Carrier Market Share (%), By Price Range, 2017-2031F
- Figure 38.Europe Baby Carrier Market Share (%), By Distribution Channel, 2017-2031F
- Figure 39.Europe Baby Carrier Market Share (%), By Country, 2017-2031F
- Figure 40.Germany Baby Carrier Market, By Value, In USD Million, 2017-2031F
- Figure 41.Germany Baby Carrier Market, By Volume, In Units, 2017-2031F
- Figure 42.Germany Baby Carrier Market Share (%), By Type, 2017-2031F
- Figure 43.Germany Baby Carrier Market Share (%), By Age Group, 2017-2031F
- Figure 44.Germany Baby Carrier Market Share (%), By Price Range, 2017-2031F
- Figure 45.Germany Baby Carrier Market Share (%), By Distribution Channel, 2017-2031F
- Figure 46.France Baby Carrier Market, By Value, In USD Million, 2017-2031F
- Figure 47.France Baby Carrier Market, By Volume, In Units, 2017-2031F
- Figure 48.France Baby Carrier Market Share (%), By Type, 2017-2031F
- Figure 49.France Baby Carrier Market Share (%), By Age Group, 2017-2031F
- Figure 50.France Baby Carrier Market Share (%), By Price Range, 2017-2031F
- Figure 51.France Baby Carrier Market Share (%), By Distribution Channel, 2017-2031F
- Figure 52.Italy Baby Carrier Market, By Value, In USD Million, 2017-2031F
- Figure 53.Italy Baby Carrier Market, By Volume, In Units, 2017-2031F
- Figure 54.Italy Baby Carrier Market Share (%), By Type, 2017-2031F
- Figure 55.Italy Baby Carrier Market Share (%), By Age Group, 2017-2031F
- Figure 56.Italy Baby Carrier Market Share (%), By Price Range, 2017-2031F
- Figure 57.Italy Baby Carrier Market Share (%), By Distribution Channel, 2017-2031F
- Figure 58.United Kingdom Baby Carrier Market, By Value, In USD Million, 2017-2031F
- Figure 59.United Kingdom Baby Carrier Market, By Volume, In Units, 2017-2031F
- Figure 60.United Kingdom Baby Carrier Market Share (%), By Type, 2017-2031F
- Figure 61.United Kingdom Baby Carrier Market Share (%), By Age Group, 2017-2031F
- Figure 62.United Kingdom Baby Carrier Market Share (%), By Price Range, 2017-2031F
- Figure 63.United Kingdom Baby Carrier Market Share (%), By Distribution Channel, 2017-2031F
- Figure 64.Russia Baby Carrier Market, By Value, In USD Million, 2017-2031F
- Figure 65.Russia Baby Carrier Market, By Volume, In Units, 2017-2031F
- Figure 66.Russia Baby Carrier Market Share (%), By Type, 2017-2031F
- Figure 67.Russia Baby Carrier Market Share (%), By Age Group, 2017-2031F
- Figure 68.Russia Baby Carrier Market Share (%), By Price Range, 2017-2031F
- Figure 69.Russia Baby Carrier Market Share (%), By Distribution Channel, 2017-2031F
- Figure 70.Netherlands Baby Carrier Market, By Value, In USD Million, 2017-2031F
- Figure 71.Netherlands Baby Carrier Market, By Volume, In Units, 2017-2031F
- Figure 72.Netherlands Baby Carrier Market Share (%), By Type, 2017-2031F
- Figure 73.Netherlands Baby Carrier Market Share (%), By Age Group, 2017-2031F
- Figure 74.Netherlands Baby Carrier Market Share (%), By Price Range, 2017-2031F
- Figure 75.Netherlands Baby Carrier Market Share (%), By Distribution Channel, 2017-2031F
- Figure 76.Spain Baby Carrier Market, By Value, In USD Million, 2017-2031F
- Figure 77.Spain Baby Carrier Market, By Volume, In Units, 2017-2031F
- Figure 78.Spain Baby Carrier Market Share (%), By Type, 2017-2031F
- Figure 79.Spain Baby Carrier Market Share (%), By Age Group, 2017-2031F
- Figure 80.Spain Baby Carrier Market Share (%), By Price Range, 2017-2031F
- Figure 81.Spain Baby Carrier Market Share (%), By Distribution Channel, 2017-2031F
- Figure 82.Turkey Baby Carrier Market, By Value, In USD Million, 2017-2031F
- Figure 83.Turkey Baby Carrier Market, By Volume, In Units, 2017-2031F
- Figure 84.Turkey Baby Carrier Market Share (%), By Type, 2017-2031F
- Figure 85.Turkey Baby Carrier Market Share (%), By Age Group, 2017-2031F
- Figure 86.Turkey Baby Carrier Market Share (%), By Price Range, 2017-2031F
- Figure 87.Turkey Baby Carrier Market Share (%), By Distribution Channel, 2017-2031F
- Figure 88.Poland Baby Carrier Market, By Value, In USD Million, 2017-2031F
- Figure 89.Poland Baby Carrier Market, By Volume, In Units, 2017-2031F
- Figure 90.Poland Baby Carrier Market Share (%), By Type, 2017-2031F
- Figure 91.Poland Baby Carrier Market Share (%), By Age Group, 2017-2031F
- Figure 92.Poland Baby Carrier Market Share (%), By Price Range, 2017-2031F
- Figure 93.Poland Baby Carrier Market Share (%), By Distribution Channel, 2017-2031F
- Figure 94.South America Baby Carrier Market, By Value, In USD Million, 2017-2031F
- Figure 95.South America Baby Carrier Market, By Volume, In Units, 2017-2031F
- Figure 96.South America Baby Carrier Market Share (%), By Type, 2017-2031F
- Figure 97.South America Baby Carrier Market Share (%), By Age Group, 2017-2031F
- Figure 98.South America Baby Carrier Market Share (%), By Price Range, 2017-2031F
- Figure 99.South America Baby Carrier Market Share (%), By Distribution Channel, 2017-2031F
- Figure 100.South America Baby Carrier Market Share (%), By Country, 2017-2031F
- Figure 101.Brazil Baby Carrier Market, By Value, In USD Million, 2017-2031F
- Figure 102.Brazil Baby Carrier Market, By Volume, In Units, 2017-2031F
- Figure 103.Brazil Baby Carrier Market Share (%), By Type, 2017-2031F
- Figure 104.Brazil Baby Carrier Market Share (%), By Age Group, 2017-2031F
- Figure 105.Brazil Baby Carrier Market Share (%), By Price Range, 2017-2031F
- Figure 106.Brazil Baby Carrier Market Share (%), By Distribution Channel, 2017-2031F
- Figure 107.Argentina Baby Carrier Market, By Value, In USD Million, 2017-2031F
- Figure 108.Argentina Baby Carrier Market, By Volume, In Units, 2017-2031F
- Figure 109.Argentina Baby Carrier Market Share (%), By Type, 2017-2031F
- Figure 110.Argentina Baby Carrier Market Share (%), By Age Group, 2017-2031F
- Figure 111.Argentina Baby Carrier Market Share (%), By Price Range, 2017-2031F
- Figure 112.Argentina Baby Carrier Market Share (%), By Distribution Channel, 2017-2031F
- Figure 113.Asia-Pacific Baby Carrier Market, By Value, In USD Million, 2017-2031F
- Figure 114.Asia-Pacific Baby Carrier Market, By Volume, In Units, 2017-2031F
- Figure 115.Asia-Pacific Baby Carrier Market Share (%), By Type, 2017-2031F
- Figure 116.Asia-Pacific Baby Carrier Market Share (%), By Age Group, 2017-2031F
- Figure 117.Asia-Pacific Baby Carrier Market Share (%), By Price Range, 2017-2031F
- Figure 118.Asia-Pacific Baby Carrier Market Share (%), By Distribution Channel, 2017-2031F
- Figure 119.Asia-Pacific Baby Carrier Market Share (%), By Country, 2017-2031F
- Figure 120.India Baby Carrier Market, By Value, In USD Million, 2017-2031F
- Figure 121.India Baby Carrier Market, By Volume, In Units, 2017-2031F
- Figure 122.India Baby Carrier Market Share (%), By Type, 2017-2031F
- Figure 123.India Baby Carrier Market Share (%), By Age Group, 2017-2031F
- Figure 124.India Baby Carrier Market Share (%), By Price Range, 2017-2031F
- Figure 125.India Baby Carrier Market Share (%), By Distribution Channel, 2017-2031F
- Figure 126.China Baby Carrier Market, By Value, In USD Million, 2017-2031F
- Figure 127.China Baby Carrier Market, By Volume, In Units, 2017-2031F
- Figure 128.China Baby Carrier Market Share (%), By Type, 2017-2031F
- Figure 129.China Baby Carrier Market Share (%), By Age Group, 2017-2031F
- Figure 130.China Baby Carrier Market Share (%), By Price Range, 2017-2031F
- Figure 131.China Baby Carrier Market Share (%), By Distribution Channel, 2017-2031F
- Figure 132.Japan Baby Carrier Market, By Value, In USD Million, 2017-2031F
- Figure 133.Japan Baby Carrier Market, By Volume, In Units, 2017-2031F
- Figure 134.Japan Baby Carrier Market Share (%), By Type, 2017-2031F
- Figure 135.Japan Baby Carrier Market Share (%), By Age Group, 2017-2031F
- Figure 136.Japan Baby Carrier Market Share (%), By Price Range, 2017-2031F
- Figure 137.Japan Baby Carrier Market Share (%), By Distribution Channel, 2017-2031F
- Figure 138.Australia Baby Carrier Market, By Value, In USD Million, 2017-2031F
- Figure 139.Australia Baby Carrier Market, By Volume, In Units, 2017-2031F
- Figure 140.Australia Baby Carrier Market Share (%), By Type, 2017-2031F
- Figure 141.Australia Baby Carrier Market Share (%), By Age Group, 2017-2031F
- Figure 142.Australia Baby Carrier Market Share (%), By Price Range, 2017-2031F
- Figure 143.Australia Baby Carrier Market Share (%), By Distribution Channel, 2017-2031F
- Figure 144.Vietnam Baby Carrier Market, By Value, In USD Million, 2017-2031F
- Figure 145.Vietnam Baby Carrier Market, By Volume, In Units, 2017-2031F
- Figure 146.Vietnam Baby Carrier Market Share (%), By Type, 2017-2031F
- Figure 147.Vietnam Baby Carrier Market Share (%), By Age Group, 2017-2031F
- Figure 148.Vietnam Baby Carrier Market Share (%), By Price Range, 2017-2031F
- Figure 149.Vietnam Baby Carrier Market Share (%), By Distribution Channel, 2017-2031F
- Figure 150.South Korea Baby Carrier Market, By Value, In USD Million, 2017-2031F
- Figure 151.South Korea Baby Carrier Market, By Volume, In Units, 2017-2031F
- Figure 152.South Korea Baby Carrier Market Share (%), By Type, 2017-2031F
- Figure 153.South Korea Baby Carrier Market Share (%), By Age Group, 2017-2031F
- Figure 154.South Korea Baby Carrier Market Share (%), By Price Range, 2017-2031F
- Figure 155.South Korea Baby Carrier Market Share (%), By Distribution Channel, 2017-2031F
- Figure 156.Indonesia Baby Carrier Market, By Value, In USD Million, 2017-2031F
- Figure 157.Indonesia Baby Carrier Market, By Volume, In Units, 2017-2031F
- Figure 158.Indonesia Baby Carrier Market Share (%), By Type, 2017-2031F
- Figure 159.Indonesia Baby Carrier Market Share (%), By Age Group, 2017-2031F
- Figure 160.Indonesia Baby Carrier Market Share (%), By Price Range, 2017-2031F
- Figure 161.Indonesia Baby Carrier Market Share (%), By Distribution Channel, 2017-2031F
- Figure 162.Philippines Baby Carrier Market, By Value, In USD Million, 2017-2031F
- Figure 163.Philippines Baby Carrier Market, By Volume, In Units, 2017-2031F
- Figure 164.Philippines Baby Carrier Market Share (%), By Type, 2017-2031F
- Figure 165.Philippines Baby Carrier Market Share (%), By Age Group, 2017-2031F
- Figure 166.Philippines Baby Carrier Market Share (%), By Price Range, 2017-2031F
- Figure 167.Philippines Baby Carrier Market Share (%), By Distribution Channel, 2017-2031F
- Figure 168.Middle East & Africa Baby Carrier Market, By Value, In USD Million, 2017-2031F
- Figure 169.Middle East & Africa Baby Carrier Market, By Volume, In Units, 2017-2031F
- Figure 170.Middle East & Africa Baby Carrier Market Share (%), By Type, 2017-2031F
- Figure 171.Middle East & Africa Baby Carrier Market Share (%), By Age Group, 2017-2031F
- Figure 172.Middle East & Africa Baby Carrier Market Share (%), By Price Range, 2017-2031F
- Figure 173.Middle East & Africa Baby Carrier Market Share (%), By Distribution Channel, 2017-2031F
- Figure 174.Middle East & Africa Baby Carrier Market Share (%), By Country, 2017-2031F
- Figure 175.Saudi Arabia Baby Carrier Market, By Value, In USD Million, 2017-2031F
- Figure 176.Saudi Arabia Baby Carrier Market, By Volume, In Units, 2017-2031F
- Figure 177.Saudi Arabia Baby Carrier Market Share (%), By Type, 2017-2031F
- Figure 178.Saudi Arabia Baby Carrier Market Share (%), By Age Group, 2017-2031F
- Figure 179.Saudi Arabia Baby Carrier Market Share (%), By Price Range, 2017-2031F
- Figure 180.Saudi Arabia Baby Carrier Market Share (%), By Distribution Channel, 2017-2031F
- Figure 181.UAE Baby Carrier Market, By Value, In USD Million, 2017-2031F
- Figure 182.UAE Baby Carrier Market, By Volume, In Units, 2017-2031F
- Figure 183.UAE Baby Carrier Market Share (%), By Type, 2017-2031F
- Figure 184.UAE Baby Carrier Market Share (%), By Age Group, 2017-2031F
- Figure 185.UAE Baby Carrier Market Share (%), By Price Range, 2017-2031F
- Figure 186.UAE Baby Carrier Market Share (%), By Distribution Channel, 2017-2031F
- Figure 187.South Africa Baby Carrier Market, By Value, In USD Million, 2017-2031F
- Figure 188.South Africa Baby Carrier Market, By Volume, In Units, 2017-2031F
- Figure 189.South Africa Baby Carrier Market Share (%), By Type, 2017-2031F
- Figure 190.South Africa Baby Carrier Market Share (%), By Age Group, 2017-2031F
- Figure 191.South Africa Baby Carrier Market Share (%), By Price Range, 2017-2031F
- Figure 192.South Africa Baby Carrier Market Share (%), By Distribution Channel, 2017-2031F
- Figure 193.By Type Map-Market Size (USD Million) & Growth Rate (%), 2023
- Figure 194.By Age Group Map-Market Size (USD Million) & Growth Rate (%), 2023
- Figure 195.By Price Range Map-Market Size (USD Million) & Growth Rate (%), 2023
- Figure 196.By Distribution Channel Map-Market Size (USD Million) & Growth Rate (%), 2023
- Figure 197.By Region Map-Market Size (USD Million) & Growth Rate (%), 2023
Global baby carrier market was valued at USD 751.4 million in 2023, expected to reach USD 1193.78 million in 2031, with a CAGR of 5.96% for the forecast period between 2024 and 2031. The market comes with a variety of product options for parents and caregivers to carry their infants and toddlers easily and comfortably. Based on various needs and preferences of the users, baby carriers are available in several types including sling baby carriers, wrap baby carriers, and buckled baby carriers.
Padded carriers that provide better support for the lower back are favored by many users. People generally look for carriers that provide ease of adjusting and allow them to have longer outings and activities that require longer times. The focus on ergonomic designs as well as safety features become of utmost importance to the users as the trend for traveling is becoming favorable for parents with infants. The product should be designed in such a way that the weight of the baby is distributed evenly with proper support and comfort to the baby.
The material of the carriage is another significant feature to be considered by the users. It should be breathable for the baby and the caregiver, but at the same time, sustainable and eco-friendly. Innovative designs using organic fabrics, non-toxic dyes, and recycled materials are being produced by manufacturers to appeal to consumers who are conscious of the environment.
Additionally, the availability of these baby carriers over online retail stores is a driver for the global baby carrier market as it offers ease to prospective buyers to search, compare, and make the final purchase sitting in the comfort of their homes.
Considering the ongoing market trends, Sweden-based Najell AB launched its new baby carrier, the Najell Easy Baby Carrier, which is ergonomic, lightweight, and easy to use. The new launch removed the extra settings that are generally found while switching the carrying positions. Little changes make it a go-to option for caregivers as ease of use is often the most sought-after feature of baby carriers.
Availability of Various Color Options Driving the Demand
Parents or caregivers often face problems with the limited color options for baby carriers available in the market. People residing in areas with hot and humid climates generally prefer subtle tones for clothing, whereas the ones residing in areas with cooler climates prefer a variety of mixed color options, with a focus on darker shades as they absorb comparatively more sunlight. On the contrary, some people avoid using black color as it catches dust more than any other color.
Other factors related to choosing the right color of the carrier include the risks of mess that the baby may create, ending up dirtying the carrier. Problems like spit-ups and diaper mishaps, which are very frequent while dealing with infants, tend to increase the work of the caregiver in terms of washing and cleaning up the carrier every now and then. Addressing all these concerns, manufacturers have now started developing vast color options for baby carrier customers to choose and buy from.
For instance, in December 2023, BabyBjorn, a renowned manufacturer of baby products, launched two of its leading baby carrier models, Baby Carrier Mini and Bouncer Bliss, in a new bright green color. Both the models are suitable for newborns up to a year with compact and user-friendly design.
Increased Demand for Comfort and Ergonomics Along with a Lower Carbon Footprint
Caregivers seek baby carriers that are comfortable but at the same time, they should be easy to use. Great ergonomics and greater comfort level fulfill the desire of the users to keep the baby close. Soft Structured Carriers (SSC) come as a great option for caregivers that allow them to enjoy life while keeping the baby close. Manufacturers continuously focus on quality and safety to provide comfortable baby carriers with a lower carbon footprint.
Ergobaby Inc. initiated the idea of encouraging caregivers to sell back their pre-loved carriers when not in use, so that the same may be refurbished and brought back to the market. Refurbished baby carriers lead to 80 percent less carbon emissions as compared to manufacturing new ones. Testing new products and manufacturing them takes months to years, which is why refurbishing the old ones tends to save time and effort, reducing the carbon footprint in the long as well as short term. The sustainability factor is expected to keep the market in the long run.
Buckled Baby Carriers Dominate the Market
Soft-structured carriers (SSCs), commonly referred to as buckled baby carriers, are globally known for their convenience, comfort, and versatility, making them the most desired type of baby carrier all over the world. These carriers come with padded shoulder straps and a supportive waist belt that effectively distributes the baby's weight and gives long-lasting comfort to the caregiver and the child. They are user-friendly and come with adjustable straps and settings allowing the user to adjust as per the body shape and size.
Moreover, buckled baby carriers offer greater safety and reliability to caregivers. Companies run various tests for these products to meet the safety standards that lead to offering peace of mind to users worldwide. Additionally, manufacturers are working on developing modern aesthetic designs depending on the diverse tastes of consumers. Free-to-grow baby carriers from Baby Tula, LLC offer the same convenience to their users. They come in breathable fabric, with unique prints and designs, are lightweight, easily adjustable, and can fit a newborn as well as a toddler. They even provide two ergonomic carrying positions, back carry and front-facing.
North America Holds the Largest Market Share
In the global baby carrier market, North America dominates the market based on region, due to several factors like large parents' population, vast economy and the desire of people for comfort and mobility. As per the United Nations, World Population Prospects, the region's birth rate showed a 0.07% increase from 2021 to 2023, which is boosting the growth of the market.
The manufacturers and retailers of baby carriers in North America offer a wide range of products to people as per their varied needs and preferences. The demand for safety and ergonomics with comfort in the region is driving the producers to come up with products of high-quality meeting stringent standards. Innovations in the form of adjustable straps, breathable mesh fabrics, and ease of carrying the baby in various positions contribute to the growth of the market in the region.
Additionally, the rise of online retail platforms has made it easier for consumers to access a plethora of options and compare products, driving competition and innovation among manufacturers. With a strong emphasis on quality, safety, and convenience, North America continues to lead the way in shaping the trends and preferences of the global baby carrier industry.
Future Market Scenario (2024 - 2031F)
The market is expected to introduce innovations in products on a large scale like smart baby carriers with integrated sensors for monitoring baby's health and comfort.
There will be a focus on producing eco-friendly products and adopting sustainable manufacturing processes to align with consumer preferences for sustainable parenting products.
The market will prioritize an increasing trend towards customizable features and designs, allowing parents to tailor baby carriers to their individual needs and preferences.
Key Players Landscape and Outlook
Global baby carrier market features a landscape dominated by key players such as Ergobaby Inc., Lalabu LLC, WildBird, LLC, and Boba Inc. These companies continue to drive innovation in the industry, offering a wide range of products catering to various needs and preferences of parents worldwide. With a focus on safety, comfort, and ergonomic design, these key players are expected to maintain their market leadership positions in the future.
The outlook for global baby carrier market remains positive, fueled by factors such as rising birth rates, increasing urbanization, and growing emphasis on convenience and mobility for parents. Additionally, technological advancements, such as the integration of smart features and sustainability initiatives, are expected to further drive market growth. As consumer preferences evolve and awareness of ergonomic benefits continue to grow, key players are likely to invest in research and development to introduce innovative products that meet the changing demands of the market.
In October 2022, WildBird, LLC launched the new Aerial Buckle carrier, which was available in two varied size ranges, XS-L and L-4XL. The carrier is innovatively designed and can hold babies from birth to 45 lbs.
Table of Contents
1.Research Methodology
2.Project Scope & Definitions
3.Executive Summary
4.Voice of Customer
- 4.1.Demographics (Age/Cohort Analysis - Baby Boomers and Gen X, Millennials, Gen Z; Gender; Income - Low, Mid, and High; Geography; Nationality; etc.)
- 4.2.Market Awareness and Product Information
- 4.3.Brand Awareness and Loyalty
- 4.4.Factors Considered in Purchase Decision
- 4.4.1.Brand Name
- 4.4.2.Safety
- 4.4.3.Comfort
- 4.4.4.Ease of Use
- 4.4.5.Versatility
- 4.4.6.Durability and Quality
- 4.4.7.Material Used
- 4.4.8.Size and Shape
- 4.4.9.Price
- 4.4.10.Sustainability Concern
- 4.5.Purpose of Purchase
- 4.6.Medium of Purchase
- 4.7.Recommendations from friends/family
- 4.8.Role of Brand Ambassador or Influencer Marketing on Product/Brand Absorption.
5.Global Baby Carrier Market Outlook, 2017-2031F
- 5.1.Market Size & Forecast
- 5.1.1.By Value
- 5.1.2.By Volume
- 5.2.By Type
- 5.2.1.Sling Baby Carrier
- 5.2.2.Wrap Baby Carrier
- 5.2.3.Buckled Baby Carrier
- 5.2.4.Others
- 5.3.By Age Group
- 5.3.1.Infants
- 5.3.2.Toddlers
- 5.4.By Price Range
- 5.4.1.Mass
- 5.4.2.Premium
- 5.5.By Distribution Channel
- 5.5.1.Supermarkets/Hypermarkets
- 5.5.2.Specialty Stores
- 5.5.3.Online Retail
- 5.5.4.Others
- 5.6.By Region
- 5.6.1.North America
- 5.6.2.Europe
- 5.6.3.South America
- 5.6.4.Asia-Pacific
- 5.6.5.Middle East and Africa
- 5.7.By Company Market Share (%), 2023
6.Global Baby Carrier Market Outlook, By Region, 2017-2031F
- 6.1.North America*
- 6.1.1.Market Size & Forecast
- 6.1.1.1.By Value
- 6.1.1.2.By Volume
- 6.1.2.By Type
- 6.1.2.1.Sling Baby Carrier
- 6.1.2.2.Wrap Baby Carrier
- 6.1.2.3.Buckled Baby Carrier
- 6.1.2.4.Others
- 6.1.3.By Age Group
- 6.1.3.1.Infants
- 6.1.3.2.Toddlers
- 6.1.4.By Price Range
- 6.1.4.1.Mass
- 6.1.4.2.Premium
- 6.1.5.By Distribution Channel
- 6.1.5.1.Supermarkets/Hypermarkets
- 6.1.5.2.Specialty Stores
- 6.1.5.3.Online Retail
- 6.1.5.4.Others
- 6.1.6.United States*
- 6.1.6.1.Market Size & Forecast
- 6.1.6.1.1.By Value
- 6.1.6.1.2.By Volume
- 6.1.6.2.By Type
- 6.1.6.2.1.Sling Baby Carrier
- 6.1.6.2.2.Wrap Baby Carrier
- 6.1.6.2.3.Buckled Baby Carrier
- 6.1.6.2.4.Others
- 6.1.6.3.By Age Group
- 6.1.6.3.1.Infants
- 6.1.6.3.2.Toddlers
- 6.1.6.4.By Price Range
- 6.1.6.4.1.Mass
- 6.1.6.4.2.Premium
- 6.1.6.5.By Distribution Channel
- 6.1.6.5.1.Supermarkets/Hypermarkets
- 6.1.6.5.2.Specialty Stores
- 6.1.6.5.3.Online Retail
- 6.1.6.5.4.Others
- 6.1.7.Canada
- 6.1.8.Mexico
- 6.1.1.Market Size & Forecast
All segments will be provided for all regions and countries covered
- 6.2.Europe
- 6.2.1.Germany
- 6.2.2.France
- 6.2.3.Italy
- 6.2.4.United Kingdom
- 6.2.5.Russia
- 6.2.6.Netherlands
- 6.2.7.Spain
- 6.2.8.Turkey
- 6.2.9.Poland
- 6.3.South America
- 6.3.1.Brazil
- 6.3.2.Argentina
- 6.4.Asia-Pacific
- 6.4.1.India
- 6.4.2.China
- 6.4.3.Japan
- 6.4.4.Australia
- 6.4.5.Vietnam
- 6.4.6.South Korea
- 6.4.7.Indonesia
- 6.4.8.Philippines
- 6.5.Middle East & Africa
- 6.5.1.UAE
- 6.5.2.Saudi Arabia
- 6.5.3.South Africa
7.Market Mapping, 2023
- 7.1.By Type
- 7.2.By Age Group
- 7.3.By Price Range
- 7.4.By Distribution Channel
- 7.5.By Region
8.Macro Environment and Industry Structure
- 8.1.Supply Demand Analysis
- 8.2.Import Export Analysis
- 8.3.Value Chain Analysis
- 8.4.PESTEL Analysis
- 8.4.1.Political Factors
- 8.4.2.Economic System
- 8.4.3.Social Implications
- 8.4.4.Technological Advancements
- 8.4.5.Environmental Impacts
- 8.4.6.Legal Compliances and Regulatory Policies (Statutory Bodies Included)
- 8.5.Porter's Five Forces Analysis
- 8.5.1.Supplier Power
- 8.5.2.Buyer Power
- 8.5.3.Substitution Threat
- 8.5.4.Threat from New Entrant
- 8.5.5.Competitive Rivalry
9.Market Dynamics
- 9.1.Growth Drivers
- 9.2.Growth Inhibitors (Challenges and Restraints)
10.Key Players Landscape
- 10.1.Competition Matrix of Top Five Market Leaders
- 10.2.Market Revenue Analysis of Top Five Market Leaders (in %, 2023)
- 10.3.Mergers and Acquisitions/Joint Ventures (If Applicable)
- 10.4.SWOT Analysis (For Five Market Players)
- 10.5.Patent Analysis (If Applicable)
11.Pricing Analysis
12.Case Studies
13.Key Players Outlook
- 13.1.Goodbaby International Holdings Limited
- 13.1.1.Company Details
- 13.1.2.Key Management Personnel
- 13.1.3.Products & Services
- 13.1.4.Financials (As reported)
- 13.1.5.Key Market Focus & Geographical Presence
- 13.1.6.Recent Developments
- 13.2.Artsana S.p.A.
- 13.3.Ergobaby Inc.
- 13.4.Lalabu LLC
- 13.5.Moby Wrap Inc. (Thrive International, Inc.)
- 13.6.Boba Inc.
- 13.7.Onya Baby Inc.
- 13.8.Chimparoo (L'echarpe Porte-bonheur inc.)
- 13.9.Artipoppe B.V.
- 13.10.WildBird, LLC
Companies mentioned above DO NOT hold any order as per market share and can be changed as per information available during research work

