|
|
市場調査レポート
商品コード
1417589
生物学的製剤の世界市場の評価:製品別、用途別、医薬品分類別、購入方式別、流通チャネル別、地域別、機会、予測(2017年~2031年)Biologics Market Assessment, By Product By Application By Drug Classification, By Mode of Purchase By Distribution Channel By Region, Opportunities and Forecast, 2017-2031F |
||||||

|
|||||||
カスタマイズ可能
|
|||||||

| 生物学的製剤の世界市場の評価:製品別、用途別、医薬品分類別、購入方式別、流通チャネル別、地域別、機会、予測(2017年~2031年) |
|
出版日: 2024年01月29日
発行: Markets & Data
ページ情報: 英文 242 Pages
納期: 3~5営業日
|

全表示
- 概要
- 図表
- 目次
世界の生物学的製剤の市場規模は、2023年に4,013億4,000万米ドル、2031年に6,957億9,000万米ドルに達し、2024年~2031年の予測期間にCAGRで7.12%の成長が見込まれています。慢性疾患の罹患率と診断の増加は、先進の診断と治療薬に対する大きな需要を生み出し、結果として世界の生物学的製剤市場を後押ししています。このような特殊な医薬品は、炎症を引き起こす免疫系の特定の成分を標的とするように遺伝子改変されています。COVID-19疾患の登場に伴い、世界各国の政府は医療産業を強化し、生物学的製剤の利用可能性を確保するための対策を講じています。
同時に、科学者や研究者は生物学的製剤の効率を高めるために、さまざまな生物種や発現系を模索しています。さらに、多くの製薬企業が関節炎の経口薬の効果を高めることを目的とした研究開発に取り組んでいます。低分子医薬品の研究開発における生産性が低下していることから、生物学的製剤市場の大幅な躍進が今後数年に予測されます。これらの製薬企業は、市場での優位性を維持するために、さまざまな生物学的製剤の開発を積極的に進めています。クローン病や関節リウマチのような疾患向けの経口薬がより効果的になるにつれて、より多くの中等症患者が新たにブランド化された治療薬に移行すると予測されます。さらに、これらの新たな化合物は、従来の治療に抵抗を示していた患者に代替の治療法を提供し、多くの場合、優れた安全性と有効性を示します。
慢性疾患の高い有病率
世界の生物学的製剤市場は、慢性疾患の高い有病率によって大きな影響を受けています。がん、糖尿病、自己免疫疾患、心血管疾患などの慢性疾患は、世界的にますます流行しています。生物由来の医薬品である生物学的製剤は、これらの疾患の多くに対する重要な治療オプションとして浮上しています。これらの複雑な分子は標的療法を提供し、多くの場合、従来の医薬品よりも副作用が少なく、有効性が高いです。
例えば、世界保健機関(WHO)が2023年9月に発表したレポートによると、非感染性疾患(NCDs)で命を落とす人は年間約4,100万人で、これは世界の総死亡者数の74%に相当します。毎年、およそ1,700万人が70歳になる前にNCDsで命を落としており、これらの早すぎる死亡の86%は世界規模で発生しています。世界では毎年4,100万人以上が慢性疾患で命を落としています。なかでも、心血管疾患が年間1,790万人の死亡をもたらし、次いでがん、糖尿病、呼吸器疾患となっています。これら4つのカテゴリを合わせると、慢性疾患による死亡者数の80%を占めます。慢性疾患の流行が、診断と治療の進歩に拍車をかけています。
研究開発の重視の高まり
市場の拡大は、研究開発活動の重視の高まりによって推進されており、生物学的製剤市場の成長に有利な見通しをもたらすと予測されています。さらに、科学者や研究者は生物学的製剤の生産性を高めるため、さまざまな生物種や発現系を探索しています。いくつかの製薬企業は、関節リウマチやクローン病などの症状に対する経口薬の有効性を改善することを目的とした研究開発活動に従事しています。さらに、医薬品の承認や導入の加速も、市場の成長軌道を後押ししています。
例えば、2023年1月、レカネマブは米国FDAの早期承認経路を介してアルツハイマー病治療薬として承認されました。2022年6月にはAlnylamが、遺伝性トランスサイレチンを介するアミロイドーシスに伴う多発性神経障害の治療を目的としたRNAi治療薬アムヴトラのFDA承認を取得しました。
主要企業による投資の拡大
世界の生物学的製剤市場は主要企業による投資の急増が続いており、これはこの部門の成長と可能性を示しています。主要製薬企業、バイオテクノロジー企業、研究機関は、生物学的製剤の研究開発と製造に多額の投資を行っています。こうした資金投入の目的は、イノベーションの強化、製品ポートフォリオの拡充、製造技術の向上であり、最終的に先進の個別化医療ソリューションへの需要の高まりに応えるものです。
競合情勢は急速に進化しており、各社はがん、自己免疫疾患、感染症など多様な治療領域に焦点を当て、新たな生物学的製剤の導入を計画しています。投資動向の拡大は、世界の医療課題に対する画期的な進歩や治療オプションの向上を促進し、市場の有望な将来性に対する業界の自信を示すものです。
当レポートでは、世界の生物学的製剤市場について調査分析し、市場規模と予測、市場力学、主要企業情勢と見通しなどを提供しています。
目次
第1章 調査手法
第2章 プロジェクトの範囲と定義
第3章 世界の生物学的製剤市場に対するCOVID-19の影響
第4章 エグゼクティブサマリー
第5章 世界の生物学的製剤市場の見通し(2017年~2031年)
- 市場規模と予測
- 金額
- 数量
- 製品別
- モノクローナル抗体
- 組み換えホルモン/タンパク質
- ワクチン
- 細胞ベースの生物学的製剤
- 遺伝子ベースの生物学的製剤
- 治療用酵素
- その他
- 用途別
- 感染症
- がん
- 自己免疫疾患
- 心血管
- 血液疾患
- その他
- 医薬品分類別
- ブランド医薬品
- ジェネリック医薬品
- 購入方式別
- 処方薬
- OTC医薬品
- 流通チャネル別
- 病院薬局
- 小売薬局
- オンライン薬局
- その他
- 地域別
- 北米
- 欧州
- アジア太平洋
- 南米
- 中東・アフリカ
- 市場シェア:企業別(2023年)
第6章 世界の生物学的製剤市場の見通し:地域別(2017年~2031年)
- 北米
- 市場規模と予測
- 製品別
- 用途別
- 医薬品分類別
- 購入方式別
- 流通チャネル別
- 米国
- 欧州
- ドイツ
- フランス
- イタリア
- 英国
- ロシア
- オランダ
- スペイン
- トルコ
- ポーランド
- 南米
- ブラジル
- メキシコ
- アルゼンチン
- アジア太平洋
- インド
- 中国
- 日本
- オーストラリア
- ベトナム
- 韓国
- インドネシア
- フィリピン
- 中東・アフリカ
- サウジアラビア
- アラブ首長国連邦
- 南アフリカ
第7章 市場マッピング(2023年)
- 製品別
- 用途別
- 医薬品分類別
- 購入方式別
- 流通チャネル別
- 地域別
第8章 マクロ環境と産業構造
- 需給分析
- 輸出入の分析 - 数量と金額
- サプライ/バリューチェーン分析
- PESTEL分析
- ポーターのファイブフォース分析
第9章 市場力学
- 成長促進要因
- 成長抑制要因(課題、抑制要因)
第10章 規制枠組みとイノベーション
- 臨床試験
- 特許情勢
- 規制当局の承認
- イノベーション/新技術
第11章 主要企業情勢
- マーケットリーダー上位5社の競合マトリクス
- マーケットリーダー上位5社の市場収益分析(2023年)
- 合併と買収/合弁事業(該当する場合)
- SWOT分析(市場参入企業5社)
- 特許分析(該当する場合)
第12章 価格分析
第13章 ケーススタディ
第14章 主要企業の見通し
- F. Hoffmann La-Roche Ltd.
- Samsung Biologics
- Amgen Inc.
- Novo Nordisk A/S
- AbbVie Inc.
- Sanofi
- Johnson & Johnson Services, Inc.
- Celltrion Healthcare Co., Ltd.
- Bristol-Myers Squibb Company
- Eli Lilly and Company
第15章 戦略的推奨事項
第16章 当社について、免責事項
List of Tables
- Table 1. Pricing Analysis of Products from Key Players
- Table 2. Competition Matrix of Top 5 Market Leaders
- Table 3. Mergers & Acquisitions/ Joint Ventures (If Applicable)
- Table 4. About Us - Regions and Countries Where We Have Executed Client Projects
List of Figures
- Figure 1. Global Biologics Market, By Value, In USD Billion, 2017-2031F
- Figure 2. Global Biologics Market, By Volume, In Thousand Units, 2017-2031F
- Figure 3. Global Biologics Market Share (%), By Product, 2017-2031F
- Figure 4. Global Biologics Market Share (%), By Application, 2017-2031F
- Figure 5. Global Biologics Market Share (%), By Drug Classification, 2017-2031F
- Figure 6. Global Biologics Market Share (%), By Mode of Purchase, 2017-2031F
- Figure 7. Global Biologics Market Share (%), By Distribution Channel, 2017-2031F
- Figure 8. Global Biologics Market Share (%), By Region, 2017-2031F
- Figure 9. North America Biologics Market, By Value, In USD Billion, 2017-2031F
- Figure 10. North America Biologics Market, By Volume, In Thousand Units, 2017-2031F
- Figure 11. North America Biologics Market Share (%), By Product, 2017-2031F
- Figure 12. North America Biologics Market Share (%), By Application, 2017-2031F
- Figure 13. North America Biologics Market Share (%), By Drug Classification, 2017-2031F
- Figure 14. North America Biologics Market Share (%), By Mode of Purchase, 2017-2031F
- Figure 15. North America Biologics Market Share (%), By Distribution Channel, 2017-2031F
- Figure 16. North America Biologics Market Share (%), By Country, 2017-2031F
- Figure 17. United States Biologics Market, By Value, In USD Billion, 2017-2031F
- Figure 18. United States Biologics Market, By Volume, In Thousand Units, 2017-2031F
- Figure 19. United States Biologics Market Share (%), By Product, 2017-2031F
- Figure 20. United States Biologics Market Share (%), By Application, 2017-2031F
- Figure 21. United States Biologics Market Share (%), By Drug Classification, 2017-2031F
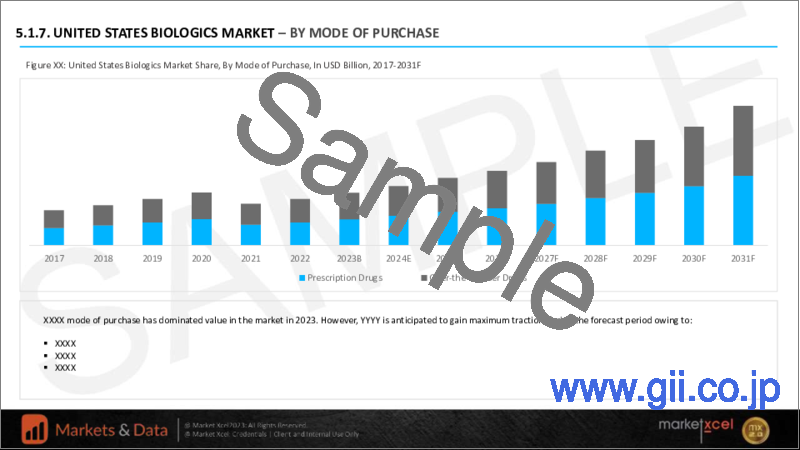
- Figure 22. United States Biologics Market Share (%), By Mode of Purchase, 2017-2031F
- Figure 23. United States Biologics Market Share (%), By Distribution Channel, 2017-2031F
- Figure 24. Canada Biologics Market, By Value, In USD Billion, 2017-2031F
- Figure 25. Canada Biologics Market, By Volume, In Thousand Units, 2017-2031F
- Figure 26. Canada Biologics Market Share (%), By Product, 2017-2031F
- Figure 27. Canada Biologics Market Share (%), By Application, 2017-2031F
- Figure 28. Canada Biologics Market Share (%), By Drug Classification, 2017-2031F
- Figure 29. Canada Biologics Market Share (%), By Mode of Purchase, 2017-2031F
- Figure 30. Canada Biologics Market Share (%), By Distribution Channel, 2017-2031F
- Figure 31. Mexico Biologics Market, By Value, In USD Billion, 2017-2031F
- Figure 32. Mexico Biologics Market, By Volume, In Thousand Units, 2017-2031F
- Figure 33. Mexico Biologics Market Share (%), By Product, 2017-2031F
- Figure 34. Mexico Biologics Market Share (%), By Application, 2017-2031F
- Figure 35. Mexico Biologics Market Share (%), By Drug Classification, 2017-2031F
- Figure 36. Mexico Biologics Market Share (%), By Mode of Purchase, 2017-2031F
- Figure 37. Mexico Biologics Market Share (%), By Distribution Channel, 2017-2031F
- Figure 38. Europe Biologics Market, By Value, In USD Billion, 2017-2031F
- Figure 39. Europe Biologics Market, By Volume, In Thousand Units, 2017-2031F
- Figure 40. Europe Biologics Market Share (%), By Product, 2017-2031F
- Figure 41. Europe Biologics Market Share (%), By Application, 2017-2031F
- Figure 42. Europe Biologics Market Share (%), By Drug Classification, 2017-2031F
- Figure 43. Europe Biologics Market Share (%), By Mode of Purchase, 2017-2031F
- Figure 44. Europe Biologics Market Share (%), By Distribution Channel, 2017-2031F
- Figure 45. Europe Biologics Market Share (%), By Country, 2017-2031F
- Figure 46. Germany Biologics Market, By Value, In USD Billion, 2017-2031F
- Figure 47. Germany Biologics Market, By Volume, In Thousand Units, 2017-2031F
- Figure 48. Germany Biologics Market Share (%), By Product, 2017-2031F
- Figure 49. Germany Biologics Market Share (%), By Application, 2017-2031F
- Figure 50. Germany Biologics Market Share (%), By Drug Classification, 2017-2031F
- Figure 51. Germany Biologics Market Share (%), By Mode of Purchase, 2017-2031F
- Figure 52. Germany Biologics Market Share (%), By Distribution Channel, 2017-2031F
- Figure 53. France Biologics Market, By Value, In USD Billion, 2017-2031F
- Figure 54. France Biologics Market, By Volume, In Thousand Units, 2017-2031F
- Figure 55. France Biologics Market Share (%), By Product, 2017-2031F
- Figure 56. France Biologics Market Share (%), By Application, 2017-2031F
- Figure 57. France Biologics Market Share (%), By Drug Classification, 2017-2031F
- Figure 58. France Biologics Market Share (%), By Mode of Purchase, 2017-2031F
- Figure 59. France Biologics Market Share (%), By Distribution Channel, 2017-2031F
- Figure 60. Italy Biologics Market, By Value, In USD Billion, 2017-2031F
- Figure 61. Italy Biologics Market, By Volume, In Thousand Units, 2017-2031F
- Figure 62. Italy Biologics Market Share (%), By Product, 2017-2031F
- Figure 63. Italy Biologics Market Share (%), By Application, 2017-2031F
- Figure 64. Italy Biologics Market Share (%), By Drug Classification, 2017-2031F
- Figure 65. Italy Biologics Market Share (%), By Mode of Purchase, 2017-2031F
- Figure 66. Italy Biologics Market Share (%), By Distribution Channel, 2017-2031F
- Figure 67. United Kingdom Biologics Market, By Value, In USD Billion, 2017-2031F
- Figure 68. United Kingdom Biologics Market, By Volume, In Thousand Units, 2017-2031F
- Figure 69. United Kingdom Biologics Market Share (%), By Product, 2017-2031F
- Figure 70. United Kingdom Biologics Market Share (%), By Application, 2017-2031F
- Figure 71. United Kingdom Biologics Market Share (%), By Drug Classification, 2017-2031F
- Figure 72. United Kingdom Biologics Market Share (%), By Mode of Purchase, 2017-2031F
- Figure 73. United Kingdom Biologics Market Share (%), By Distribution Channel, 2017-2031F
- Figure 74. Russia Biologics Market, By Value, In USD Billion, 2017-2031F
- Figure 75. Russia Biologics Market, By Volume, In Thousand Units, 2017-2031F
- Figure 76. Russia Biologics Market Share (%), By Product, 2017-2031F
- Figure 77. Russia Biologics Market Share (%), By Application, 2017-2031F
- Figure 78. Russia Biologics Market Share (%), By Drug Classification, 2017-2031F
- Figure 79. Russia Biologics Market Share (%), By Mode of Purchase, 2017-2031F
- Figure 80. Russia Biologics Market Share (%), By Distribution Channel, 2017-2031F
- Figure 81. Netherlands Biologics Market, By Value, In USD Billion, 2017-2031F
- Figure 82. Netherlands Biologics Market, By Volume, In Thousand Units, 2017-2031F
- Figure 83. Netherlands Biologics Market Share (%), By Product, 2017-2031F
- Figure 84. Netherlands Biologics Market Share (%), By Application, 2017-2031F
- Figure 85. Netherlands Biologics Market Share (%), By Drug Classification, 2017-2031F
- Figure 86. Netherlands Biologics Market Share (%), By Mode of Purchase, 2017-2031F
- Figure 87. Netherlands Biologics Market Share (%), By Distribution Channel, 2017-2031F
- Figure 88. Spain Biologics Market, By Value, In USD Billion, 2017-2031F
- Figure 89. Spain Biologics Market, By Volume, In Thousand Units, 2017-2031F
- Figure 90. Spain Biologics Market Share (%), By Product, 2017-2031F
- Figure 91. Spain Biologics Market Share (%), By Application, 2017-2031F
- Figure 92. Spain Biologics Market Share (%), By Drug Classification, 2017-2031F
- Figure 93. Spain Biologics Market Share (%), By Mode of Purchase, 2017-2031F
- Figure 94. Spain Biologics Market Share (%), By Distribution Channel, 2017-2031F
- Figure 95. Turkey Biologics Market, By Value, In USD Billion, 2017-2031F
- Figure 96. Turkey Biologics Market, By Volume, In Thousand Units, 2017-2031F
- Figure 97. Turkey Biologics Market Share (%), By Product, 2017-2031F
- Figure 98. Turkey Biologics Market Share (%), By Application, 2017-2031F
- Figure 99. Turkey Biologics Market Share (%), By Drug Classification, 2017-2031F
- Figure 100. Turkey Biologics Market Share (%), By Mode of Purchase, 2017-2031F
- Figure 101. Turkey Biologics Market Share (%), By Distribution Channel, 2017-2031F
- Figure 102. Poland Biologics Market, By Value, In USD Billion, 2017-2031F
- Figure 103. Poland Biologics Market, By Volume, In Thousand Units, 2017-2031F
- Figure 104. Poland Biologics Market Share (%), By Product, 2017-2031F
- Figure 105. Poland Biologics Market Share (%), By Application, 2017-2031F
- Figure 106. Poland Biologics Market Share (%), By Drug Classification, 2017-2031F
- Figure 107. Poland Biologics Market Share (%), By Mode of Purchase, 2017-2031F
- Figure 108. Poland Biologics Market Share (%), By Distribution Channel, 2017-2031F
- Figure 109. South America Biologics Market, By Value, In USD Billion, 2017-2031F
- Figure 110. South America Biologics Market, By Volume, In Thousand Units, 2017-2031F
- Figure 111. South America Biologics Market Share (%), By Product, 2017-2031F
- Figure 112. South America Biologics Market Share (%), By Application, 2017-2031F
- Figure 113. South America Biologics Market Share (%), By Drug Classification, 2017-2031F
- Figure 114. South America Biologics Market Share (%), By Mode of Purchase, 2017-2031F
- Figure 115. South America Biologics Market Share (%), By Distribution Channel, 2017-2031F
- Figure 116. South America Biologics Market Share (%), By Country, 2017-2031F
- Figure 117. Brazil Biologics Market, By Value, In USD Billion, 2017-2031F
- Figure 118. Brazil Biologics Market, By Volume, In Thousand Units, 2017-2031F
- Figure 119. Brazil Biologics Market Share (%), By Product, 2017-2031F
- Figure 120. Brazil Biologics Market Share (%), By Application, 2017-2031F
- Figure 121. Brazil Biologics Market Share (%), By Drug Classification, 2017-2031F
- Figure 122. Brazil Biologics Market Share (%), By Mode of Purchase, 2017-2031F
- Figure 123. Brazil Biologics Market Share (%), By Distribution Channel, 2017-2031F
- Figure 124. Argentina Biologics Market, By Value, In USD Billion, 2017-2031F
- Figure 125. Argentina Biologics Market, By Volume, In Thousand Units, 2017-2031F
- Figure 126. Argentina Biologics Market Share (%), By Product, 2017-2031F
- Figure 127. Argentina Biologics Market Share (%), By Application, 2017-2031F
- Figure 128. Argentina Biologics Market Share (%), By Drug Classification, 2017-2031F
- Figure 129. Argentina Biologics Market Share (%), By Mode of Purchase, 2017-2031F
- Figure 130. Argentina Biologics Market Share (%), By Distribution Channel, 2017-2031F
- Figure 131. Asia-Pacific Biologics Market, By Value, In USD Billion, 2017-2031F
- Figure 132. Asia-Pacific Biologics Market, By Volume, In Thousand Units, 2017-2031F
- Figure 133. Asia-Pacific Biologics Market Share (%), By Product, 2017-2031F
- Figure 134. Asia-Pacific Biologics Market Share (%), By Application, 2017-2031F
- Figure 135. Asia-Pacific Biologics Market Share (%), By Drug Classification, 2017-2031F
- Figure 136. Asia-Pacific Biologics Market Share (%), By Mode of Purchase, 2017-2031F
- Figure 137. Asia- Pacific Biologics Market Share (%), By Distribution Channel, 2017-2031F
- Figure 138. Asia-Pacific Biologics Market Share (%), By Country, 2017-2031F
- Figure 139. India Biologics Market, By Value, In USD Billion, 2017-2031F
- Figure 140. India Biologics Market, By Volume, In Thousand Units, 2017-2031F
- Figure 141. India Biologics Market Share (%), By Product, 2017-2031F
- Figure 142. India Biologics Market Share (%), By Application, 2017-2031F
- Figure 143. India Biologics Market Share (%), By Drug Classification, 2017-2031F
- Figure 144. India Biologics Market Share (%), By Mode of Purchase, 2017-2031F
- Figure 145. India Biologics Market Share (%), By Distribution Channel, 2017-2031F
- Figure 146. China Biologics Market, By Value, In USD Billion, 2017-2031F
- Figure 147. China Biologics Market, By Volume, In Thousand Units, 2017-2031F
- Figure 148. China Biologics Market Share (%), By Product, 2017-2031F
- Figure 149. China Biologics Market Share (%), By Application, 2017-2031F
- Figure 150. China Biologics Market Share (%), By Drug Classification, 2017-2031F
- Figure 151. China Biologics Market Share (%), By Mode of Purchase, 2017-2031F
- Figure 152. China Biologics Market Share (%), By Distribution Channel, 2017-2031F
- Figure 153. Japan Biologics Market, By Value, In USD Billion, 2017-2031F
- Figure 154. Japan Biologics Market, By Volume, In Thousand Units, 2017-2031F
- Figure 155. Japan Biologics Market Share (%), By Product, 2017-2031F
- Figure 156. Japan Biologics Market Share (%), By Application, 2017-2031F
- Figure 157. Japan Biologics Market Share (%), By Drug Classification, 2017-2031F
- Figure 158. Japan Biologics Market Share (%), By Mode of Purchase, 2017-2031F
- Figure 159. Japan Biologics Market Share (%), By Distribution Channel, 2017-2031F
- Figure 160. Australia Biologics Market, By Value, In USD Billion, 2017-2031F
- Figure 161. Australia Biologics Market, By Volume, In Thousand Units, 2017-2031F
- Figure 162. Australia Biologics Market Share (%), By Product, 2017-2031F
- Figure 163. Australia Biologics Market Share (%), By Application, 2017-2031F
- Figure 164. Australia Biologics Market Share (%), By Drug Classification, 2017-2031F
- Figure 165. Australia Biologics Market Share (%), By Mode of Purchase, 2017-2031F
- Figure 166. Australia Biologics Market Share (%), By Distribution Channel, 2017-2031F
- Figure 167. Vietnam Biologics Market, By Value, In USD Billion, 2017-2031F
- Figure 168. Vietnam Biologics Market, By Volume, In Thousand Units, 2017-2031F
- Figure 169. Vietnam Biologics Market Share (%), By Product, 2017-2031F
- Figure 170. Vietnam Biologics Market Share (%), By Application, 2017-2031F
- Figure 171. Vietnam Biologics Market Share (%), By Drug Classification, 2017-2031F
- Figure 172. Vietnam Biologics Market Share (%), By Mode of Purchase, 2017-2031F
- Figure 173. Vietnam Biologics Market Share (%), By Distribution Channel, 2017-2031F
- Figure 174. South Korea Biologics Market, By Value, In USD Billion, 2017-2031F
- Figure 175. South Korea Biologics Market, By Volume, In Thousand Units, 2017-2031F
- Figure 176. South Korea Biologics Market Share (%), By Product, 2017-2031F
- Figure 177. South Korea Biologics Market Share (%), By Application, 2017-2031F
- Figure 178. South Korea Biologics Market Share (%), By Drug Classification, 2017-2031F
- Figure 179. South Korea Biologics Market Share (%), By Mode of Purchase, 2017-2031F
- Figure 180. South Korea Biologics Market Share (%), By Distribution Channel, 2017-2031F
- Figure 181. Indonesia Biologics Market, By Value, In USD Billion, 2017-2031F
- Figure 182. Indonesia Biologics Market, By Volume, In Thousand Units, 2017-2031F
- Figure 183. Indonesia Biologics Market Share (%), By Product, 2017-2031F
- Figure 184. Indonesia Biologics Market Share (%), By Application, 2017-2031F
- Figure 185. Indonesia Biologics Market Share (%), By Drug Classification, 2017-2031F
- Figure 186. Indonesia Biologics Market Share (%), By Mode of Purchase, 2017-2031F
- Figure 187. Indonesia Biologics Market Share (%), By Distribution Channel, 2017-2031F
- Figure 188. Philippines Biologics Market, By Value, In USD Billion, 2017-2031F
- Figure 189. Philippines Biologics Market, By Volume, In Thousand Units, 2017-2031F
- Figure 190. Philippines Biologics Market Share (%), By Product, 2017-2031F
- Figure 191. Philippines Biologics Market Share (%), By Application, 2017-2031F
- Figure 192. Philippines Biologics Market Share (%), By Drug Classification, 2017-2031F
- Figure 193. Philippines Biologics Market Share (%), By Mode of Purchase, 2017-2031F
- Figure 194. Philippines Biologics Market Share (%), By Distribution Channel, 2017-2031F
- Figure 195. Middle East & Africa Biologics Market, By Value, In USD Billion, 2017-2031F
- Figure 196. Middle East & Africa Biologics Market, By Volume, In Thousand Units, 2017-2031F
- Figure 197. Middle East & Africa Biologics Market Share (%), By Product, 2017-2031F
- Figure 198. Middle East & Africa Biologics Market Share (%), By Application, 2017-2031F
- Figure 199. Middle East & Africa Biologics Market Share (%), By Drug Classification, 2017-2031F
- Figure 200. Middle East & Africa Biologics Market Share (%), By Mode of Purchase, 2017-2031F
- Figure 201. Middle East & Africa Biologics Market Share (%), By Distribution Channel, 2017-2031F
- Figure 202. Middle East & Africa Biologics Market Share (%), By Country, 2017-2031F
- Figure 203. Saudi Arabia Biologics Market, By Value, In USD Billion, 2017-2031F
- Figure 204. Saudi Arabia Biologics Market, By Volume, In Thousand Units, 2017-2031F
- Figure 205. Saudi Arabia Biologics Market Share (%), By Product, 2017-2031F
- Figure 206. Saudi Arabia Biologics Market Share (%), By Application, 2017-2031F
- Figure 207. Saudi Arabia Biologics Market Share (%), By Drug Classification, 2017-2031F
- Figure 208. Saudi Arabia Biologics Market Share (%), By Mode of Purchase, 2017-2031F
- Figure 209. Saudi Arabia Biologics Market Share (%), By Distribution Channel, 2017-2031F
- Figure 210. UAE Biologics Market, By Value, In USD Billion, 2017-2031F
- Figure 211. UAE Biologics Market, By Volume, In Thousand Units, 2017-2031F
- Figure 212. UAE Biologics Market Share (%), By Product, 2017-2031F
- Figure 213. UAE Biologics Market Share (%), By Application, 2017-2031F
- Figure 214. UAE Biologics Market Share (%), By Drug Classification, 2017-2031F
- Figure 215. UAE Biologics Market Share (%), By Mode of Purchase, 2017-2031F
- Figure 216. UAE Biologics Market Share (%), By Distribution Channel, 2017-2031F
- Figure 217. South Africa Biologics Market, By Value, In USD Billion, 2017-2031F
- Figure 218. South Africa Biologics Market, By Volume, In Thousand Units, 2017-2031F
- Figure 219. South Africa Biologics Market Share (%), By Product, 2017-2031F
- Figure 220. South Africa Biologics Market Share (%), By Application, 2017-2031F
- Figure 221. South Africa Biologics Market Share (%), By Drug Classification, 2017-2031F
- Figure 222. South Africa Biologics Market Share (%), By Mode of Purchase, 2017-2031F
- Figure 223. South Africa Biologics Market Share (%), By Distribution Channel, 2017-2031F
- Figure 224. By Product Map-Market Size (USD Billion) & Growth Rate (%), 2023
- Figure 225. By Application Map-Market Size (USD Billion) & Growth Rate (%), 2023
- Figure 226. By Drug Classification Map-Market Size (USD Billion) & Growth Rate (%), 2023
- Figure 227. By Mode of Purchase Map-Market Size (USD Billion) & Growth Rate (%), 2023
- Figure 228. By Distribution Channel Map-Market Size (USD Billion) & Growth Rate (%), 2023
- Figure 229. By Region Map-Market Size (USD Billion) & Growth Rate (%), 2023
Global biologics market size was valued at USD 401.34 billion in 2023, and is expected to reach USD 695.79 billion in 2031, with a CAGR of 7.12% for the forecast period between 2024 and 2031F. The increasing incidence and diagnosis of chronic diseases have created a significant demand for advanced diagnostics and treatment medications, consequently propelling the global biologics market. These specialized drugs have been genetically altered to target specific components of the immune system that trigger inflammation. With the emergence of coronavirus diseases, governments worldwide are taking measures to fortify the healthcare industry and ensure the availability of biologics.
Simultaneously, scientists and researchers are exploring different species and expression systems to enhance the efficiency of biological products. Moreover, numerous pharmaceutical companies are engaged in research and development efforts aimed at enhancing the effectiveness of oral medications for arthritis. Given the decline in productivity in small molecule medication research and development, a substantial surge in the biologics market is anticipated in the coming years. These pharmaceutical firms are actively pursuing the development of various biologic medications to sustain their market dominance. As oral medications for conditions like Crohn's disease and rheumatoid arthritis become more effective, it is predicted that a larger number of moderately affected patients will transition towards newly branded therapies. Additionally, these new compounds provide therapeutic alternatives for patients who have previously shown resistance to traditional treatments, often displaying superior safety and efficacy.
High Prevalence of Chronic Diseases
The global biologics market is witnessing a significant impact due to the high prevalence of chronic diseases. Chronic conditions like cancer, diabetes, autoimmune disorders, and cardiovascular diseases are increasingly becoming prevalent globally. Biologics, which are medicinal products derived from living organisms, have emerged as a critical treatment option for many of these conditions. These complex molecules offer targeted therapies, often with fewer side effects and greater efficacy than traditional pharmaceuticals.
For instance, as per the World Health Organization's report in September 2023, approximately 41 million individuals succumb annually to non-communicable diseases (NCD), representing 74% of the total global deaths. Each year, roughly 17 million people perish from NCDs before reaching the age of 70, with 86% of these untimely fatalities occurring on a global scale. Over 41 million individuals globally succumb to chronic diseases annually. Among these, cardiovascular disease leads, causing 17.9 million deaths per year, followed by cancer, diabetes, and respiratory disorders. Together, these four categories account for 80% of all fatalities attributed to chronic diseases. The prevalence of chronic diseases has spurred the advancement of diagnostics and treatments. Biologics, genetically engineered medications, and target specific components of the immune system are responsible for inflammation.
Increasing Emphasis on Research and Development
The expansion of the market is being driven by the increasing emphasis on research and development activities, which is expected to create advantageous prospects for biologics market growth. Moreover, scientists and researchers are exploring various species and expression systems to enhance the productivity of biological products. Several pharmaceutical companies are engaged in research and development activities aimed at improving the effectiveness of oral medications for conditions like rheumatoid arthritis and Crohn's disease. Furthermore, the escalating rate of drug approvals and introductions will continue to accelerate the growth trajectory of the market.
For instance, as an example, in January 2023, Lecanemab received approval from the U.S. FDA via its accelerated approval pathway, specifically intended for addressing Alzheimer's Disease. In June 2022, Alnylam Pharmaceuticals, Inc. obtained FDA approval for its RNAi therapeutic, AMVUTTRA, designed for treating the Polyneuropathy associated with hereditary transthyretin-mediated amyloidosis.
Growing Investments by Key Players
The global biologics market continues to witness a surge in investments by key players, indicative of the sector's growth and potential. Major pharmaceutical companies, biotech firms, and research institutions are channeling substantial investments into research, development, and manufacturing of biologics. The financial commitment aims to bolster innovation, expand product portfolios, and enhance manufacturing technologies, ultimately meeting the rising demand for advanced and personalized healthcare solutions.
The competitive landscape is evolving rapidly as companies are planning to introduce novel biologics, focusing on diverse therapeutic areas like oncology, autoimmune diseases, and infectious diseases. The growing investment trend signifies the industry's confidence in the market's promising future, fostering groundbreaking advancements and improved treatment options for global healthcare challenges. For Instance, in March 2023, Novartis announced the intention of its division, Sandoz to allocate roughly USD 400 million towards establishing a biologics manufacturing plant situated in Slovenia. During March 2023, Eli Lilly disclosed its proposal to invest USD 500 million into expanding its current 500,000 sq. ft. biologics manufacturing site in Limerick.
Technological Advancements
The global biologics market has witnessed remarkable technological advancements, revolutionizing the landscape of medicine and healthcare. Innovations in biotechnology, particularly in areas like genetic engineering, monoclonal antibodies, and recombinant DNA technology, have significantly enhanced the development and production of biologics industry.
Advanced techniques in cell culture systems, gene editing (like CRISPR), and bioprocessing have streamlined the manufacturing of complex biological molecules. Furthermore, the emergence of personalized medicine has driven a shift towards more tailored and effective treatments, utilizing biologics designed to target specific patient populations. The progress has led to the development of novel biologics, including therapeutic proteins, vaccines, and monoclonal antibodies, fostering breakthroughs in treating various diseases like cancer, autoimmune disorders, and infectious diseases.
For Instance, in February 2022 CARVYKTI, developed by the Janssen Pharmaceutical Companies of Johnson & Johnson obtained approval from the US Food and Drug Administration (FDA) for sale. The biologic medication is designated for individuals with relapsed or refractory multiple myeloma (RRMM) who have undergone four prior lines of therapy, which may include proteasome inhibitor, immunomodulatory agent, and anti-CD38 monoclonal antibody treatments.
Impact of COVID-19
The COVID-19 pandemic had a significant impact on the global biologics market. Biologics are complex, large-molecule drugs used to treat a variety of diseases, including autoimmune disorders, cancer, and infectious diseases. The pandemic disrupted supply chains and manufacturing processes, leading to production delays and shortages of some biologics. Additionally, the increased focus on vaccine development and monoclonal antibody therapies to combat the virus diverted resources and attention from other biologic drug development efforts.
On the contrary, the pandemic has highlighted the importance of biotechnology and accelerated innovation in the field. The rapid development of mRNA vaccines, such as the Pfizer-BioNTech and Moderna vaccines, showcased the potential of biologics in responding to infectious diseases. Furthermore, the pandemic has driven investment in research and development of biologics, leading to advancements in bioprocessing and manufacturing technologies. During April 2022, GSK, a British multinational pharmaceutical and biotechnology company, together with SK bioscience, presented a biologics license application for SKYCovione, a COVID-19 vaccine candidate based on recombinant proteins, to the Korean Ministry of Food and Drug Safety (KMFDS).
Key Players Landscape and Outlook
Prominent industry stakeholders are allocating significant funds to research and development endeavors, aiming to diversify their product portfolios, thereby stimulating the expansion of the global biologics market. The market participants are implementing various strategic measures to enhance their global presence, including pivotal actions such as launching new products, engaging in mergers and acquisitions, forming contractual agreements, amplifying investments, and fostering collaborations with other organizations. In the competitive landscape of the biologics sector, companies must provide cost-effective offerings to broaden their scope and endure in an intensifying, competitive, and burgeoning market environment.
For Instance, the FDA granted approval to Leqembi (lecanemab-irmb) through the Accelerated Approval pathway in January 2023 for addressing Alzheimer's disease. The medication diminishes amyloid-B plaques and moderately retards mild cognitive decline in individuals with early-stage Alzheimer's disease.
Table of Contents
1. Research Methodology
2. Project Scope & Definitions
3. Impact of COVID-19 on Global Biologics Market
4. Executive Summary
5. Global Biologics Market Outlook, 2017-2031F
- 5.1. Market Size & Forecast
- 5.1.1. By Value
- 5.1.2. By Volume
- 5.2. By Product
- 5.2.1. Monoclonal Antibodies
- 5.2.2. Recombinant Hormones/Proteins
- 5.2.3. Vaccines
- 5.2.4. Cellular Based Biologics
- 5.2.5. Gene-Based Biologics
- 5.2.6. Therapeutic Enzymes
- 5.2.7. Others
- 5.3. By Application
- 5.3.1. Infectious Diseases
- 5.3.2. Cancer
- 5.3.3. Autoimmune Diseases
- 5.3.4. Cardiovascular
- 5.3.5. Hematological Disorders
- 5.3.6. Others
- 5.4. By Drug Classification
- 5.4.1. Branded Drugs
- 5.4.2. Generic Drugs
- 5.5. By Mode of Purchase
- 5.5.1. Prescription Drugs
- 5.5.2. Over-the-counter Drugs
- 5.6. By Distribution Channel
- 5.6.1. Hospital Pharmacies
- 5.6.2. Retail Pharmacies
- 5.6.3. Online Pharmacies
- 5.6.4. Others
- 5.7. By Region
- 5.7.1. North America
- 5.7.2. Europe
- 5.7.3. Asia Pacific
- 5.7.4. South America
- 5.7.5. Middle East & Africa
- 5.8. By Company Market Share (%), 2023
6. Global Biologics Market Outlook, By Region, 2017-2031F
- 6.1. North America*
- 6.1.1. Market Size & Forecast
- 6.1.1.1. By Value
- 6.1.1.2. By Volume
- 6.1.2. By Product
- 6.1.2.1. Monoclonal Antibodies
- 6.1.2.2. Recombinant Hormones/Proteins
- 6.1.2.3. Vaccines
- 6.1.2.4. Cellular Based Biologics
- 6.1.2.5. Gene-Based Biologics
- 6.1.2.6. Therapeutic Enzymes
- 6.1.2.7. Others
- 6.1.3. By Application
- 6.1.3.1. Infectious Diseases
- 6.1.3.2. Cancer
- 6.1.3.3. Autoimmune Diseases
- 6.1.3.4. Cardiovascular
- 6.1.3.5. Hematological Disorders
- 6.1.3.6. Others
- 6.1.4. By Drug Classification
- 6.1.4.1. Branded Drugs
- 6.1.4.2. Generic Drugs
- 6.1.5. By Mode of Purchase
- 6.1.5.1. Prescription Drugs
- 6.1.5.2. Over-the-counter Drugs
- 6.1.6. By Distribution Channel
- 6.1.6.1. Hospital Pharmacies
- 6.1.6.2. Retail Pharmacies
- 6.1.6.3. Online Pharmacies
- 6.1.6.4. Others
- 6.1.7. United States*
- 6.1.7.1. By Product
- 6.1.7.1.1. Monoclonal Antibodies
- 6.1.7.1.2. Recombinant Hormones/Proteins
- 6.1.7.1.3. Vaccines
- 6.1.7.1.4. Cellular Based Biologics
- 6.1.7.1.5. Gene-Based Biologics
- 6.1.7.1.6. Therapeutic Enzymes
- 6.1.7.1.7. Others
- 6.1.7.2. By Application
- 6.1.7.2.1. Infectious Diseases
- 6.1.7.2.2. Cancer
- 6.1.7.2.3. Autoimmune Diseases
- 6.1.7.2.4. Cardiovascular
- 6.1.7.2.5. Hematological Disorders
- 6.1.7.2.6. Others
- 6.1.7.3. By Drug Classification
- 6.1.7.3.1. Branded Drugs
- 6.1.7.3.2. Generic Drugs
- 6.1.7.4. By Mode of Purchase
- 6.1.7.4.1. Prescription Drugs
- 6.1.7.4.2. Over-the-counter Drugs
- 6.1.7.5. By Distribution Channel
- 6.1.7.5.1. Hospital Pharmacies
- 6.1.7.5.2. Retail Pharmacies
- 6.1.7.5.3. Online Pharmacies
- 6.1.7.5.4. Others
- 6.1.7.6. By Region
- 6.1.7.6.1. North America
- 6.1.7.6.2. Europe
- 6.1.7.6.3. Asia Pacific
- 6.1.7.6.4. South America
- 6.1.7.6.5. Middle East & Africa
- 6.1.7.7. Canada
- 6.1.7.8. Mexico
- 6.1.1. Market Size & Forecast
All segments will be provided for all regions and countries covered:
- 6.2. Europe
- 6.2.1. Germany
- 6.2.2. France
- 6.2.3. Italy
- 6.2.4. United Kingdom
- 6.2.5. Russia
- 6.2.6. Netherlands
- 6.2.7. Spain
- 6.2.8. Turkey
- 6.2.9. Poland
- 6.3. South America
- 6.3.1. Brazil
- 6.3.2. Mexico
- 6.3.3. Argentina
- 6.4. Asia-Pacific
- 6.4.1. India
- 6.4.2. China
- 6.4.3. Japan
- 6.4.4. Australia
- 6.4.5. Vietnam
- 6.4.6. South Korea
- 6.4.7. Indonesia
- 6.4.8. Philippines
- 6.5. Middle East & Africa
- 6.5.1. Saudi Arabia
- 6.5.2. UAE
- 6.5.3. South Africa
7. Market Mapping, 2023
- 7.1. By Product
- 7.2. By Application
- 7.3. By Drug Classification
- 7.4. By Mode of Purchase
- 7.5. By Distribution Channel
- 7.6. By Region
8. Macro Environment and Industry Structure
- 8.1. Supply Demand Analysis
- 8.2. Import Export Analysis - Volume and Value
- 8.3. Supply/Value Chain Analysis
- 8.4. PESTEL Analysis
- 8.4.1. Political Factors
- 8.4.2. Economic System
- 8.4.3. Social Implications
- 8.4.4. Technological Advancements
- 8.4.5. Environmental Impacts
- 8.4.6. Legal Compliances and Regulatory Policies (Statutory Bodies Included)
- 8.5. Porter's Five Forces Analysis
- 8.5.1. Supplier Power
- 8.5.2. Buyer Power
- 8.5.3. Substitution Threat
- 8.5.4. Threat from New Entrant
- 8.5.5. Competitive Rivalry
9. Market Dynamics
- 9.1. Growth Drivers
- 9.2. Growth Inhibitors (Challenges, Restraints)
10. Regulatory Framework and Innovation
- 10.1. Clinical Trials
- 10.2. Patent Landscape
- 10.3. Regulatory Approvals
- 10.4. Innovations/Emerging Technologies
11. Key Players Landscape
- 11.1. Competition Matrix of Top Five Market Leaders
- 11.2. Market Revenue Analysis of Top Five Market Leaders (in %, 2023)
- 11.3. Mergers and Acquisitions/Joint Ventures (If Applicable)
- 11.4. SWOT Analysis (For Five Market Players)
- 11.5. Patent Analysis (If Applicable)
12. Pricing Analysis
13. Case Studies
14. Key Players Outlook
- 14.1. F. Hoffmann La-Roche Ltd.
- 14.1.1. Company Details
- 14.1.2. Key Management Personnel
- 14.1.3. Products & Services
- 14.1.4. Financials (As reported)
- 14.1.5. Key Market Focus & Geographical Presence
- 14.1.6. Recent Developments
- 14.2. Samsung Biologics
- 14.3. Amgen Inc.
- 14.4. Novo Nordisk A/S
- 14.5. AbbVie Inc.
- 14.6. Sanofi
- 14.7. Johnson & Johnson Services, Inc.
- 14.8. Celltrion Healthcare Co., Ltd.
- 14.9. Bristol-Myers Squibb Company
- 14.10. Eli Lilly and Company
Companies mentioned above DO NOT hold any order as per market share and can be changed as per information available during research work.
