|
|
市場調査レポート
商品コード
1378167
電池エネルギー貯蔵システム (BESS) の世界市場:電池タイプ別、接続タイプ別、用途別、容量別、地域別の機会および予測、2022-2030年Battery Energy Storage System Market Assessment, By Battery Type, By Connection Type, By Application, By Capacity, By Region, Opportunities and Forecast, 2022-2030F |
||||||
|
|
|||||||
カスタマイズ可能
|
|||||||


| 電池エネルギー貯蔵システム (BESS) の世界市場:電池タイプ別、接続タイプ別、用途別、容量別、地域別の機会および予測、2022-2030年 |
|
出版日: 2023年11月07日
発行: Market Xcel - Markets and Data
ページ情報: 英文 157 Pages
納期: 3~5営業日
|

- 全表示
- 概要
- 図表
- 目次
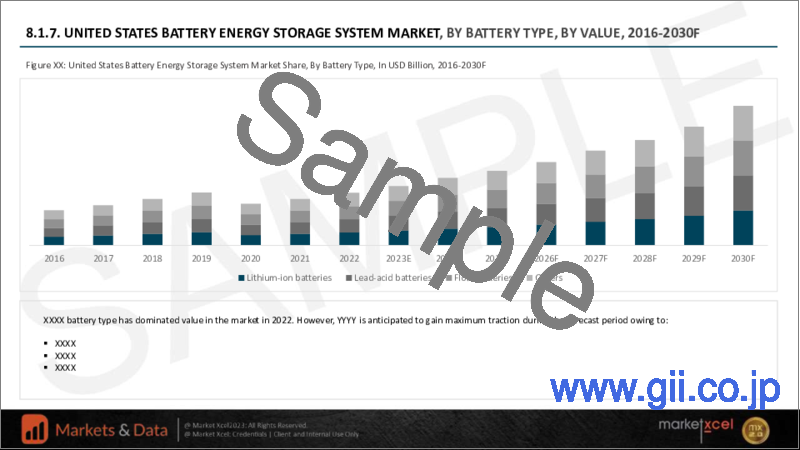
世界の電池エネルギー貯蔵システム (BESS) の市場規模は、2022年の216億4,000万米ドルから、予測期間中は12.12%のCAGRで推移し、2030年には540億4,000万米ドルの規模に成長すると予測されています。
世界のエネルギー需要の高まりにより、継続的で信頼性の高い電力供給が必要とされています。このニーズの高まりにより、将来の利用のために電気エネルギーを電池に貯蔵するBESSの採用が増加しています。
世界各国は二酸化炭素排出量を削減し、送電網の安定性を高めるため、太陽光や風力などの再生可能エネルギーへの依存度を高めています。これらのエネルギー源から得られる断続的な電力は、特にアジア太平洋や中東・アフリカなど、エネルギー生産が安定しない地域では特別な課題です。データセンター、ヘルスケア施設、重要インフラなどの主要産業は、運用を維持するために中断のない電力を必要としており、BESSは送電網の安定性と信頼できる電力供給を確保するために不可欠なものとなっています。
分散型マイクログリッドの成長がBESS市場を後押ししています。分散型マイクログリッドは、ピーク負荷需要の抑制に役立っており、送電網の負担を軽減し、電力供給の全体的な質を高めています。同時に、エネルギーの回復力を強化し、集中型送電網への依存を減らし、停電の影響を抑制します。分散型マイクログリッドとBESSの調和のとれた相乗効果がエネルギー貯蔵分野の成長を大きく促進しています。
当レポートでは、世界の電池エネルギー貯蔵システム (BESS) の市場を調査し、市場の定義と概要、市場規模の推移・予測、各種区分・地域別の詳細分析、産業構造、市場成長への影響因子の分析、ケーススタディ、競合情勢、主要企業のプロファイルなどをまとめています。
目次
第1章 調査手法
第2章 プロジェクトの範囲と定義
第3章 世界の電池エネルギー貯蔵システム (BESS) 市場に対するCOVID-19の影響
第4章 ロシア・ウクライナ戦争の影響
第5章 エグゼクティブサマリー
第6章 顧客の声
- 市場の認知度・製品情報
- 購入決定において考慮される要因
第7章 世界の電池エネルギー貯蔵システム (BESS) 市場の展望
- 市場規模・予測
- 電池タイプ別
- リチウムイオン電池
- 鉛蓄電池
- フローバッテリー
- その他
- 接続タイプ別
- オングリッド
- オフグリッド
- 用途別
- ユーティリティ
- 商用
- 産業用
- 家庭用
- 容量別
- 100MWh未満
- 100~500MWh
- 500MWh以上
- 地域別
- 北米
- 欧州
- 南米
- アジア太平洋
- 中東・アフリカ
- 企業シェア
第8章 世界の電池エネルギー貯蔵システム (BESS) 市場の展望:地域別
- 北米
- 欧州
- 南米
- アジア太平洋
- 中東・アフリカ
- 市場規模・予測
- 電池タイプ別
- 接続タイプ別
- 用途別
- 容量別
- 国別
第9章 市場マッピング
第10章 マクロ環境と産業構造
- 需給分析
- 輸出入分析
- サプライ/バリューチェーン分析
- PESTEL分析
- ポーターのファイブフォース分析
第11章 市場力学
- 成長促進因子
- 成長抑制因子 (課題・制約)
第12章 主要企業の情勢
- 市場リーダー上位5社の競合マトリックス
- 市場リーダー上位5社の市場収益分析
- M&A・ジョイントベンチャー (該当する場合)
- SWOT分析 (参入5社)
- 特許分析 (該当する場合)
第13章 価格分析
第14章 ケーススタディ
第15章 主要企業の見通し
- BYD Company Co., Ltd.
- Contemporary Amperex Technology Co., Limited
- LG Chem Ltd.
- Samsung SDI Co., Ltd.
- Panasonic Corporation
- ABB Ltd
- Siemens AG
- Hitachi, Ltd.
- Saft Groupe S.A.
- Honeywell International Inc.
第16章 戦略的提言
第17章 当社について・免責事項
List of Tables
- Table 1. Pricing Analysis of Products from Key Players
- Table 2. Competition Matrix of Top 5 Market Leaders
- Table 3. Mergers & Acquisitions/ Joint Ventures (If Applicable)
- Table 4. About Us - Regions and Countries Where We Have Executed Client Projects
List of Figures
- Figure 1. Global Arms and Ammunition Market, By Value, In USD Billion, 2022-2030F
- Figure 2. Global Arms and Ammunition Market, By Volume, In Units, 2022-2030F
- Figure 3. Global Arms and Ammunition Market Share, By Weapon Type, In USD Billion, 2022-2030F
- Figure 4. Global Arms and Ammunition Market Share, By Caliber, In USD Billion, 2022-2030F
- Figure 5. Global Arms and Ammunition Market Share, By Projectile Type, In USD Billion, 2022-2030F
- Figure 6. Global Arms and Ammunition Market Share, By Lethality, In USD Billion, 2022-2030F
- Figure 7. Global Arms and Ammunition Market Share, By Action, In USD Billion, 2022-2030F
- Figure 8. Global Arms and Ammunition Market Share, By Application, In USD Billion, 2022-2030F
- Figure 9. Global Arms and Ammunition Market Share, By Region, In USD Billion, 2022-2030F
- Figure 10. North America Arms and Ammunition Market, By Value, In USD Billion, 2022-2030F
- Figure 11. North America Arms and Ammunition Market, By Volume, In Units, 2022-2030F
- Figure 12. North America Arms and Ammunition Market Share, By Weapon Type, In USD Billion, 2022-2030F
- Figure 13. North America Arms and Ammunition Market Share, By Caliber, In USD Billion, 2022-2030F
- Figure 14. North America Arms and Ammunition Market Share, By Projectile Type, In USD Billion, 2022-2030F
- Figure 15. North America Arms and Ammunition Market Share, By Lethality, In USD Billion, 2022-2030F
- Figure 16. North America Arms and Ammunition Market Share, By Action, In USD Billion, 2022-2030F
- Figure 17. North America Arms and Ammunition Market Share, By Application, In USD Billion, 2022-2030F
- Figure 18. North America Arms and Ammunition Market Share, By Country, In USD Billion, 2022-2030F
- Figure 19. United States Arms and Ammunition Market, By Value, In USD Billion, 2022-2030F
- Figure 20. United States Arms and Ammunition Market, By Volume, In Units, 2022-2030F
- Figure 21. United States Arms and Ammunition Market Share, By Weapon Type, In USD Billion, 2022-2030F
- Figure 22. United States Arms and Ammunition Market Share, By Caliber, In USD Billion, 2022-2030F
- Figure 23. United States Arms and Ammunition Market Share, By Projectile Type, In USD Billion, 2022-2030F
- Figure 24. United States Arms and Ammunition Market Share, By Lethality, In USD Billion, 2022-2030F
- Figure 25. United States Arms and Ammunition Market Share, By Action, In USD Billion, 2022-2030F
- Figure 26. United States Arms and Ammunition Market Share, By Application, In USD Billion, 2022-2030F
- Figure 27. Canada Arms and Ammunition Market, By Value, In USD Billion, 2022-2030F
- Figure 28. Canada Arms and Ammunition Market, By Volume, In Units, 2022-2030F
- Figure 29. Canada Arms and Ammunition Market Share, By Weapon Type, In USD Billion, 2022-2030F
- Figure 30. Canada Arms and Ammunition Market Share, By Caliber, In USD Billion, 2022-2030F
- Figure 31. Canada Arms and Ammunition Market Share, By Projectile Type, In USD Billion, 2022-2030F
- Figure 32. Canada Arms and Ammunition Market Share, By Lethality, In USD Billion, 2022-2030F
- Figure 33. Canada Arms and Ammunition Market Share, By Action, In USD Billion, 2022-2030F
- Figure 34. Canada Arms and Ammunition Market Share, By Application, In USD Billion, 2022-2030F
- Figure 35. Mexico Arms and Ammunition Market, By Value, In USD Billion, 2022-2030F
- Figure 36. Mexico Arms and Ammunition Market, By Volume, In Units, 2022-2030F
- Figure 37. Mexico Arms and Ammunition Market Share, By Weapon Type, In USD Billion, 2022-2030F
- Figure 38. Mexico Arms and Ammunition Market Share, By Caliber, In USD Billion, 2022-2030F
- Figure 39. Mexico Arms and Ammunition Market Share, By Projectile Type, In USD Billion, 2022-2030F
- Figure 40. Mexico Arms and Ammunition Market Share, By Lethality, In USD Billion, 2022-2030F
- Figure 41. Mexico Arms and Ammunition Market Share, By Action, In USD Billion, 2022-2030F
- Figure 42. Mexico Arms and Ammunition Market Share, By Application, In USD Billion, 2022-2030F
- Figure 43. Europe Arms and Ammunition Market, By Value, In USD Billion, 2022-2030F
- Figure 44. Europe Arms and Ammunition Market, By Volume, In Units, 2022-2030F
- Figure 45. Europe Arms and Ammunition Market Share, By Weapon Type, In USD Billion, 2022-2030F
- Figure 46. Europe Arms and Ammunition Market Share, By Caliber, In USD Billion, 2022-2030F
- Figure 47. Europe Arms and Ammunition Market Share, By Projectile Type, In USD Billion, 2022-2030F
- Figure 48. Europe Arms and Ammunition Market Share, By Lethality, In USD Billion, 2022-2030F
- Figure 49. Europe Arms and Ammunition Market Share, By Action, In USD Billion, 2022-2030F
- Figure 50. Europe Arms and Ammunition Market Share, By Application, In USD Billion, 2022-2030F
- Figure 51. Europe Arms and Ammunition Market Share, By Country, In USD Billion, 2022-2030F
- Figure 52. Germany Arms and Ammunition Market, By Value, In USD Billion, 2022-2030F
- Figure 53. Germany Arms and Ammunition Market, By Volume, In Units, 2022-2030F
- Figure 54. Germany Arms and Ammunition Market Share, By Weapon Type, In USD Billion, 2022-2030F
- Figure 55. Germany Arms and Ammunition Market Share, By Caliber, In USD Billion, 2022-2030F
- Figure 56. Germany Arms and Ammunition Market Share, By Projectile Type, In USD Billion, 2022-2030F
- Figure 57. Germany Arms and Ammunition Market Share, By Lethality, In USD Billion, 2022-2030F
- Figure 58. Germany Arms and Ammunition Market Share, By Action, In USD Billion, 2022-2030F
- Figure 59. Germany Arms and Ammunition Market Share, By Application, In USD Billion, 2022-2030F
- Figure 60. France Arms and Ammunition Market, By Value, In USD Billion, 2022-2030F
- Figure 61. France Arms and Ammunition Market, By Volume, In Units, 2022-2030F
- Figure 62. France Arms and Ammunition Market Share, By Weapon Type, In USD Billion, 2022-2030F
- Figure 63. France Arms and Ammunition Market Share, By Caliber, In USD Billion, 2022-2030F
- Figure 64. France Arms and Ammunition Market Share, By Projectile Type, In USD Billion, 2022-2030F
- Figure 65. France Arms and Ammunition Market Share, By Lethality, In USD Billion, 2022-2030F
- Figure 66. France Arms and Ammunition Market Share, By Action, In USD Billion, 2022-2030F
- Figure 67. France Arms and Ammunition Market Share, By Application, In USD Billion, 2022-2030F
- Figure 68. Italy Arms and Ammunition Market, By Value, In USD Billion, 2022-2030F
- Figure 69. Italy Arms and Ammunition Market, By Volume, In Units, 2022-2030F
- Figure 70. Italy Arms and Ammunition Market Share, By Weapon Type, In USD Billion, 2022-2030F
- Figure 71. Italy Arms and Ammunition Market Share, By Caliber, In USD Billion, 2022-2030F
- Figure 72. Italy Arms and Ammunition Market Share, By Projectile Type, In USD Billion, 2022-2030F
- Figure 73. Italy Arms and Ammunition Market Share, By Lethality, In USD Billion, 2022-2030F
- Figure 74. Italy Arms and Ammunition Market Share, By Action, In USD Billion, 2022-2030F
- Figure 75. Italy Arms and Ammunition Market Share, By Application, In USD Billion, 2022-2030F
- Figure 76. United Kingdom Arms and Ammunition Market, By Value, In USD Billion, 2022-2030F
- Figure 77. United Kingdom Arms and Ammunition Market, By Volume, In Units, 2022-2030F
- Figure 78. United Kingdom Arms and Ammunition Market Share, By Weapon Type, In USD Billion, 2022-2030F
- Figure 79. United Kingdom Arms and Ammunition Market Share, By Caliber, In USD Billion, 2022-2030F
- Figure 80. United Kingdom Arms and Ammunition Market Share, By Projectile Type, In USD Billion, 2022-2030F
- Figure 81. United Kingdom Arms and Ammunition Market Share, By Lethality, In USD Billion, 2022-2030F
- Figure 82. United Kingdom Arms and Ammunition Market Share, By Action, In USD Billion, 2022-2030F
- Figure 83. United Kingdom Arms and Ammunition Market Share, By Application, In USD Billion, 2022-2030F
- Figure 84. Russia Arms and Ammunition Market, By Value, In USD Billion, 2022-2030F
- Figure 85. Russia Arms and Ammunition Market, By Volume, In Units, 2022-2030F
- Figure 86. Russia Arms and Ammunition Market Share, By Weapon Type, In USD Billion, 2022-2030F
- Figure 87. Russia Arms and Ammunition Market Share, By Caliber, In USD Billion, 2022-2030F
- Figure 88. Russia Arms and Ammunition Market Share, By Projectile Type, In USD Billion, 2022-2030F
- Figure 89. Russia Arms and Ammunition Market Share, By Lethality, In USD Billion, 2022-2030F
- Figure 90. Russia Arms and Ammunition Market Share, By Action, In USD Billion, 2022-2030F
- Figure 91. Russia Arms and Ammunition Market Share, By Application, In USD Billion, 2022-2030F
- Figure 92. Netherlands Arms and Ammunition Market, By Value, In USD Billion, 2022-2030F
- Figure 93. Netherlands Arms and Ammunition Market, By Volume, In Units, 2022-2030F
- Figure 94. Netherlands Arms and Ammunition Market Share, By Weapon Type, In USD Billion, 2022-2030F
- Figure 95. Netherlands Arms and Ammunition Market Share, By Caliber, In USD Billion, 2022-2030F
- Figure 96. Netherlands Arms and Ammunition Market Share, By Projectile Type, In USD Billion, 2022-2030F
- Figure 97. Netherlands Arms and Ammunition Market Share, By Lethality, In USD Billion, 2022-2030F
- Figure 98. Netherlands Arms and Ammunition Market Share, By Action, In USD Billion, 2022-2030F
- Figure 99. Netherlands Arms and Ammunition Market Share, By Application, In USD Billion, 2022-2030F
- Figure 100. Spain Arms and Ammunition Market, By Value, In USD Billion, 2022-2030F
- Figure 101. Spain Arms and Ammunition Market, By Volume, In Units, 2022-2030F
- Figure 102. Spain Arms and Ammunition Market Share, By Weapon Type, In USD Billion, 2022-2030F
- Figure 103. Spain Arms and Ammunition Market Share, By Caliber, In USD Billion, 2022-2030F
- Figure 104. Spain Arms and Ammunition Market Share, By Projectile Type, In USD Billion, 2022-2030F
- Figure 105. Spain Arms and Ammunition Market Share, By Lethality, In USD Billion, 2022-2030F
- Figure 106. Spain Arms and Ammunition Market Share, By Action, In USD Billion, 2022-2030F
- Figure 107. Spain Arms and Ammunition Market Share, By Application, In USD Billion, 2022-2030F
- Figure 108. Turkey Arms and Ammunition Market, By Value, In USD Billion, 2022-2030F
- Figure 109. Turkey Arms and Ammunition Market, By Volume, In Units, 2022-2030F
- Figure 110. Turkey Arms and Ammunition Market Share, By Weapon Type, In USD Billion, 2022-2030F
- Figure 111. Turkey Arms and Ammunition Market Share, By Caliber, In USD Billion, 2022-2030F
- Figure 112. Turkey Arms and Ammunition Market Share, By Projectile Type, In USD Billion, 2022-2030F
- Figure 113. Turkey Arms and Ammunition Market Share, By Lethality, In USD Billion, 2022-2030F
- Figure 114. Turkey Arms and Ammunition Market Share, By Action, In USD Billion, 2022-2030F
- Figure 115. Turkey Arms and Ammunition Market Share, By Application, In USD Billion, 2022-2030F
- Figure 116. Poland Arms and Ammunition Market, By Value, In USD Billion, 2022-2030F
- Figure 117. Poland Arms and Ammunition Market, By Volume, In Units, 2022-2030F
- Figure 118. Poland Arms and Ammunition Market Share, By Weapon Type, In USD Billion, 2022-2030F
- Figure 119. Poland Arms and Ammunition Market Share, By Caliber, In USD Billion, 2022-2030F
- Figure 120. Poland Arms and Ammunition Market Share, By Projectile Type, In USD Billion, 2022-2030F
- Figure 121. Poland Arms and Ammunition Market Share, By Lethality, In USD Billion, 2022-2030F
- Figure 122. Poland Arms and Ammunition Market Share, By Action, In USD Billion, 2022-2030F
- Figure 123. Poland Arms and Ammunition Market Share, By Application, In USD Billion, 2022-2030F
- Figure 124. South America Arms and Ammunition Market, By Value, In USD Billion, 2022-2030F
- Figure 125. South America Arms and Ammunition Market, By Volume, In Units, 2022-2030F
- Figure 126. South America Arms and Ammunition Market Share, By Weapon Type, In USD Billion, 2022-2030F
- Figure 127. South America Arms and Ammunition Market Share, By Caliber, In USD Billion, 2022-2030F
- Figure 128. South America Arms and Ammunition Market Share, By Projectile Type, In USD Billion, 2022-2030F
- Figure 129. South America Arms and Ammunition Market Share, By Lethality, In USD Billion, 2022-2030F
- Figure 130. South America Arms and Ammunition Market Share, By Action, In USD Billion, 2022-2030F
- Figure 131. South America Arms and Ammunition Market Share, By Application, In USD Billion, 2022-2030F
- Figure 132. South America Arms and Ammunition Market Share, By Country, In USD Billion, 2022-2030F
- Figure 133. Brazil Arms and Ammunition Market, By Value, In USD Billion, 2022-2030F
- Figure 134. Brazil Arms and Ammunition Market, By Volume, In Units, 2022-2030F
- Figure 135. Brazil Arms and Ammunition Market Share, By Weapon Type, In USD Billion, 2022-2030F
- Figure 136. Brazil Arms and Ammunition Market Share, By Caliber, In USD Billion, 2022-2030F
- Figure 137. Brazil Arms and Ammunition Market Share, By Projectile Type, In USD Billion, 2022-2030F
- Figure 138. Brazil Arms and Ammunition Market Share, By Lethality, In USD Billion, 2022-2030F
- Figure 139. Brazil Arms and Ammunition Market Share, By Action, In USD Billion, 2022-2030F
- Figure 140. Brazil Arms and Ammunition Market Share, By Application, In USD Billion, 2022-2030F
- Figure 141. Argentina Arms and Ammunition Market, By Value, In USD Billion, 2022-2030F
- Figure 142. Argentina Arms and Ammunition Market, By Volume, In Units, 2022-2030F
- Figure 143. Argentina Arms and Ammunition Market Share, By Weapon Type, In USD Billion, 2022-2030F
- Figure 144. Argentina Arms and Ammunition Market Share, By Caliber, In USD Billion, 2022-2030F
- Figure 145. Argentina Arms and Ammunition Market Share, By Projectile Type, In USD Billion, 2022-2030F
- Figure 146. Argentina Arms and Ammunition Market Share, By Lethality, In USD Billion, 2022-2030F
- Figure 147. Argentina Arms and Ammunition Market Share, By Action, In USD Billion, 2022-2030F
- Figure 148. Argentina Arms and Ammunition Market Share, By Application, In USD Billion, 2022-2030F
- Figure 149. Asia-Pacific Arms and Ammunition Market, By Value, In USD Billion, 2022-2030F
- Figure 150. Asia-Pacific Arms and Ammunition Market, By Volume, In Units, 2022-2030F
- Figure 151. Asia-Pacific Arms and Ammunition Market Share, By Weapon Type, In USD Billion, 2022-2030F
- Figure 152. Asia-Pacific Arms and Ammunition Market Share, By Caliber, In USD Billion, 2022-2030F
- Figure 153. Asia-Pacific Arms and Ammunition Market Share, By Projectile Type, In USD Billion, 2022-2030F
- Figure 154. Asia-Pacific Arms and Ammunition Market Share, By Lethality, In USD Billion, 2022-2030F
- Figure 155. Asia-Pacific Arms and Ammunition Market Share, By Action, In USD Billion, 2022-2030F
- Figure 156. Asia-Pacific Arms and Ammunition Market Share, By Application, In USD Billion, 2022-2030F
- Figure 157. Asia-Pacific Arms and Ammunition Market Share, By Country, In USD Billion, 2022-2030F
- Figure 158. India Arms and Ammunition Market, By Value, In USD Billion, 2022-2030F
- Figure 159. India Arms and Ammunition Market, By Volume, In Units, 2022-2030F
- Figure 160. India Arms and Ammunition Market Share, By Weapon Type, In USD Billion, 2022-2030F
- Figure 161. India Arms and Ammunition Market Share, By Caliber, In USD Billion, 2022-2030F
- Figure 162. India Arms and Ammunition Market Share, By Projectile Type, In USD Billion, 2022-2030F
- Figure 163. India Arms and Ammunition Market Share, By Lethality, In USD Billion, 2022-2030F
- Figure 164. India Arms and Ammunition Market Share, By Action, In USD Billion, 2022-2030F
- Figure 165. India Arms and Ammunition Market Share, By Application, In USD Billion, 2022-2030F
- Figure 166. China Arms and Ammunition Market, By Value, In USD Billion, 2022-2030F
- Figure 167. China Arms and Ammunition Market, By Volume, In Units, 2022-2030F
- Figure 168. China Arms and Ammunition Market Share, By Weapon Type, In USD Billion, 2022-2030F
- Figure 169. China Arms and Ammunition Market Share, By Caliber, In USD Billion, 2022-2030F
- Figure 170. China Arms and Ammunition Market Share, By Projectile Type, In USD Billion, 2022-2030F
- Figure 171. China Arms and Ammunition Market Share, By Lethality, In USD Billion, 2022-2030F
- Figure 172. China Arms and Ammunition Market Share, By Action, In USD Billion, 2022-2030F
- Figure 173. China Arms and Ammunition Market Share, By Application, In USD Billion, 2022-2030F
- Figure 174. Japan Arms and Ammunition Market, By Value, In USD Billion, 2022-2030F
- Figure 175. Japan Arms and Ammunition Market, By Volume, In Units, 2022-2030F
- Figure 176. Japan Arms and Ammunition Market Share, By Weapon Type, In USD Billion, 2022-2030F
- Figure 177. Japan Arms and Ammunition Market Share, By Caliber, In USD Billion, 2022-2030F
- Figure 178. Japan Arms and Ammunition Market Share, By Projectile Type, In USD Billion, 2022-2030F
- Figure 179. Japan Arms and Ammunition Market Share, By Lethality, In USD Billion, 2022-2030F
- Figure 180. Japan Arms and Ammunition Market Share, By Action, In USD Billion, 2022-2030F
- Figure 181. Japan Arms and Ammunition Market Share, By Application, In USD Billion, 2022-2030F
- Figure 182. Australia Arms and Ammunition Market, By Value, In USD Billion, 2022-2030F
- Figure 183. Australia Arms and Ammunition Market, By Volume, In Units, 2022-2030F
- Figure 184. Australia Arms and Ammunition Market Share, By Weapon Type, In USD Billion, 2022-2030F
- Figure 185. Australia Arms and Ammunition Market Share, By Caliber, In USD Billion, 2022-2030F
- Figure 186. Australia Arms and Ammunition Market Share, By Projectile Type, In USD Billion, 2022-2030F
- Figure 187. Australia Arms and Ammunition Market Share, By Lethality, In USD Billion, 2022-2030F
- Figure 188. Australia Arms and Ammunition Market Share, By Action, In USD Billion, 2022-2030F
- Figure 189. Australia Arms and Ammunition Market Share, By Application, In USD Billion, 2022-2030F
- Figure 190. Vietnam Arms and Ammunition Market, By Value, In USD Billion, 2022-2030F
- Figure 191. Vietnam Arms and Ammunition Market, By Volume, In Units, 2022-2030F
- Figure 192. Vietnam Arms and Ammunition Market Share, By Weapon Type, In USD Billion, 2022-2030F
- Figure 193. Vietnam Arms and Ammunition Market Share, By Caliber, In USD Billion, 2022-2030F
- Figure 194. Vietnam Arms and Ammunition Market Share, By Projectile Type, In USD Billion, 2022-2030F
- Figure 195. Vietnam Arms and Ammunition Market Share, By Lethality, In USD Billion, 2022-2030F
- Figure 196. Vietnam Arms and Ammunition Market Share, By Action, In USD Billion, 2022-2030F
- Figure 197. Vietnam Arms and Ammunition Market Share, By Application, In USD Billion, 2022-2030F
- Figure 198. South Korea Arms and Ammunition Market, By Value, In USD Billion, 2022-2030F
- Figure 199. South Korea Arms and Ammunition Market, By Volume, In Units, 2022-2030F
- Figure 200. South Korea Arms and Ammunition Market Share, By Weapon Type, In USD Billion, 2022-2030F
- Figure 201. South Korea Arms and Ammunition Market Share, By Caliber, In USD Billion, 2022-2030F
- Figure 202. South Korea Arms and Ammunition Market Share, By Projectile Type, In USD Billion, 2022-2030F
- Figure 203. South Korea Arms and Ammunition Market Share, By Lethality, In USD Billion, 2022-2030F
- Figure 204. South Korea Arms and Ammunition Market Share, By Action, In USD Billion, 2022-2030F
- Figure 205. South Korea Arms and Ammunition Market Share, By Application, In USD Billion, 2022-2030F
- Figure 206. Indonesia Arms and Ammunition Market, By Value, In USD Billion, 2022-2030F
- Figure 207. Indonesia Arms and Ammunition Market, By Volume, In Units, 2022-2030F
- Figure 208. Indonesia Arms and Ammunition Market Share, By Weapon Type, In USD Billion, 2022-2030F
- Figure 209. Indonesia Arms and Ammunition Market Share, By Caliber, In USD Billion, 2022-2030F
- Figure 210. Indonesia Arms and Ammunition Market Share, By Projectile Type, In USD Billion, 2022-2030F
- Figure 211. Indonesia Arms and Ammunition Market Share, By Lethality, In USD Billion, 2022-2030F
- Figure 212. Indonesia Arms and Ammunition Market Share, By Action, In USD Billion, 2022-2030F
- Figure 213. Indonesia Arms and Ammunition Market Share, By Application, In USD Billion, 2022-2030F
- Figure 214. Philippines Arms and Ammunition Market, By Value, In USD Billion, 2022-2030F
- Figure 215. Philippines Arms and Ammunition Market, By Volume, In Units, 2022-2030F
- Figure 216. Philippines Arms and Ammunition Market Share, By Weapon Type, In USD Billion, 2022-2030F
- Figure 217. Philippines Arms and Ammunition Market Share, By Caliber, In USD Billion, 2022-2030F
- Figure 218. Philippines Arms and Ammunition Market Share, By Projectile Type, In USD Billion, 2022-2030F
- Figure 219. Philippines Arms and Ammunition Market Share, By Lethality, In USD Billion, 2022-2030F
- Figure 220. Philippines Arms and Ammunition Market Share, By Action, In USD Billion, 2022-2030F
- Figure 221. Philippines Arms and Ammunition Market Share, By Application, In USD Billion, 2022-2030F
- Figure 222. Middle East & Africa Arms and Ammunition Market, By Value, In USD Billion, 2022-2030F
- Figure 223. Middle East & Africa Arms and Ammunition Market, By Volume, In Units, 2022-2030F
- Figure 224. Middle East & Africa Arms and Ammunition Market Share, By Weapon Type, In USD Billion, 2022-2030F
- Figure 225. Middle East & Africa Arms and Ammunition Market Share, By Caliber, In USD Billion, 2022-2030F
- Figure 226. Middle East & Africa Arms and Ammunition Market Share, By Projectile Type, In USD Billion, 2022-2030F
- Figure 227. Middle East & Africa Arms and Ammunition Market Share, By Lethality, In USD Billion, 2022-2030F
- Figure 228. Middle East & Africa Arms and Ammunition Market Share, By Action, In USD Billion, 2022-2030F
- Figure 229. Middle East & Africa Arms and Ammunition Market Share, By Application, In USD Billion, 2022-2030F
- Figure 230. Middle East & Africa Arms and Ammunition Market Share, By Country, In USD Billion, 2022-2030F
- Figure 231. Saudi Arabia Arms and Ammunition Market, By Value, In USD Billion, 2022-2030F
- Figure 232. Saudi Arabia Arms and Ammunition Market, By Volume, In Units, 2022-2030F
- Figure 233. Saudi Arabia Arms and Ammunition Market Share, By Weapon Type, In USD Billion, 2022-2030F
- Figure 234. Saudi Arabia Arms and Ammunition Market Share, By Caliber, In USD Billion, 2022-2030F
- Figure 235. Saudi Arabia Arms and Ammunition Market Share, By Projectile Type, In USD Billion, 2022-2030F
- Figure 236. Saudi Arabia Arms and Ammunition Market Share, By Lethality, In USD Billion, 2022-2030F
- Figure 237. Saudi Arabia Arms and Ammunition Market Share, By Action, In USD Billion, 2022-2030F
- Figure 238. Saudi Arabia Arms and Ammunition Market Share, By Application, In USD Billion, 2022-2030F
- Figure 239. UAE Arms and Ammunition Market, By Value, In USD Billion, 2022-2030F
- Figure 240. UAE Arms and Ammunition Market, By Volume, In Units, 2022-2030F
- Figure 241. UAE Arms and Ammunition Market Share, By Weapon Type, In USD Billion, 2022-2030F
- Figure 242. UAE Arms and Ammunition Market Share, By Caliber, In USD Billion, 2022-2030F
- Figure 243. UAE Arms and Ammunition Market Share, By Projectile Type, In USD Billion, 2022-2030F
- Figure 244. UAE Arms and Ammunition Market Share, By Lethality, In USD Billion, 2022-2030F
- Figure 245. UAE Arms and Ammunition Market Share, By Action, In USD Billion, 2022-2030F
- Figure 246. UAE Arms and Ammunition Market Share, By Application, In USD Billion, 2022-2030F
- Figure 247. South Africa Arms and Ammunition Market, By Value, In USD Billion, 2022-2030F
- Figure 248. South Africa Arms and Ammunition Market, By Volume, In Units, 2022-2030F
- Figure 249. South Africa Arms and Ammunition Market Share, By Weapon Type, In USD Billion, 2022-2030F
- Figure 250. South Africa Arms and Ammunition Market Share, By Caliber, In USD Billion, 2022-2030F
- Figure 251. South Africa Arms and Ammunition Market Share, By Projectile Type, In USD Billion, 2022-2030F
- Figure 252. South Africa Arms and Ammunition Market Share, By Lethality, In USD Billion, 2022-2030F
- Figure 253. South Africa Arms and Ammunition Market Share, By Action, In USD Billion, 2022-2030F
- Figure 254. South Africa Arms and Ammunition Market Share, By Application, In USD Billion, 2022-2030F
- Figure 255. By Weapon Type Map-Market Size (USD Billion) & Growth Rate (%), 2022
- Figure 256. By Caliber Map-Market Size (USD Billion) & Growth Rate (%), 2022
- Figure 257. By Projectile Type Map-Market Size (USD Billion) & Growth Rate (%), 2022
- Figure 258. By Lethality Map-Market Size (USD Billion) & Growth Rate (%), 2022
- Figure 259. By Action Map-Market Size (USD Billion) & Growth Rate (%), 2022
- Figure 260. By Application Map-Market Size (USD Billion) & Growth Rate (%), 2022
- Figure 261. By Region Map-Market Size (USD Billion) & Growth Rate (%), 2022
Global battery energy storage systems market size was valued at USD 21.64 billion in 2022 and is expected to reach USD 54.04 billion in 2030, with a CAGR of 12.12% for the forecast period between 2023 and 2030. The rising global energy demand necessitates a continuous and reliable power supply. The growing need has led to an uptick in adopting Battery Energy Storage Systems (BESS), a technology that stores electrical energy in batteries for future utilization. These systems are engineered to accumulate surplus electricity during times of abundance, such as when demand is low or when renewable energy sources like solar and wind generate excess power. They subsequently release this stored energy when required, contributing to grid stability, enhancing energy reliability, and cutting down peak electricity expenses.
Countries worldwide are increasing their reliance on renewable energy sources, like solar and wind, to mitigate carbon emissions and enhance grid stability. Nevertheless, the intermittent electricity from these sources poses a particular challenge, especially in regions like the Asia-Pacific and the Middle East & Africa, where energy production can be inconsistent. Key industries, such as data centers, healthcare facilities, and critical infrastructure, require uninterrupted power to maintain operations. Battery Energy Storage Systems (BESS) are critical for ensuring grid stability and a reliable power supply. The industrial sector relies on BESS for load balancing and operational continuity. BESS reduces peak electricity costs by storing excess energy during low demand and releasing it during peak usage hours. Advancements in battery technology enhance efficiency and cost-effectiveness, making BESS more attractive. BESS is crucial in smart energy management, promoting energy efficiency and sustainability, and expanding the global BESS market.
Clean Energy Growth Sparks Increased Interest in BESS
According to the Global Energy Alliance for People and Planet, nearly 3.6 billion people lack access to consistent and abundant energy resources. To tackle the energy disparity issue, generating an additional 2,000 terawatt-hours (TWh) of electricity each year is necessary. However, the increased electricity production could potentially contribute to higher carbon emissions and to offset it, the government is widely focusing on clean and renewable energy globally. It is evident from the fact that renewable energy capacity grew by 9.6% in 2022, adding a record 295 GW worldwide. Considering the situation, Battery Energy Storage Systems (BESS) can be a practical and improved solution to address global energy inequality as BESS stores electricity in a chemical format for later use, providing a more sustainable and efficient means of ensuring reliable energy access.
For instance, in July 2023, Hydro-Quebec subsidiary EVLO which specializes in battery energy storage systems, announced its inaugural 3 MW/12 MWh utility-scale storage project in Troy, Vermont USA, boosting local renewable energy integration. The project stores excess energy during high production times for later use during peak demand, mitigating renewable energy intermittent. It is backed by a USD 2 million partnership with the United States Department of Energy. EVLO will deliver an end-to-end solution, with project expected to be commissioned by the end of 2023, followed by 20 years of system maintenance. Such initiatives highlight the role of grid-connected renewable energy projects in the global battery energy storage system market's growth.
The Growth of Decentralized Microgrids Fuels the Battery Energy Storage System Market
The rapid development of decentralized microgrids is a significant catalyst for the Battery Energy Storage System (BESS) market. These decentralized microgrids are instrumental in curbing peak load demand, thereby alleviating the burden on the grid and elevating the overall quality of electricity provision. Simultaneously, it bolsters energy resilience, reducing reliance on centralized grids, and curbing the repercussions of power interruptions. In parallel, BESS benefits industries and critical institutions such as data centers and hospitals. It offers smart energy management solutions that empower users to fine-tune energy consumption and trim expenses. This harmonious synergy between decentralized microgrids and BESS is substantially propelling the growth of the energy storage sector.
As a testament to growing decentralization, Trina Storage in August 2023 secured multiple hundred-megawatt-hour BESS projects in the United Kingdom and German markets, introducing its flagship utility-scale battery storage system, Elementa, at Intersolar Europe 2023. This milestone marks the onset of the Elementa Gigawatt Era. Elementa integrates Trina's in-house LFP cells, a multi-level Battery Management System, and advanced fire mitigation systems, offering a state-of-the-art grid asset that enhances revenue generation, safety, and cost-efficiency.
Governments Regulations
Government regulations play a crucial role in overseeing the electricity sector, particularly concerning BESS. These rules ensure BESS's safety, efficiency, and reliability, establishing technical and operational standards. For example, in response to recent regulatory changes concerning energy security and preventing monopoly of critical material for battery manufacturing, numerous OEMs are considering establishing battery manufacturing plants outside China to diversify the global supply chain while adhering to tax and legal requirements.
Furthermore, these regulations introduced incentives and policies that stimulate investment in BESS, fostering the integration of renewable energy sources and grid stability. It addresses environmental concerns, encouraging sustainable energy practices. As an initiative to promote BESS in December 2022, the World Bank Group approved USD 311 million in financing for the Regional Emergency Solar Power Intervention Project (RESPITE). This project aims to enhance grid connectivity and promote clean energy in West African countries using solar and hydroelectric projects with battery energy storage systems. Additionally, acts like "the United States Inflation Reduction Act of August 2022" has catalyzed significant investments in the battery supply chain and clean energy, with a focus on supporting the domestic supply chain from raw materials to electric vehicles and energy storage. These regulations facilitate innovation and investment in the evolving BESS sector.
Power Quality Advancements Drive BESS Market Growth
The Battery Energy Storage System market's growth is linked to advancements in power quality. BESS technology enhances and stabilizes power quality in the electrical grid by mitigating voltage fluctuations and frequency variations. It is crucial for heavy industrial operations with high peak load demands. As renewable energy sources are integrated into the grid, BESS acts as a buffer to smooth out fluctuations, bolstering grid stability. Its interplay highlights energy storage's essential role in the evolving energy landscape, driving the BESS market's continued growth.
For instance, in August 2023, Hitachi Ltd. secured an order for grid energy storage systems from Matsuyama Mikan Energy LLC in Japan. The order involved the deployment of Hitachi Energy's grid edge solution, an e-mesh PowerStore, a Battery Energy Storage System (BESS) with a strong global track record. The e-mesh PowerStore BESS plays a vital role in high-quality power management and swiftly responding to power supply and demand fluctuations. As the demand for reliable, uninterrupted power continues to rise, BESS becomes an indispensable component in the global energy market.
Cost and Remote Installation Challenges Battery Energy Storage System Market
The BESS market faces significant challenges related to cost and deploying systems in remote locations. The substantial initial expenses associated with BESS technology can discourage many potential users, limiting its widespread adoption. Furthermore, installing BESS in remote areas, especially those with limited infrastructure and accessibility issues, can present logistical complexities. Developing countries are struggling with various obstacles, including an unreliable power supply, inadequate generation capacity, underdeveloped grid infrastructure, a lack of monitoring and control equipment, and a shortage of skilled personnel. However, the declining cost of renewable energy and government incentives are emerging as potential drivers to initiate projects in this sector, potentially alleviating these difficulties.
Leading such change in August 2022, Eskom, the South African electricity supplier, made contractor selections for 343 MW of battery energy storage projects. These projects are intended for remote areas with limited distribution network access but situated near large-scale renewable energy sources. Following a competitive solicitation process, Eskom chose Hyosung Heavy Industries from South Korea and Pinggao Group from China to handle the battery project design, supply, and installation. These companies were awarded five-year contracts to provide operation and maintenance services.
Impact of COVID-19
The COVID-19 pandemic had a mixed impact on the BESS market, with supply chain disruptions and construction delays causing some projects to be delayed. However, the pandemic highlighted the importance of grid resilience and uninterrupted power supply, increasing interest in BESS for energy security. The market is expected to rebound and grow as economies recover, driven by a focus on resilient energy infrastructure and sustainable solutions. The integration of battery energy storage in power systems is rising, aligning with the expansion of renewable energy sources. In 2022, around 192 GW of solar and 75 GW of wind capacity were installed worldwide, leading to the deployment of 16 GW/35 GWh of new BESS to support and store this growing renewable energy output.
Impact of Russia-Ukraine War
The Russia-Ukraine conflict has reverberated through the Battery Energy Storage System (BESS) market, triggering multifaceted impacts. With an emphasis on energy security, nations are increasingly turning to BESS to bolster grid reliability amid geopolitical uncertainty. However, the conflict disrupted the supply chain for essential battery materials, as Russia controls a major share of key resources such as nickel, palladium, lithium, platinum, cobalt, neon gas, aluminum, and copper. To circumvent this disruption, companies actively diversify their supply chains, search for alternative material sources, and build resilient, multi-sourced supply routes. Moreover, the crisis has underscored the importance of mitigating geopolitical risks, further highlighting BESS's role as a resilience strategy and its significance in facilitating the integration of renewable energy sources, ultimately reducing dependence on fossil fuels in an unpredictable geopolitical landscape.
Key Players Landscape and Outlook
The BESS market is experiencing rapid growth, driven by innovations and partnerships. Industry leaders prioritize modular BESS systems and engage in research and development. Advancements in lithium-ion batteries, core to BESS, have improved energy density, charging speed, and cost-effectiveness. Alternatives like solid-state and sodium-ion batteries aim for higher energy density and lower costs. Companies like LG Energy Solution, CATL, SK, Solid Power, Prologium, and Quantumscape are pushing these technologies. These advancements fuel the BESS market's expansion, supporting grid stability, renewables integration, and electric vehicles.
For instance, in May 2023, TAE Power Solutions inaugurated a facility in the United Kingdom for developing battery packs used in electric mobility and energy storage, aiming to validate and industrialize modular battery solutions.
In June 2023, Honeywell unveiled Honeywell Ionic, a compact battery energy storage system with improved energy density and lower installation costs, featuring their Experion Energy Control System and adaptable Battery Management System.
Companies are introducing tailored product ranges to meet user needs, whether for residential, commercial, or utility-scale industrial BESS. Consumers warmly embrace these innovations, accelerating growth in the global BESS market.
Table of Contents
1. Research Methodology
2. Project Scope & Definitions
3. Impact of COVID-19 on Global Battery Energy Storage Systems Market
4. Impact of Russia-Ukraine War
5. Executive Summary
6. Voice of Customer
- 6.1. Market Awareness and Product Information
- 6.2. Factors Considered in Purchase Decision
- 6.2.1. Price & Performance
- 6.2.2. Safety & Warranty
- 6.2.3. Ease of Installation
- 6.2.4. Brand
- 6.2.5. Lead Time
- 6.2.6. After Sales Support
- 6.2.7. Software Capabilities & Offerings
- 6.2.8. Space Requirements
7. Global Battery Energy Storage Systems Outlook, 2022-2030F
- 7.1. Market Size & Forecast
- 7.1.1. By Value
- 7.1.2. By Volume
- 7.2. By Battery Type
- 7.2.1. Lithium-ion batteries
- 7.2.2. Lead-acid batteries
- 7.2.3. Flow Batteries
- 7.2.4. Others
- 7.3. By Connection Type
- 7.3.1. On-Grid
- 7.3.2. Off-Grid
- 7.4. By Application
- 7.4.1. Utility
- 7.4.2. Commercial
- 7.4.3. Industrial
- 7.4.4. Residential
- 7.5. By Capacity
- 7.5.1. Below 100 MWh
- 7.5.2. 100 - 500 MWh
- 7.5.3. Above 500 MWh
- 7.6. By Region
- 7.6.1. North America
- 7.6.2. Europe
- 7.6.3. Asia-Pacific
- 7.6.4. South America
- 7.6.5. Middle East & Africa
- 7.7. By Company Market Share (%), 2022
8. Global Battery Energy Storage Systems Market Outlook, By Region, 2022-2030F
- 8.1. North America*
- 8.1.1. Market Size & Forecast
- 8.1.1.1. By Value
- 8.1.1.2. By Volume
- 8.1.2. By Battery Type
- 8.1.2.1. Lithium-ion batteries
- 8.1.2.2. Lead-acid batteries
- 8.1.2.3. Flow Batteries
- 8.1.2.4. Others
- 8.1.3. By Connection Type
- 8.1.3.1. On-Grid
- 8.1.3.2. Off-Grid
- 8.1.4. By Application
- 8.1.4.1. Utility
- 8.1.4.2. Commercial
- 8.1.4.3. Industrial
- 8.1.4.4. Residential
- 8.1.5. By Capacity
- 8.1.5.1. Below 100 MWh
- 8.1.5.2. 100 - 500 MWh
- 8.1.5.3. Above 500 MWh
- 8.1.6. United States*
- 8.1.6.1. Market Size & Forecast
- 8.1.6.1.1. By Value
- 8.1.6.1.2. By Volume
- 8.1.7. By Battery Type
- 8.1.7.1. Lithium-ion batteries
- 8.1.7.2. Lead-acid batteries
- 8.1.7.3. Flow Batteries
- 8.1.7.4. Others
- 8.1.8. By Connection Type
- 8.1.8.1. On-Grid
- 8.1.8.2. Off-Grid
- 8.1.9. By Application
- 8.1.9.1. Utility
- 8.1.9.2. Commercial
- 8.1.9.3. Industrial
- 8.1.9.4. Residential
- 8.1.10. By Capacity
- 8.1.10.1. Below 100 MWh
- 8.1.10.2. 100 - 500 MWh
- 8.1.10.3. Above 500 MWh
- 8.1.11. Canada
- 8.1.12. Mexico
- 8.1.1. Market Size & Forecast
All segments will be provided for all regions and countries covered:
- 8.2. Europe
- 8.2.1. Germany
- 8.2.2. France
- 8.2.3. Italy
- 8.2.4. United Kingdom
- 8.2.5. Russia
- 8.2.6. Netherlands
- 8.2.7. Spain
- 8.3. South America
- 8.3.1. Brazil
- 8.3.2. Argentina
- 8.4. Asia-Pacific
- 8.4.1. India
- 8.4.2. China
- 8.4.3. Japan
- 8.4.4. Australia
- 8.4.5. South Korea
- 8.5. Middle East & Africa
- 8.5.1. Saudi Arabia
- 8.5.2. UAE
- 8.5.3. South Africa
9. Market Mapping, 2022
- 9.1. By Battery Type
- 9.2. By Connection Type
- 9.3. By Application
- 9.4. By Capacity
- 9.5. By Region
10. Macro Environment and Industry Structure
- 10.1. Supply Demand Analysis
- 10.2. Import Export Analysis - Value
- 10.3. Supply/Value Chain Analysis
- 10.4. PESTEL Analysis
- 10.4.1. Political Factors
- 10.4.2. Economic System
- 10.4.3. Social Implications
- 10.4.4. Technological Advancements
- 10.4.5. Environmental Impacts
- 10.4.6. Legal Compliances and Regulatory Policies (Statutory Bodies Included)
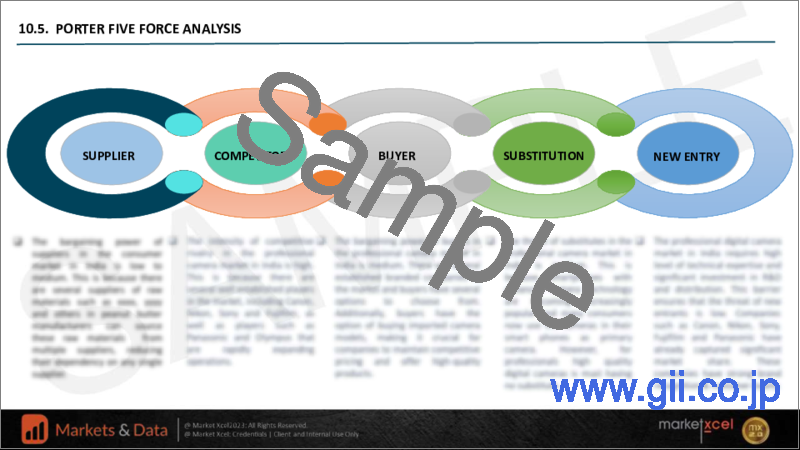
- 10.5. Porter's Five Forces Analysis
- 10.5.1. Supplier Power
- 10.5.2. Buyer Power
- 10.5.3. Substitution Threat
- 10.5.4. Threat from New Entrant
- 10.5.5. Competitive Rivalry
11. Market Dynamics
- 11.1. Growth Drivers
- 11.2. Growth Inhibitors (Challenges, Restraints)
12. Key Players Landscape
- 12.1. Competition Matrix of Top Five Market Leaders
- 12.2. Market Revenue Analysis of Top Five Market Leaders (in %, 2022)
- 12.3. Mergers and Acquisitions/Joint Ventures (If Applicable)
- 12.4. SWOT Analysis (For Five Market Players)
- 12.5. Patent Analysis (If Applicable)
13. Pricing Analysis
14. Case Studies
15. Key Players Outlook
- 15.1. BYD Company Co., Ltd.
- 15.1.1. Company Details
- 15.1.2. Key Management Personnel
- 15.1.3. Products & Services
- 15.1.4. Financials (As reported)
- 15.1.5. Key Market Focus & Geographical Presence
- 15.1.6. Recent Developments
- 15.2. Contemporary Amperex Technology Co., Limited
- 15.3. LG Chem Ltd.
- 15.4. Samsung SDI Co., Ltd.
- 15.5. Panasonic Corporation
- 15.6. ABB Ltd
- 15.7. Siemens AG
- 15.8. Hitachi, Ltd.
- 15.9. Saft Groupe S.A.
- 15.10. Honeywell International Inc.
Companies mentioned above DO NOT hold any order as per market share and can be changed as per information available during research work.