|
|
市場調査レポート
商品コード
1636631
通信事業者のOPEX分析 (2016-23年):依然として高いネットワークOPEXに悩む通信事業者、将来の利益を求めてAIと自動化に注目Telco Opex Analyzer, 2016-23: Telcos Grapple with Stubbornly High Network Opex, Look to AI and Automation for Future Gains |
||||||

|
|||||||
|
|||||||


| 通信事業者のOPEX分析 (2016-23年):依然として高いネットワークOPEXに悩む通信事業者、将来の利益を求めてAIと自動化に注目 |
|
出版日: 2025年01月16日
発行: MTN Consulting, LLC
ページ情報: 英文
納期: 即納可能
|

全表示
- 概要
- 図表
- 目次
本レポートでは、2016年から2013年までの通信事業者のOPEX動向をカテゴリー別に深堀りし、主要地域の32社のデータを分析しています。
ビジュアル
通信事業者が成長し、収益性を高めていくためには、OPEXを賢く管理することが不可欠です。2023年の世界の通信事業者の収益は、前年比0.5%減の1兆7,781億ドルとなりました。これは10年ぶりの低水準であり、特に日本における為替変動と5Gの収益化機会の限定性がその要因です。収益の停滞に加え、通信事業者は高いCAPEX需要と厳しい競争に直面しており、資産の売却やアウトソーシングのような伝統的な手法だけでなく、戦略的なコスト最適化の必要性が強調されています。そのため、OPEXの管理が重要です。
主要調査結果:
2023年のOPEXは1.0%減少しましたが、減価償却費 (D&A) を除いたOPEXは0.5%の減少であり、これは収益とほぼ同じ減少率でした。その差はD&Aであり、2023年には3%と急な落ち込みとなっています。
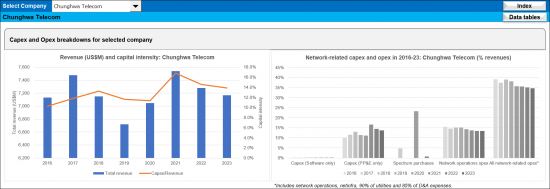
- ネットワーク関連のOPEXは、オペレーション、リース、ユーティリティ、D&Aを含み、OPEX全体の50.8%を占めるが、企業によって大きなばらつきがある
- ネットワーク運用コストは2016年のOPEXの16.5%から2023年には18.4%に増加している。ネットワークリースOPEXは、新しい会計規則 (IFRS 16) により数年前に減少し、現在は3.0~3.5%の範囲で安定している
- 最大のOPEXカテゴリーであるD&Aは2023年にはOPEXの23.4%に増加している
- 通信事業者のデジタル人材獲得競争や自動化の導入に伴い、OPEXの16%以上を占める人件費は上昇傾向にある。OPEX全体に占める人件費の割合は2016年の16.2%から、2023年には17.4%に増加している
調査対象オペレーター:
|
|
目次
- 1.レポートハイライト
- 2.概要
- 3.調査結果:通信グループ32社
- 4.調査結果:企業別
- 5.分類
- 6.当社について
List of Figures and Charts:
- 1. Capex and Opex as % of Revenues - Group of 32
- 2. Network-related capex and opex in 2016-23: Group of 32 (% revenues)
- 3. Opex by category, 2016-23 average
- 4. Network-related opex categories as % of total opex, 2016-23
- 5. All network-related opex, % total
- 6. Profit margins for group of 32 telcos, 2016-23 average
- 7. Labor costs as a % of total opex
- 8. Labor costs per employee (US$K)
- 9. Opex items by company, % total opex: 2023
- 10. Profitability margins by company, 2023
- 11. Company-level revenue (US$M) and capital intensity
- 12. Company-level network-related capex and opex in 2016-23
- 13. Company-level opex by category, 2016-23 average
- 14. Company-level network-related opex categories, as % of total opex, 2016-23
- 15. Company-level all network-related opex as % of total opex
- 16. Labor costs per employee (US$K): company vs. global telco average
- 17. Labor costs as a % of total opex: company vs. global telco average
- 18. Average profit margins, 2016-23: company vs. global telco average
- 19. Company-level profitability trends, 2016-23
This report provides a deep dive into telco opex trends by category from 2016 to 2013, analyzing data from 32 companies across key regions.
VISUALS
Managing opex wisely is essential for telcos to thrive and grow profitability: in 2023, global telco revenues fell 0.5% YoY to $1,778.1B. That marks a decade-low, due to currency fluctuations, particularly in Japan, and limited 5G monetization opportunities. In addition to stagnant revenues, telcos face high capex demands and fierce competition, emphasizing the need for strategic cost optimization beyond traditional methods like asset sell-offs and outsourcing. Getting opex under control is key.
Key findings of our telco opex study include:
Total opex fell by 1.0% in 2023, but opex excluding depreciation and amortization (D&A) declined by 0.5%, or about the same rate of decline as revenues. The difference is D&A, which fell at the much steeper clip of 3% in 2023.
- Network-related opex, encompassing operations, leasing, utilities, and D&A, constitutes 50.8% of total opex, with significant company-specific variations.
- Network operations costs rose from 16.5% of opex in 2016 to 18.4% in 2023. Network leasing opex declined several years ago due to new accounting rules (IFRS 16) and are now steadily in the 3.0 to 3.5% range.
- Depreciation and amortization, the largest opex category, grew to 23.4% of opex in 2023.
- Labor costs, accounting for over 16% of opex, are rising as telcos compete for digital talent and embrace automation. As a percentage of total opex, labor costs increased from 16.2% in 2016 to 17.4% in 2023.
The report underscores the need for telcos to standardize opex tracking and implement transformative measures to enhance profitability. By benchmarking costs and uncovering inefficiencies, telcos and vendors can better navigate industry challenges and opportunities.
*Companies included: Advanced Info Service (AIS), Airtel, Batelco, BT, Charter Communications, China Mobile, Chunghwa Telecom, Du, Etisalat, Globe Telecom, KDDI, KPN, LG Uplus, Megafon, MTN Group, Oi, Ooredoo, Orange, PLDT, Proximus, Saudi Telecom (STC), Singtel, SK Telecom, Starhub, Swisscom, Tata Communications, Telecom Argentina, Telecom Italia, Telkom Indonesia, Telus, Turk Telekom, and Veon.
Operator coverage:
|
|
Table of Contents
- 1. Report Highlights
- 2. Abstract
- 3. Results for Group of 32 Telcos
- 4. Results by Company
- 5. Taxonomy
- 6. About

