
|
市場調査レポート
商品コード
1693863
米国の乳製品-市場シェア分析、産業動向と統計、成長予測(2025年~2030年)United States Dairy - Market Share Analysis, Industry Trends & Statistics, Growth Forecasts (2025 - 2030) |
||||||
カスタマイズ可能
適宜更新あり
|
|||||||
| 米国の乳製品-市場シェア分析、産業動向と統計、成長予測(2025年~2030年) |
|
出版日: 2025年03月18日
発行: Mordor Intelligence
ページ情報: 英文 272 Pages
納期: 2~3営業日
|

全表示
- 概要
- 目次
概要
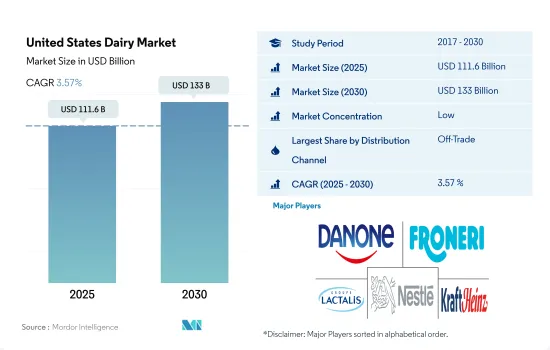
米国の乳製品市場規模は2025年に1,116億米ドルと推定され、2030年には1,330億米ドルに達し、予測期間中(2025~2030年)のCAGRは3.57%で成長すると予測されます。
クリーンラベル製品の入手可能性が北米の小売部門の成長を促進
- 米国の流通チャネルは2021年比で2022年に1.62%成長しました。この成長は、チーズ、ヨーグルト、牛乳などの乳製品セグメントにおけるクリーンラベル製品の人気と入手可能性に起因します。これらのクリーンラベル乳製品は、人工着色料、香料、保存料などの人工成分を使用していないです。これらの小売業者はまた、様々なブランドの乳製品を幅広く提供しています。米国における流通チャネルの需要を考慮すると、このセグメントは2025年に16.02%増加すると予想されます。
- スーパーマーケットやハイパーマーケットは、商品を保管するスペースや棚が広いです。その結果、オフトレードの小売形態では、スーパーマーケットとハイパーマーケットが2022年に61.77%のシェアを占め、この国の流通チャネル全体を支配しました。全国のこれらのスーパーマーケットやハイパーマーケットには、Walmart、Target、Kroger、Amazon、Costco Wholesale Corporation、Albertsons Cos.、Ahold Delhaize USA、Publix Super Markets Inc.などがあります。これらの小売業者は、さまざまな価格(低価格、中価格、高価格)で乳製品を提供しています。米国におけるアイスクリームの基本販売価格は2.68米ドルで、50米ドルまで上がることもあります。
- 米国では、消費者は主に屋外で消費することを好みます。2022年、米国では2,310万人が少なくとも週に1回は屋外で食事を摂っていることが確認されました。同国のレストラン総数は、2020年には105万店でした。その結果、同国では過去5年間で、オントレードの小売形態が人気を博しています。米国では、2022年には、オントレード小売モードにおいて、牛乳部門は他の乳製品と比較して79.87%のシェアを占めています。
米国の乳製品市場動向
牛乳の栄養プロファイルに対する需要の高まりが米国の乳製品消費に大きく影響
- 乳製品の中で牛乳は、ビタミンA(15%)、ビタミンD(15%)、リボフラビンB2(30%)、ナイアシンB3(15%)、カルシウム(25%)を含む13種類の必須栄養素の供給源としてトップです。その栄養価の高さから、18歳以下の幼児や若者の食生活に非常に好まれています。米国の平均消費者は2021年に乳脂肪ベースで667ポンドの乳製品を消費しました。一人当たりの牛乳消費量全体では、学校給食プログラムが乳製品の消費促進に重要な役割を果たしています。学校給食は健康的な食事パターンの消費と促進を可能にします。2021年には、6歳から12歳の子どもは35%、13歳から18歳の子どもは25%の液体ミルクを学校で摂取することになります。
- 消費される乳製品の中でも、米国ではチーズの人気が高まっており、ピザの消費に好影響を与えています。ドミノ・ピザ、ピザハット、リトル・シーザーズ、マルコ・ピザといった大手チェーンが、全米でピザの持ち帰りや宅配を後押ししています。これはまた、消費者が家庭で食事を作ることに関心を持ち、先行き不透明な時代に、グリルチーズサンドイッチ、ナチョス、マックアンドチーズのような、よりノスタルジックな料理に憧れ、一人当たり消費を牽引しているためでもあります。2021年、チーズの一人当たり消費量は2020年比で5.3%増加しました。
- 2020年の乳製品の一人当たり消費量は、COVID-19の大流行と生産者価格差のマイナスにより2%減少しました。2020年、米国は認可を受けた酪農事業の9%以上を失い、その年の酪農事業施設はわずか3万2,000施設となりました。市場は2021~2023年にかけてかなり回復しており、一人当たりの消費量は4.3%と着実に伸びています。
米国の乳製品産業概要
米国の乳製品市場は細分化されており、上位5社で17.67%を占めています。この市場の主要企業は、Danone SA、Froneri International Limited、Groupe Lactalis、Nestle SA、The Kraft Heinz Companyなどです。
その他の特典
- エクセル形式の市場予測(ME)シート
- 3ヶ月間のアナリストサポート
目次
第1章 エグゼクティブサマリーと主要調査結果
第2章 レポートのオファー
第3章 イントロダクション
- 調査の前提条件と市場定義
- 調査範囲
- 調査手法
第4章 主要産業動向
- 一人当たり消費量
- 原料/商品生産量
- バター
- チーズ
- 牛乳
- 規制の枠組み
- 米国
- バリューチェーンと流通チャネル分析
第5章 市場セグメンテーション
- カテゴリー
- バター
- 製品タイプ別
- 培養バター
- 未加工バター
- チーズ
- 製品タイプ別
- 天然チーズ
- プロセスチーズ
- クリーム
- 製品タイプ別
- ダブルクリーム
- シングルクリーム
- ホイップクリーム
- その他
- 乳製品デザート
- 製品タイプ別
- チーズケーキ
- フローズンデザート
- アイスクリーム
- ムース
- その他
- 牛乳
- 製品タイプ別
- コンデンスミルク
- フレーバーミルク
- フレッシュミルク
- 粉ミルク
- UHTミルク
- サワーミルクドリンク
- ヨーグルト
- 製品タイプ別
- フレーバーヨーグルト
- ノンフレーバーヨーグルト
- バター
- 流通チャネル
- オフトレード
- コンビニエンスストア
- オンライン小売
- 専門小売店
- スーパーマーケットとハイパーマーケット
- その他(倉庫クラブ、ガソリンスタンドなど)
- オントレード
- オフトレード
第6章 競合情勢
- 主要な戦略動向
- 市場シェア分析
- 企業情勢
- 企業プロファイル
- California Dairies Inc.
- Conagra Brands Inc.
- Continental Dairy Facilities LLC
- Dairy Farmers of America Inc.
- Danone SA
- Froneri International Limited
- Groupe Lactalis
- Land O'Lakes Inc.
- Nestle SA
- Prairie Farms Dairy Inc.
- Schreiber Foods Inc.
- The Kraft Heinz Company
第7章 CEOへの主要戦略的質問
第8章 付録
- 世界概要
- 概要
- ファイブフォース分析フレームワーク
- 世界のバリューチェーン分析
- 市場力学(DROs)
- 情報源と参考文献
- 図表一覧
- 主要な洞察
- データパック
- 用語集
目次
Product Code: 50000721
The United States Dairy Market size is estimated at 111.6 billion USD in 2025, and is expected to reach 133 billion USD by 2030, growing at a CAGR of 3.57% during the forecast period (2025-2030).
Availability of clean label products is enhancing the growth of retailing unit in North America
- The US distribution channel grew 1.62% in 2022 compared to 2021. The growth is attributed to the popularity and availability of clean-label products in dairy segments, such as cheese, yogurt, and milk. These clean-label dairy products are free from artificial ingredients, including artificial colors, flavors, and preservatives. These retailers also offer a wide variety of dairy products of various brands. Considering the demand for distribution channels in the United States, this segment is expected to rise by 16.02% in 2025.
- Supermarkets and hypermarkets have larger spaces and shelves to store their products. As a result, under the off-trade retailing modes, supermarkets and hypermarkets dominated the country's overall distribution channel by holding a share of 61.77% in 2022. Some of these supermarkets and hypermarkets nationwide are Walmart, Target, Kroger, Amazon, Costco Wholesale Corporation, Albertsons Cos., Ahold Delhaize USA, and Publix Super Markets Inc. These retailers are providing dairy products at varied prices (low, medium, and high). The base selling price of ice cream in the United States is USD 2.68, which can go as high as USD 50.
- In the United States, consumers majorly prefer out-house consumption. In 2022, it was observed that 23.1 million individuals were consuming food outside at least once a week in the United States. The total number of restaurants in the country was 1.05 million in 2020. As a result, on-trade retailing modes have gained popularity in the last five years in the country. In the United States, under the on-trade retailing mode, the milk segment held a share of 79.87% compared with other dairy products in 2022.
United States Dairy Market Trends
Increased demand for milk's nutritional profile largely impacts the consumption of dairy in the United States
- Among dairy products, milk is the top source of 13 essential nutrients, including vitamin A (15%), vitamin D (15%), riboflavin B2 (30%), niacin B3 (15%), and calcium (25%). Due to its nutritional profile, it is highly preferred in the diets of children and youth aged 18 and younger. The average US consumer consumed 667 pounds of dairy on a milk-fat basis in 2021. For the overall milk per capita consumption, school meal programs play an important role in promoting the consumption of dairy. They allow the consumption and promotion of healthy dietary patterns. In 2021, children aged between 6 and 12 years received 35% of their liquid milk at schools, and those aged between 13 and 18 received 25%.
- Among the dairy products consumed, the increasing popularity of cheese among the US population has positively impacted the consumption of pizza. Large chains such as Domino's Pizza, Pizza Hut, Little Caesars, and Marco's Pizza have boosted the carry-out and delivery of pizza throughout the country. This is also because consumers are more interested in cooking meals at home, and during an uncertain time, they long for more nostalgic dishes, like grilled cheese sandwiches, nachos, and mac and cheese, driving per capita consumption. In 2021, the per capita consumption of cheese increased by 5.3% compared to 2020.
- The per capita consumption of dairy products declined by 2% in 2020 because of the COVID-19 pandemic and negative producer price differentials. In 2020, the United States lost more than 9% of licensed dairy operations, which resulted in only 32,000 dairy operation facilities in that year. The market has seen a considerable recovery during 2021-2023, with a steady growth of 4.3% in per capita consumption.
United States Dairy Industry Overview
The United States Dairy Market is fragmented, with the top five companies occupying 17.67%. The major players in this market are Danone SA, Froneri International Limited, Groupe Lactalis, Nestle SA and The Kraft Heinz Company (sorted alphabetically).
Additional Benefits:
- The market estimate (ME) sheet in Excel format
- 3 months of analyst support
TABLE OF CONTENTS
1 EXECUTIVE SUMMARY & KEY FINDINGS
2 REPORT OFFERS
3 INTRODUCTION
- 3.1 Study Assumptions & Market Definition
- 3.2 Scope of the Study
- 3.3 Research Methodology
4 KEY INDUSTRY TRENDS
- 4.1 Per Capita Consumption
- 4.2 Raw Material/commodity Production
- 4.2.1 Butter
- 4.2.2 Cheese
- 4.2.3 Milk
- 4.3 Regulatory Framework
- 4.3.1 United States
- 4.4 Value Chain & Distribution Channel Analysis
5 MARKET SEGMENTATION (includes market size in Value in USD and Volume, Forecasts up to 2030 and analysis of growth prospects)
- 5.1 Category
- 5.1.1 Butter
- 5.1.1.1 By Product Type
- 5.1.1.1.1 Cultured Butter
- 5.1.1.1.2 Uncultured Butter
- 5.1.2 Cheese
- 5.1.2.1 By Product Type
- 5.1.2.1.1 Natural Cheese
- 5.1.2.1.2 Processed Cheese
- 5.1.3 Cream
- 5.1.3.1 By Product Type
- 5.1.3.1.1 Double Cream
- 5.1.3.1.2 Single Cream
- 5.1.3.1.3 Whipping Cream
- 5.1.3.1.4 Others
- 5.1.4 Dairy Desserts
- 5.1.4.1 By Product Type
- 5.1.4.1.1 Cheesecakes
- 5.1.4.1.2 Frozen Desserts
- 5.1.4.1.3 Ice Cream
- 5.1.4.1.4 Mousses
- 5.1.4.1.5 Others
- 5.1.5 Milk
- 5.1.5.1 By Product Type
- 5.1.5.1.1 Condensed milk
- 5.1.5.1.2 Flavored Milk
- 5.1.5.1.3 Fresh Milk
- 5.1.5.1.4 Powdered Milk
- 5.1.5.1.5 UHT Milk
- 5.1.6 Sour Milk Drinks
- 5.1.7 Yogurt
- 5.1.7.1 By Product Type
- 5.1.7.1.1 Flavored Yogurt
- 5.1.7.1.2 Unflavored Yogurt
- 5.1.1 Butter
- 5.2 Distribution Channel
- 5.2.1 Off-Trade
- 5.2.1.1 Convenience Stores
- 5.2.1.2 Online Retail
- 5.2.1.3 Specialist Retailers
- 5.2.1.4 Supermarkets and Hypermarkets
- 5.2.1.5 Others (Warehouse clubs, gas stations, etc.)
- 5.2.2 On-Trade
- 5.2.1 Off-Trade
6 COMPETITIVE LANDSCAPE
- 6.1 Key Strategic Moves
- 6.2 Market Share Analysis
- 6.3 Company Landscape
- 6.4 Company Profiles (includes Global Level Overview, Market Level Overview, Core Business Segments, Financials, Headcount, Key Information, Market Rank, Market Share, Products and Services, and Analysis of Recent Developments).
- 6.4.1 California Dairies Inc.
- 6.4.2 Conagra Brands Inc.
- 6.4.3 Continental Dairy Facilities LLC
- 6.4.4 Dairy Farmers of America Inc.
- 6.4.5 Danone SA
- 6.4.6 Froneri International Limited
- 6.4.7 Groupe Lactalis
- 6.4.8 Land O'Lakes Inc.
- 6.4.9 Nestle SA
- 6.4.10 Prairie Farms Dairy Inc.
- 6.4.11 Schreiber Foods Inc.
- 6.4.12 The Kraft Heinz Company
7 KEY STRATEGIC QUESTIONS FOR DAIRY AND DAIRY ALTERNATIVE CEOS
8 APPENDIX
- 8.1 Global Overview
- 8.1.1 Overview
- 8.1.2 Porter's Five Forces Framework
- 8.1.3 Global Value Chain Analysis
- 8.1.4 Market Dynamics (DROs)
- 8.2 Sources & References
- 8.3 List of Tables & Figures
- 8.4 Primary Insights
- 8.5 Data Pack
- 8.6 Glossary of Terms

