
|
市場調査レポート
商品コード
1693766
アジア太平洋のバイオ肥料:市場シェア分析、産業動向、成長予測(2025年~2030年)Asia-Pacific Biofertilizer - Market Share Analysis, Industry Trends & Statistics, Growth Forecasts (2025 - 2030) |
||||||
カスタマイズ可能
適宜更新あり
|
|||||||
| アジア太平洋のバイオ肥料:市場シェア分析、産業動向、成長予測(2025年~2030年) |
|
出版日: 2025年03月18日
発行: Mordor Intelligence
ページ情報: 英文 177 Pages
納期: 2~3営業日
|

全表示
- 概要
- 目次
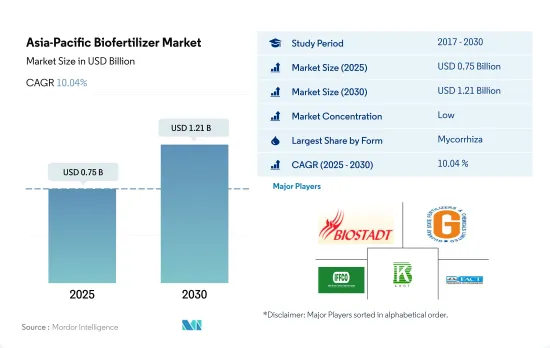
アジア太平洋のバイオ肥料市場規模は、2025年には7億5,000万米ドルと推定され、2030年には12億1,000万米ドルに達すると予測され、予測期間中(2025~2030年)のCAGRは10.04%で成長すると予測されます。
- バイオ肥料は生きた微生物であり、土壌中の養分利用可能性を動員または増加させることによって植物の栄養を促進します。菌根菌、アゾスピリラム、アゾトバクタ、リゾビウム、リン酸可溶化細菌は、農業でバイオ肥料として最も一般的に利用されている微生物です。同地域のバイオ肥料市場は、2017~2022年にかけて金額ベースで2.4%(CAGR)成長しました。しかし、バイオ肥料の市場規模は2023~2029年の間に約9.9%(CAGR)増加すると予測されています。
- これらのバイオ肥料の中で、アゾトバクタはアジア太平洋で2番目に広く利用されており、2022年には1億4,180万米ドルで市場の24.6%を占めます。アゾトバクタは窒素固定細菌であり、共生関係を必要とせず、大気中の窒素を固定して植物に利用できるようにします。アゾトバクタは、稲、綿花、野菜など、すべての非反芻性植物用のバイオ肥料として使用されています。
- バイオ肥料の消費は連作作物で圧倒的に多く、2022年には約4億7,910万米ドルと評価されます。この地域で栽培されている主要連作作物には、コメ、小麦、大麦、トウモロコシ、大豆が含まれます。連作作物の優位性は、主に有機栽培面積が大きいことに起因しており、2022年には同地域の有機作物栽培面積の約67.5%を占めています。
- 有機作物生産の拡大や国内外市場での有機製品に対する需要の高まりを受けて、有機農業やサステイナブル農業を推進する地域各国の政府の取り組みが増加しています。これらの要因は、予測期間を通じて市場に影響を与える可能性があります。アジア太平洋のバイオ肥料市場は、2023~2029年にかけて約9.9%の成長(CAGR)が見込まれています。
- アジア太平洋の有機栽培面積は2017~2022年にかけて大幅に拡大し、それぞれ310万ヘクタールから380万ヘクタールになりました。アジア太平洋諸国の多くで有機栽培食品への需要が高まっているためです。その結果、アジア太平洋のバイオ肥料市場は2017~2022年にかけて2.4%(CAGR)成長しました。
- アジア太平洋で2番目に人気のあるバイオ肥料はアゾトバクタで、2022年には市場の24.6%を占め、1億4,180万米ドルとなりました。アゾトバクタは、窒素固定能力とバクテリアの可溶化能力により、作物生産をよりサステイナブルものにする農業用バイオ肥料として利用できる76。
- バイオイノキュラントとしてのアゾトバクタは、ニコチン酸、ビオチン、ヘテロアオキシン、ビタミンB、ジベレリンなど、根の開発とミネラル吸収をサポートする生物学的に活性な化合物を大量に合成し、農業生産性を10~12%高めることが実証されています。イネ、コムギ、キビ、ワタ、トマト、キャベツ、マスタード、ベニバナなど、非イネ科作物の大半がアゾトバクタの使用を推奨されています。
- 中国は2022年のバイオ肥料市場全体の93.5%を占め、この地域の支配的な国となっています。2022年の中国のバイオ肥料市場は、畝作物が82.3%を占め、圧倒的でした。2022年には210万ヘクタールの有機栽培面積が確保されました。
- 有機製品に対する消費者の関心の高まりにより、農業従事者は農薬投入に頼ることのデメリットを認識するようになり、有機栽培面積が増加しています。アジア太平洋におけるバイオ肥料の需要は、2023~2029年の間にCAGR 8.6%で増加すると予測されています。
アジア太平洋のバイオ肥料市場動向
中国、インド、インドネシア、オーストラリアなどの国々で政府支援が拡大し、同地域の有機農業を後押し
- FiBLの統計によると、アジア太平洋の有機農地面積は2021年には370万haを超え、世界の有機農地面積の26.4%を占めました。有機栽培面積は2017~2022年の間に19.3%増加しました。2020年時点で、この地域の有機生産者は183万人で、インドが130万人でトップです。中国、インド、インドネシア、オーストラリアは、この地域で有機栽培面積が大きい主要国です。中国やインドなどの政府当局は、作物栽培における化学品への依存を減らすため、有機農業を絶えず推進しています。例えば、インドはParamparagat Krishi Vikas YojanaやAll India Network Programme on Organic Farming(AI-NPOF)のような制度を実施しています。
- 2021年には、中国が250万haで66.1%の最大シェアを占め、次いでインドが19.3%、インドネシアが1.5%、オーストラリアが1.4%でした。全有機農地は、連作作物、園芸作物、換金作物の3つの作物タイプに分けられます。連作作物はこの地域の有機農地の67.5%、すなわち2021年には250万haを占め、大きなシェアを占めています。この地域で栽培されている主要連作作物には、水稲、小麦、豆類、大豆、雑穀が含まれます。
- 換金作物のシェアは第2位で、2021年には70万haとなり、有機農地の18.5%を占めます。砂糖や有機茶のような有機換金作物への需要は世界的に増加しています。中国とインドは、それぞれ最大の有機緑茶と有機紅茶の生産国です。国際的な需要の高まりにより、この地域の有機栽培面積は増加すると予想されます。
オーガニック製品への1人当たり支出はオーストラリアが圧倒的に多く、中国のオーガニック食品市場が大きく成長
- この地域のオーガニック製品に対する1人当たり支出は、2021年には85.1米ドルを記録しました。オーストラリアでは、オーガニック製品に対する一人当たり支出がより高く、同年には34.49米ドルでした。Global Organic Tradeのデータによると、オーストラリアの有機包装飲食品市場は、2021年には8億8,520万米ドルとなりました。
- 中国のオーガニック食品市場は2021年に13.3%成長し、2023~2029年にかけてのCAGRは7.1%と、プラス成長パターンが続くと予想されます。若い世代の間でオーガニック製品の重要性が重視されるようになり、また、母親の就労数の増加や健康とウェルネスの動向の採用増加によりオーガニックベビーフードの需要が高まっていることから、オーガニック製品は2025年までに64億米ドルの規模に達すると予想されます。
- インドのオーガニック製品は世界需要の1.0%に遠く及ばず、2021年の1人当たり支出額はわずか0.08米ドルです。しかし、インド市場は今後数年で成長し、2025年には1億5,330万米ドルに達する可能性があります。現在、この地域のオーガニック商品市場は非常にセグメント化されており、一部のスーパーマーケットや専門店だけがオーガニック商品を販売しています。消費者の知識の増大と購買パターンの変化によって、この地域の有機食品の持続可能性に対する理解が深まる可能性があります。1人当たり所得の増加と有機食品の重要性に対する消費者の意識の向上によって、アジア太平洋の有機食品に対する1人当たり支出が増加する可能性があります。
アジア太平洋のバイオ肥料産業概要
アジア太平洋のバイオ肥料市場はセグメント化されており、上位5社で30.04%を占めています。この市場の主要企業は、Biostadt India Limited、Gujarat State Fertilizers & Chemicals Ltd、Indian Farmers Fertiliser Cooperative Limited、Kiwa Bio-Tech、The Fertilizers、Chemicals Travancore Limitedなどです。
その他の特典
- エクセル形式の市場予測(ME)シート
- 3ヶ月のアナリストサポート
目次
第1章 エグゼクティブサマリーと主要調査結果
第2章 レポートのオファー
第3章 イントロダクション
- 調査の前提条件と市場定義
- 調査範囲
- 調査手法
第4章 主要産業動向
- 有機栽培面積
- 一人当たりのオーガニック製品への支出
- 規制の枠組み
- オーストラリア
- 中国
- インド
- インドネシア
- 日本
- フィリピン
- タイ
- ベトナム
- バリューチェーンと流通チャネル分析
第5章 市場セグメンテーション
- 形態
- アゾスピリラム
- アゾトバクタ
- 菌根菌
- リン酸可溶菌
- 根粒菌
- その他のバイオ肥料
- 作物タイプ
- 換金作物
- 園芸作物
- 畑作物
- 生産国
- オーストラリア
- 中国
- インド
- インドネシア
- 日本
- フィリピン
- タイ
- ベトナム
- その他のアジア太平洋
第6章 競合情勢
- 主要な戦略動向
- 市場シェア分析
- 企業情勢
- 企業プロファイル
- Atlantica Agricola
- Biolchim SpA
- Biostadt India Limited
- Gujarat State Fertilizers & Chemicals Ltd
- Indian Farmers Fertiliser Cooperative Limited
- IPL Biologicals Limited
- Kiwa Bio-Tech
- Sustane Natural Fertilizer Inc.
- Symborg Inc.
- The Fertilizers and Chemicals Travancore Limited
第7章 CEOへの主要戦略的質問
第8章 付録
- 世界概要
- 概要
- ファイブフォース分析フレームワーク
- 世界のバリューチェーン分析
- 市場力学(DROs)
- 情報源と参考文献
- 図表一覧
- 主要な洞察
- データパック
- 用語集
The Asia-Pacific Biofertilizer Market size is estimated at 0.75 billion USD in 2025, and is expected to reach 1.21 billion USD by 2030, growing at a CAGR of 10.04% during the forecast period (2025-2030).
- Biofertilizers are live microorganisms that promote plant nutrition by mobilizing or increasing nutrient availability in soils. Mycorrhiza, Azospirillum, Azotobacter, Rhizobium, and phosphate-solubilizing bacteria are the microorganisms most commonly utilized as biofertilizers in agriculture. The biofertilizer market in the region grew by 2.4% (CAGR) between 2017 and 2022 by value. However, the market value of biofertilizers is anticipated to increase by about 9.9% (CAGR) between 2023 and 2029.
- Among these biofertilizers, Azotobacter is the second most widely utilized in the Asia Pacific region, accounting for 24.6% of the market in 2022, with a value of USD 141.8 million. Azotobacter is a nitrogen-fixing bacterium that does not require symbiotic relationships to fix atmospheric nitrogen and make it available to plants. It is used as a biofertilizer for all non-leguminous plants, including rice, cotton, and vegetables.
- The consumption of biofertilizers is dominant in row crops, valued at about USD 479.1 million in 2022. The major row crops cultivated in the region include rice, wheat, barley, corn, and soybeans. The dominance of row crops is mainly due to their large organic cultivation area, which accounted for about 67.5% of the region's organic crop cultivation area in 2022.
- Government initiatives in various regional countries to promote organic or sustainable farming have increased in response to growing organic crop production and the rising demand for organic products in both domestic and international markets. These factors may have an impact on the market throughout the forecast period. The value of the Asia-Pacific biofertilizer market is anticipated to grow by about 9.9% (CAGR) between 2023 and 2029,.
- The organic area under cultivation in Asia-Pacific expanded significantly from 2017 to 2022, going from 3.1 million hectares to 3.8 million hectares, respectively. Owing to the growing demand for organically cultivated food in many Asia-Pacific countries. As a result, the Asia-Pacific biofertilizer market grew by 2.4% (CAGR) between 2017 and 2022.
- The second most popular biofertilizer in Asia-Pacific is Azotobacter, which accounted for 24.6% of the market in 2022, valued at USD 141.8 million. It can be used as a biofertilizer in agriculture to make crop production more sustainable through its ability to fix nitrogen and solubilize bacteria76
- Azotobacter as bioinoculants have been demonstrated to increase agricultural productivity by 10-12%, leading to the synthesis of significant amounts of biologically active compounds, including nicotinic acid, biotin, heteroauxins, vitamin B, and gibberellins, which support root development and mineral absorption. The majority of non-leguminous crops, including rice, wheat, millets, cotton, tomato, cabbage, mustard, and safflower, are recommended for Azotobacter use.
- China held 93.5% of the total biofertilizer market value in 2022, making it the dominant country in the region. Row crops dominated the Chinese biofertilizer market in 2022, accounting for 82.3%. Row crops held a major organic acreage in the country, which was 2.1 million hectares in 2022.
- Due to rising consumer interest in organic products, farmers have become more aware of the disadvantages of relying on agricultural chemical inputs and rising organic acreage. The demand for biofertilizers in Asia-Pacific is anticipated to increase between 2023 and 2029, with a CAGR of 8.6%.
Asia-Pacific Biofertilizer Market Trends
Growing government support in countries like China, India, Indonesia, and Australia, boosts organic farming in the region
- The area of organic agricultural land in Asia-Pacific was over 3.7 million ha in 2021, representing 26.4% of the global organic area, as per FiBL statistics. The organic area under cultivation grew by 19.3% between 2017-2022. As of 2020, the region had 1.83 million organic producers, with India topping the list with 1.3 million organic producers. China, India, Indonesia, and Australia are the major countries with large organic cultivation areas in the region. Government authorities in countries like China and India are constantly promoting organic agriculture to reduce reliance on chemical inputs for crop cultivation. For instance, India has implemented schemes like Paramparagat Krishi Vikas Yojana and the All India Network Programme on Organic Farming (AI-NPOF).
- In 2021, China accounted for a maximum share of 66.1%, with 2.5 million ha, followed by India, Indonesia, and Australia, with 19.3%, 1.5%, and 1.4%, respectively. The total organic land is divided into three crop types, namely row crops, horticultural crops, and cash crops. Row crops occupy a major share of organic agricultural land in the region, accounting for 67.5% share, i.e., 2.5 million ha in 2021. The major row crops grown in the region include paddy, wheat, pulses, soybeans, and millets.
- Cash crops held the second largest share, with 0.7 million ha in 2021, accounting for an 18.5% share of organic cropland. The demand for organic cash crops like sugar and organic tea is increasing worldwide. China and India are the largest organic green and black tea producers, respectively. The growing international demand is expected to increase the organic acreages in the region.
Per capita spending on organic product predominant in Australia and China's organic food market growing significantly
- The per capita spending on organic products in the region was recorded at USD 85.1 in 2021. Australia witnessed a higher per capita spending on organic products, with USD 34.49 in the same year, attributed to the higher demand due to consumers' perception of organic food as healthy. As per the Global Organic Trade data, the organic packaged food and beverage market in Australia was valued at USD 885.2 million in 2021.
- China's organic food market grew by 13.3% in 2021, and the positive growth pattern is expected to continue, with a CAGR of 7.1% between 2023 and 2029. With an increasing emphasis on the importance of organic products among the younger generation and the rising demand for organic baby food due to the growing number of mothers in the workforce and the increasing adoption of the health and wellness trend, organic products are expected to reach a value of USD 6.4 billion by 2025.
- Organic products in India represent far less than 1.0% of global demand, with a per capita expenditure of just USD 0.08 in 2021. However, the Indian market may grow over the coming years, reaching a value of USD 153.3 million by 2025. Currently, the region's organic goods market is highly fragmented, with just a few supermarkets and specialty stores selling them, as people from higher-income families are the only potential customers. Growing consumer knowledge and changing buying patterns may lead to a better understanding of organic food sustainability in the region. Increasing per capita income and increased consumer awareness of the importance of organic food can raise per capita expenditure on organic food items in the Asia-Pacific region.
Asia-Pacific Biofertilizer Industry Overview
The Asia-Pacific Biofertilizer Market is fragmented, with the top five companies occupying 30.04%. The major players in this market are Biostadt India Limited, Gujarat State Fertilizers & Chemicals Ltd, Indian Farmers Fertiliser Cooperative Limited, Kiwa Bio-Tech and The Fertilizers and Chemicals Travancore Limited (sorted alphabetically).
Additional Benefits:
- The market estimate (ME) sheet in Excel format
- 3 months of analyst support
TABLE OF CONTENTS
1 EXECUTIVE SUMMARY & KEY FINDINGS
2 REPORT OFFERS
3 INTRODUCTION
- 3.1 Study Assumptions & Market Definition
- 3.2 Scope of the Study
- 3.3 Research Methodology
4 KEY INDUSTRY TRENDS
- 4.1 Area Under Organic Cultivation
- 4.2 Per Capita Spending On Organic Products
- 4.3 Regulatory Framework
- 4.3.1 Australia
- 4.3.2 China
- 4.3.3 India
- 4.3.4 Indonesia
- 4.3.5 Japan
- 4.3.6 Philippines
- 4.3.7 Thailand
- 4.3.8 Vietnam
- 4.4 Value Chain & Distribution Channel Analysis
5 MARKET SEGMENTATION (includes market size in Value in USD and Volume, Forecasts up to 2030 and analysis of growth prospects)
- 5.1 Form
- 5.1.1 Azospirillum
- 5.1.2 Azotobacter
- 5.1.3 Mycorrhiza
- 5.1.4 Phosphate Solubilizing Bacteria
- 5.1.5 Rhizobium
- 5.1.6 Other Biofertilizers
- 5.2 Crop Type
- 5.2.1 Cash Crops
- 5.2.2 Horticultural Crops
- 5.2.3 Row Crops
- 5.3 Country
- 5.3.1 Australia
- 5.3.2 China
- 5.3.3 India
- 5.3.4 Indonesia
- 5.3.5 Japan
- 5.3.6 Philippines
- 5.3.7 Thailand
- 5.3.8 Vietnam
- 5.3.9 Rest of Asia-Pacific
6 COMPETITIVE LANDSCAPE
- 6.1 Key Strategic Moves
- 6.2 Market Share Analysis
- 6.3 Company Landscape
- 6.4 Company Profiles (includes Global Level Overview, Market Level Overview, Core Business Segments, Financials, Headcount, Key Information, Market Rank, Market Share, Products and Services, and Analysis of Recent Developments).
- 6.4.1 Atlantica Agricola
- 6.4.2 Biolchim SpA
- 6.4.3 Biostadt India Limited
- 6.4.4 Gujarat State Fertilizers & Chemicals Ltd
- 6.4.5 Indian Farmers Fertiliser Cooperative Limited
- 6.4.6 IPL Biologicals Limited
- 6.4.7 Kiwa Bio-Tech
- 6.4.8 Sustane Natural Fertilizer Inc.
- 6.4.9 Symborg Inc.
- 6.4.10 The Fertilizers and Chemicals Travancore Limited
7 KEY STRATEGIC QUESTIONS FOR AGRICULTURAL BIOLOGICALS CEOS
8 APPENDIX
- 8.1 Global Overview
- 8.1.1 Overview
- 8.1.2 Porter's Five Forces Framework
- 8.1.3 Global Value Chain Analysis
- 8.1.4 Market Dynamics (DROs)
- 8.2 Sources & References
- 8.3 List of Tables & Figures
- 8.4 Primary Insights
- 8.5 Data Pack
- 8.6 Glossary of Terms

