
アフリカのバイオ肥料:市場シェア分析、産業動向と統計、成長予測(2025年~2030年)
Africa Biofertilizer - Market Share Analysis, Industry Trends & Statistics, Growth Forecasts (2025 - 2030)- 発行日
- ページ情報
- 英文 151 Pages
- 納期
- 2~3営業日
- 商品コード
- 1687729
- カスタマイズ可能 お客様のご希望に応じて、既存データの加工や未掲載情報(例:国別セグメント)の追加などの対応が可能です。詳細はお問い合わせください。
- 適宜更新あり 本レポートは最新情報反映のため適宜更新し、内容構成変更を行う場合があります。ご検討の際はお問い合わせください。
- 翻訳ツール提供対象 PDF対応AI翻訳ツールの無料貸し出しサービスのご利用が可能です
概要
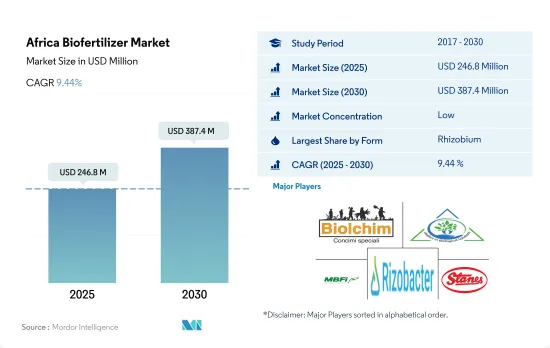
アフリカのバイオ肥料市場規模は、2025年には2億4,680万米ドルと推定され、2030年には3億8,740万米ドルに達すると予測され、予測期間(2025~2030年)のCAGRは9.44%で成長する見込みです。
- バイオ肥料は、土壌中の栄養分を動員したり利用性を高めたりして植物の栄養状態を改善する生きた微生物です。菌根菌、アゾスピリラム、アゾトバクター、リゾビウム、リン酸可溶化細菌は、農業でバイオ肥料として最も頻繁に使用される微生物です。
- これらのバイオ肥料の中で、リゾビウムはアフリカで最も広く使用されており、2022年には市場の45.6%を占め、8,750万米ドルと評価されています。根粒菌は、マメ科植物の根粒に生息し、植物と共生関係にある最も著名な窒素固定細菌です。
- アゾスピリラムは第2位の市場シェアを占め、2022年には4,380万米ドルと評価されました。アゾスピリラムベースのバイオ肥料は、植物が必要とする窒素の25~30%を代替することで、植物の生長を促進します。
- 耕作作物がバイオ肥料市場を独占し、2022年には約1億4,680万米ドルで消費シェアの76.5%を占め、次いで園芸作物で3,050万米ドルとなりました。連作作物におけるバイオ肥料の市場規模は絶えず拡大しています。2017~2021年の間に約17.8%増加しました。予測期間終了時には約69.6%増加し、2億7,000万米ドルに達すると予測されています。
- バイオ肥料を適用することで、化学窒素肥料の使用量を減らし、栽培コスト全体を削減することができます。国内と国際市場で有機製品に対する需要が増加しているため、この地域のバイオ肥料の需要を牽引しています。
- エジプト、ナイジェリア、南アフリカなど多くのアフリカ諸国で有機栽培食品の需要が伸びているため、アフリカはバイオ肥料の重要な市場となっています。過去の期間(2017~2022年)において、同地域の有機栽培面積は2017年の110万ヘクタールから2022年には130万ヘクタールへとわずかに拡大しました。同期間中、アフリカのバイオ肥料市場は6.9%成長しました。この地域では、トウモロコシ、小麦、うもろこしなどの主要穀物が生産されています。
- 根粒菌はアフリカ諸国で最も頻繁に使用されるバイオ肥料であり、2022年には市場の45.6%を占め、8,760万米ドルの価値があります。根粒菌は最も著名な窒素固定細菌で、マメ科植物の根粒に存在し、植物と共生関係にあります。
- その他のアフリカ諸国では、面積ベースで、チュニジアが2021年に地域最大の有機生産国となりました。チュニジアで栽培されている250の有機製品カテゴリーのうち約60が輸出されており、そのほとんどはオリーブオイルだが、デーツ、芳香・薬草、一部の野菜や果物も輸出されています。チュニジアは、その小さな国土にもかかわらず、有機農業の認証面積で世界第30位、アフリカ第1位です。
- 有機農業面積の主要国は、エジプトと南アフリカで、それぞれ4万5,100ヘクタールと1万2,600ヘクタールで、合わせて5.0%を占めています。しかし、その他のアフリカ地域は120万ヘクタールで、アフリカの有機農業総面積の95.0%を占めています。
- 有機製品に対する消費者の関心の高まりにより、バイオ肥料の需要は予測期間中に増加すると予想されます。農業従事者は、農業において化学投入物に頼ることのデメリットを認識するようになり、有機栽培面積を増やしており、これも市場を牽引する可能性があります。
アフリカのバイオ肥料市場動向
この地域の有機農業セクターには83万4,000の有機生産者がおり、チュニジアの方が有機農地が多いです。
- アフリカの有機農業には認証農業と非認証農業の2つの形態があります。アフリカでは有機農地の0.2%しか認証を受けていないです。しかし、ほとんどの有機農業従事者は認証を受けていないです。認証農業従事者の多くは輸出を目的としており、その大半はアフリカ最大の農産物市場である欧州連合(EU)に輸出されています。一方、非認証の有機農業従事者は自国での販売を目的としています。2022年、アフリカの有機農地面積は120万haを超え、世界の有機農地面積の9.0%を占めました。
- アフリカ地域の主要有機作物には、ナッツ、オリーブ、コーヒー、ココア、油糧種子、綿花などがあります。換金作物が有機農地の大部分を占め、2022年には81万7,400haで63.2%を占めました。連作作物は有機農地面積の第2位、すなわち約25.6%を占め、同年の面積は33万1,200ヘクタールでした。園芸作物は有機栽培面積の11.2%を占め、2022年には14万4,900ヘクタールでした。
- 2020年には、アフリカの有機生産者は83万4,000人近くになります。有機生産者が最も多い国は、エチオピア(約22万人)、タンザニア(約14万9,000人)、ウガンダ(13万9,000人以上)です。
- 面積では、チュニジアの有機栽培面積が最大です(2020年には29万ha以上)。島国のサントメ・プリンシペは、有機農業に割かれている土地の割合がこの地域で最も高く、20.7%です。
一人当たりの有機製品への支出は、エジプト、南アフリカ、ナイジェリア諸国で多いです。
- アフリカの1人当たり所得は一貫して増加しており、人々は栄養価の高い食品により多くの支出をするようになっています。この地域では、有機食品と飲食品がより多くの棚に並ぶようになっています。
- アフリカでは、特にエジプト、南アフリカ、ナイジェリアで有機製品の消費が大幅に増加しました。2021年には、オーガニック製品の1人当たり消費額はエジプトで55.5米ドル、次いで南アフリカで7.1米ドルでした。アフリカの中では、ウガンダが有機農業をいち早く取り入れ、有機製品の重要な生産・輸出国としての地位を確立することに成功しました。
- アフリカ地域で一般的に消費されている有機製品は、生鮮野菜と果物です。有機農業を施策、国の普及システム、マーケティング、バリューチェーン開拓の主流とし、消費者の注目を集めるために多大な努力が払われてきました。
- フルーツジュースを中心とする飲料の一人当たり消費量の増加、健康意識の高まり、化学成分を含まない有機飲食品への消費者のシフトに伴い、有機食品の需要は2023~2029年の間に増加すると予想されます。
- 現在、有機食品が食品産業に占める割合は小さいが、アフリカの消費者の間では人気が高まっています。しかし、所得水準の低さ、有機基準の欠如、地域市場認証のためのその他のインフラが、この地域の有機食品市場の成長を抑制する可能性があります。
アフリカのバイオ肥料産業概要
アフリカのバイオ肥料市場はセグメント化されており、上位5社で2.49%を占めています。この市場の主要企業は、 Biolchim SPA、IPL Biologicals Limited、Microbial Biological Fertilizers International、Rizobacter、T. Stanes and Company Limitedなどです。
その他の特典
- エクセル形式の市場予測(ME)シート
- 3ヶ月のアナリストサポート
目次
第1章 エグゼクティブサマリーと主要調査結果
第2章 レポートのオファー
第3章 イントロダクション
- 調査の前提条件と市場定義
- 調査範囲
- 調査手法
第4章 主要産業動向
- 有機栽培面積
- 一人当たりのオーガニック製品への支出
- 規制の枠組み
- エジプト
- イラン
- ナイジェリア
- 南アフリカ
- バリューチェーンと流通チャネル分析
第5章 市場セグメンテーション
- 形態
- アゾスピリラム
- アゾトバクター
- 菌根菌
- リン酸可溶菌
- 根粒菌
- その他のバイオ肥料
- 作物タイプ
- 換金作物
- 園芸作物
- 畑作物
- 生産国
- エジプト
- ナイジェリア
- 南アフリカ
- その他のアフリカ
第6章 競合情勢
- 主要な戦略動向
- 市場シェア分析
- 企業情勢
- 企業プロファイル.
- Atlantica Agricola
- Biolchim SPA
- IPL Biologicals Limited
- Mapleton Agri BIoTec Pt. Ltd
- Microbial Biological Fertilizers International
- Rizobacter
- T. Stanes and Company Limited
- Valent Biosciences LLC
- Vegalab SA
第7章 CEOへの主要戦略的質問
第8章 付録
- 世界概要
- 概要
- ファイブフォース分析フレームワーク
- 世界のバリューチェーン分析
- 市場力学(DROs)
- 情報源と参考文献
- 図表一覧
- 主要洞察
- データパック
- 用語集
目次
The Africa Biofertilizer Market size is estimated at 246.8 million USD in 2025, and is expected to reach 387.4 million USD by 2030, growing at a CAGR of 9.44% during the forecast period (2025-2030).
- Biofertilizers are living microorganisms that improve plant nutrition by mobilizing or increasing nutrient availability in soils. Mycorrhiza, Azospirillum, Azotobacter, Rhizobium, and phosphate-solubilizing bacteria are the most frequent microorganisms used as biofertilizers in agriculture.
- Among these biofertilizers, Rhizobium is most widely used in Africa, accounting for 45.6% of the market in 2022 and valued at USD 87.5 million. Rhizobium is the most prominent nitrogen-fixing bacteria that live in the root nodules of leguminous plants and has a symbiotic relationship with plants.
- Azospirillum accounted for the second-largest market share, valued at USD 43.8 million in 2022. Azospirillum-based biofertilizers promote plant vegetative growth by substituting 25-30% of plant nitrogen requirements.
- Row crops dominated the biofertilizer market, valued at about USD 146.8 million and accounting for 76.5% of the consumption share in 2022, followed by horticultural crops, valued at USD 30.5 million. The market value of biofertilizers in row crops is constantly expanding. It increased by about 17.8% between 2017 and 2021. It is anticipated to increase by about 69.6% by the end of the forecast period, reaching USD 270.0 million.
- The application of biofertilizers can reduce the use of chemical nitrogen fertilizers and the overall cost of cultivation. The demand for organic products in domestic and international markets is increasing, thus driving the demand for biofertilizers in the region.
- As the demand for organically cultivated food grows in many African countries such as Egypt, Nigeria, and South Africa, Africa is a significant market for biofertilizers. During the historical period (2017-2022), the region's organically cultivated area expanded slightly, from 1.1 million hectares in 2017 to 1.3 million hectares in 2022. During the same period, the African biofertilizer market grew by 6.9%. Major cereal crops are produced in the region, like maize, wheat, and corn.
- Rhizobium is the most often used biofertilizer in African countries, accounting for 45.6% of the market in 2022 and worth USD 87.6 million. Rhizobium is the most prominent nitrogen-fixing bacterium that resides in the root nodules of leguminous plants and has a symbiotic connection with plants.
- In the Rest of Africa, in terms of area, Tunisia was the region's largest organic producer in 2021. Around 60 of the 250 organic product categories cultivated in Tunisia are exported, mostly olive oil, but also dates, aromatic and medicinal herbs, and certain vegetables and fruits. Tunisia ranks 30th in the world and first in Africa in terms of organic farming area certification, despite its small size.
- The major countries with organic agricultural acreage include Egypt and South Africa accounting for 5.0% together, with 45.1 thousand hectares and 12.6 thousand hectares, respectively. However, the Rest of Africa accounted for 95.0% of total organic agricultural acreage in Africa, with 1.2 million hectares.
- The demand for biofertilizers is expected to rise during the forecast period owing to rising consumer interest in organic products. Farmers are becoming more aware of the disadvantages of relying on chemical inputs in agriculture and increasing organic acreage, which may also drive the market.
Africa Biofertilizer Market Trends
8,34,000 organic producers are in the region's organic sector with Tunisia is having more organic land
- Organic farming takes two forms in Africa: certified and uncertified. Only 0.2% of organic agricultural land may be certified in Africa. However, most organic farmers are not certified. Many certified farmers aim to export their products, with the majority being exported to the European Union, Africa's largest agricultural market. In contrast, non-certified organic farmers aim to sell their produce from home. In 2022, the area of organic agricultural land in Africa was over 1.2 million ha, representing 9.0% of the total organic agricultural area worldwide.
- In the African region, key organic crops include nuts, olives, coffee, cocoa, oilseeds, and cotton. Cash crops occupied a major share of organic agricultural land, accounting for 63.2% in 2022, with 817.4 thousand hectares. Row crops held the second-largest share of organic acreage, i.e., about 25.6%, accounting for 331.2 thousand hectares in the same year. Horticultural crops accounted for 11.2% of the organic acreage, with 144.9 thousand ha in 2022.
- In 2020, there were nearly 834,000 organic producers in Africa. The countries with the highest number of organic producers were Ethiopia (almost 220,000), Tanzania (nearly 149,000), and Uganda (over 139,000).
- In terms of area, Tunisia has the largest organic area under cultivation (more than 290,000 ha in 2020). The island state of Sao Tome and Principe has the region's highest percentage of land devoted to organic farming, i.e., 20.7%.
Per capita spending on organic product predominant in Egypt, South Africa, and Nigeria countries
- Africa's per capita income is consistently increasing, encouraging people to spend more on nutritious food. Organic foods and beverages are gaining more shelf space in the region.
- In Africa, consumption of organic products increased significantly, especially in Egypt, South Africa, and Nigeria. In 2021, the per capita consumption of organic products accounted for USD 55.5 in Egypt, followed by South Africa with USD 7.1. Within Africa, Uganda was an early adopter of organic farming and successfully established itself as a significant producer and exporter of organic products.
- In the African region, the commonly consumed organic products include fresh vegetables and fruits. Significant efforts have been made to mainstream organic agriculture into policy, national extension systems, marketing, and value chain development, thus gaining consumer attention.
- With the increasing per capita consumption of beverages, primarily fruit juices, growing health awareness, and consumers shifting toward organic food and drinks that do not contain chemical ingredients, the demand for organic food is expected to increase between 2023 and 2029.
- Though organic foods currently account for a small portion of the food industry, they are gaining popularity among African consumers. However, low income levels, lack of organic standards, and other infrastructure for local market certification may restrain the growth of the organic food market in the region.
Africa Biofertilizer Industry Overview
The Africa Biofertilizer Market is fragmented, with the top five companies occupying 2.49%. The major players in this market are Biolchim SPA, IPL Biologicals Limited, Microbial Biological Fertilizers International, Rizobacter and T. Stanes and Company Limited (sorted alphabetically).
Additional Benefits:
- The market estimate (ME) sheet in Excel format
- 3 months of analyst support
TABLE OF CONTENTS
1 EXECUTIVE SUMMARY & KEY FINDINGS
2 REPORT OFFERS
3 INTRODUCTION
- 3.1 Study Assumptions & Market Definition
- 3.2 Scope of the Study
- 3.3 Research Methodology
4 KEY INDUSTRY TRENDS
- 4.1 Area Under Organic Cultivation
- 4.2 Per Capita Spending On Organic Products
- 4.3 Regulatory Framework
- 4.3.1 Egypt
- 4.3.2 Iran
- 4.3.3 Nigeria
- 4.3.4 South Africa
- 4.4 Value Chain & Distribution Channel Analysis
5 MARKET SEGMENTATION (includes market size in Value in USD and Volume, Forecasts up to 2030 and analysis of growth prospects)
- 5.1 Form
- 5.1.1 Azospirillum
- 5.1.2 Azotobacter
- 5.1.3 Mycorrhiza
- 5.1.4 Phosphate Solubilizing Bacteria
- 5.1.5 Rhizobium
- 5.1.6 Other Biofertilizers
- 5.2 Crop Type
- 5.2.1 Cash Crops
- 5.2.2 Horticultural Crops
- 5.2.3 Row Crops
- 5.3 Country
- 5.3.1 Egypt
- 5.3.2 Nigeria
- 5.3.3 South Africa
- 5.3.4 Rest of Africa
6 COMPETITIVE LANDSCAPE
- 6.1 Key Strategic Moves
- 6.2 Market Share Analysis
- 6.3 Company Landscape
- 6.4 Company Profiles (includes Global Level Overview, Market Level Overview, Core Business Segments, Financials, Headcount, Key Information, Market Rank, Market Share, Products and Services, and Analysis of Recent Developments).
- 6.4.1 Atlantica Agricola
- 6.4.2 Biolchim SPA
- 6.4.3 IPL Biologicals Limited
- 6.4.4 Mapleton Agri Biotec Pt. Ltd
- 6.4.5 Microbial Biological Fertilizers International
- 6.4.6 Rizobacter
- 6.4.7 T. Stanes and Company Limited
- 6.4.8 Valent Biosciences LLC
- 6.4.9 Vegalab SA
7 KEY STRATEGIC QUESTIONS FOR AGRICULTURAL BIOLOGICALS CEOS
8 APPENDIX
- 8.1 Global Overview
- 8.1.1 Overview
- 8.1.2 Porter's Five Forces Framework
- 8.1.3 Global Value Chain Analysis
- 8.1.4 Market Dynamics (DROs)
- 8.2 Sources & References
- 8.3 List of Tables & Figures
- 8.4 Primary Insights
- 8.5 Data Pack
- 8.6 Glossary of Terms
- 発行日
- 発行
- Mordor Intelligence
- ページ情報
- 英文 151 Pages
- 納期
- 2~3営業日