
|
市場調査レポート
商品コード
1693767
インドのバイオ肥料:市場シェア分析、産業動向と統計、成長予測(2025年~2030年)India Biofertilizer - Market Share Analysis, Industry Trends & Statistics, Growth Forecasts (2025 - 2030) |
||||||
カスタマイズ可能
適宜更新あり
|
|||||||
| インドのバイオ肥料:市場シェア分析、産業動向と統計、成長予測(2025年~2030年) |
|
出版日: 2025年03月18日
発行: Mordor Intelligence
ページ情報: 英文 135 Pages
納期: 2~3営業日
|

全表示
- 概要
- 目次
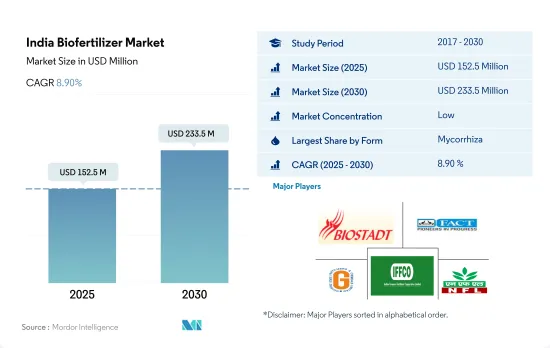
インドのバイオ肥料市場規模は、2025年には1億5,250万米ドルと推定され、2030年には2億3,350万米ドルに達すると予測され、予測期間中(2025~2030年)のCAGRは8.90%で成長する見込みです。
- バイオ肥料は、植物の成長を促進する生きた微生物を含む有機物質です。インドのバイオ肥料市場額は2017~2021年にかけて約11.0%増加したが、これは農業従事者の意識の高まり、インドにおける登録有機農場全体の増加、有機栽培またはサステイナブル方法で栽培された商品に対する需要の変化など、さまざまな理由に起因すると考えられます。インドは、2021年現在、世界の有機農業用地では第5位、生産者総数では第1位です。
- 菌根菌ベースのバイオ肥料が市場を独占し、2022年の市場規模は5,750万米ドルとなりました。これは主に、菌根菌が土壌からのリン、その他の栄養素、水の吸収を促進する能力を保持し、植物の成長と開発をサポートし、収量を増加させるためです。また、植物が不利な土壌条件と戦うのを助ける。しかし、根粒菌とアゾスピリラムをベースとしたバイオ肥料の市場規模は、他のバイオ肥料と比較してより速い速度で成長すると予想されています。
- バイオ肥料の消費は連作作物で支配的であり、2022年の市場金額の約88.5%を占めています。連作作物が優勢なのは、主に国内での栽培面積が大きいためで、同年の有機作物総面積の約59.8%を占めています。
- 国内市場でも国際市場でも有機製品に対する需要は大きいです。化学肥料の過剰使用は、インドにおける大きな課題のひとつです。インド政府は、バイオ肥料にインセンティブを与えることで、様々な制度やプログラムを通じてサステイナブル有機栽培を推進しており、これが2023~2029年にかけての市場を牽引すると考えられます。
インドのバイオ肥料市場動向
有機栽培生産者の増加が、主に連作作物における有機栽培面積の増加を後押し
- インドは、認定有機生産者の総数では世界最大の国であり、2019年には130万人の有機生産者がいます。多くの有機生産者がいるにもかかわらず、同国の有機栽培面積は同国の農業総面積の2.0%程度です。2021年には、同国の有機栽培面積は711,094.0ヘクタールと記録され、2017年と比較して約3.4%増加しました。国内の有機農業は一部の州に集中しています。国内の有機農業上位10州が有機作物総面積の約80.0%を占めています。マディヤ・プラデシュ州、ラジャスタン州、マハラシュトラ州のように、有機農業の普及率向上でリードしている州は少数です。マディヤ・プラデシュ州だけで2019年のインドの有機栽培面積の約27.0%を占めています。
- 同国では連作作物の有機栽培が優勢で、2021年には有機作物総栽培面積の約59.7%を占めました。穀物生産は米、小麦、雑穀、トウモロコシが主です。ほとんどの穀類作物はカリフ期(6月~9月)に栽培されます。この時期に栽培される作物は、主に雨に左右されるか、稲、トウモロコシ、綿花、大豆のように多くの水を必要とします。
- 有機換金作物全体の栽培面積は、2017年の27万ヘクタールから2021年には28万ヘクタールに増加します。同国で生産される主要換金作物は、綿花、サトウキビ、紅茶、スパイスです。同国では現在、有機園芸作物の成長は限られています。有機製品に対する需要の高まりとインド政府の有機栽培への取り組みにより、2023~2029年にかけて有機作物の栽培面積が増加すると予想されます。
需要の高まりとeコマースチャネルによる入手の容易さにより、有機食品への1人当たり支出が増加
- インドのオーガニック製品に対する1人当たり支出は0.23米ドルと、アジア太平洋のオーガニック製品に対する1人当たり支出の平均と比べると比較的低いです。しかし近年は、オーガニック製品は免疫力が高く、品質が高く、eコマースチャネルを通じて入手しやすいと認識する顧客が増えたため、消費者の需要がオーガニック製品へとシフトしています。インドは有機食品と飲食品の有望な市場です。インド国内の有機飲食品産業は、2019~2024年にかけてCAGR13%で上昇し、2024年までに1億3,800万米ドルの規模になると予想されています。
- 2022年に国内で消費された有機飲食品の合計は1億800万米ドル相当でした。同国における有機製品の消費額は、2016年の4,500万米ドルから2021年には9,600万米ドルに増加しました。オーガニック食品の販売動向は、主に消費者意識の高まりにより増加傾向にあり、高所得の消費者がオーガニック飲食品の消費を促進しています。最も需要を獲得したカテゴリーには、有機卵、乳製品、果物・野菜などの必須食品が含まれます。
- 有機飲料消費が市場を独占し、2022年の有機食品と有機飲料の合計市場金額の約85.2%を占めました。有機飲料セグメントには、承認された認証機関によって認証された有機包装飲食品が含まれます。有機飲料の消費額は2020~2022年にかけてCAGR 14%で増加しました。有機製品に関連する価格プレミアムは、低所得層の消費者のアクセスを妨げ、有機食品消費の主要制限要因となっています。しかし、有機製品の積極的な販売促進と利点が、予測期間中の有機食品市場を牽引します。
インドのバイオ肥料産業概要
インドのバイオ肥料市場はセグメント化されており、上位5社で6.19%を占めています。この市場の主要企業は、Biostadt India Limited、Fertilizers、Chemicals Travancore Limited、Gujarat State Fertilizers & Chemicals Ltd、Indian Farmers Fertiliser Cooperative Limited、National Fertilizers Limitedなどです。
その他の特典
- エクセル形式の市場予測(ME)シート
- 3ヶ月のアナリストサポート
目次
第1章 エグゼクティブサマリーと主要調査結果
第2章 レポートのオファー
第3章 イントロダクション
- 調査の前提条件と市場定義
- 調査範囲
- 調査手法
第4章 主要産業動向
- 有機栽培面積
- 一人当たりのオーガニック製品への支出
- 規制の枠組み
- インド
- バリューチェーンと流通チャネル分析
第5章 市場セグメンテーション
- 形態
- アゾスピリラム
- アゾトバクタ
- 菌根菌
- リン酸可溶菌
- 根粒菌
- その他のバイオ肥料
- 作物タイプ
- 換金作物
- 園芸作物
- 畑作物
第6章 競争情勢
- 主要な戦略的動き
- 市場シェア分析
- 企業情勢
- 企業プロファイル
- Biostadt India Limited
- Fertilizers and Chemicals Travancore Limited
- GrowTech Agri Science Private Limited
- Gujarat State Fertilizers & Chemicals Ltd
- Indian Farmers Fertiliser Cooperative Limited
- IPL Biologicals Limited
- Madras Fertilizers Limited
- National Fertilizers Limited
- Samriddhi Crops India Pvt. Ltd
- T.Stanes and Company Limited
第7章 CEOへの主要戦略的質問
第8章 付録
- 世界概要
- 概要
- ファイブフォース分析フレームワーク
- 世界のバリューチェーン分析
- 市場力学(DROs)
- 情報源と参考文献
- 図表一覧
- 主要な洞察
- データパック
- 用語集
The India Biofertilizer Market size is estimated at 152.5 million USD in 2025, and is expected to reach 233.5 million USD by 2030, growing at a CAGR of 8.90% during the forecast period (2025-2030).
- Biofertilizers are organic substances with living microorganisms that promote plant growth. The Indian biofertilizer market value increased by about 11.0% between 2017 to 2021, which can be attributed to various reasons like the increasing awareness among farmers, the increasing overall registered organic farms in India, and a shift in demand for organically or sustainably grown commodities. India ranks fifth in terms of world organic agriculture land and first in terms of the total number of producers as of 2021.
- Mycorrhizal-based biofertilizers dominated the market, which was valued at USD 57.5 million in 2022. This is mainly due to the mycorrhizal association holding the ability to boost phosphorus, other nutrients, and water absorption from the soil, supporting plant growth and development and increasing yield. It also helps the plant fight against adverse soil conditions. However, Rhizobium and Azospirillum-based biofertilizer market values are anticipated to grow at faster rates compared to other biofertilizers.
- The consumption of biofertilizers is dominant in row crops, and it accounted for about 88.5% of the market value in 2022. The dominance of row crops is mainly due to their large cultivation area in the country, which accounted for about 59.8% of the total organic crop area in the same year.
- There is a huge demand for organic products both in domestic and international markets. The overuse of chemical fertilizers is one of the major challenges in the country. The Indian government is promoting sustainable or organic cultivation practices through various schemes or programs by providing incentives for biofertilizers, which would drive the market between 2023 and 2029.
India Biofertilizer Market Trends
Growing number of organic producers helping the increase in area under organic cultivation, primarily in row crops
- India is the largest country, in terms of the total number of certified organic producers in the world, with 1.3 million organic producers in 2019. Despite having a large number of organic producers, organic cultivation areas in the country account for around 2.0% of the total agriculture area in the country. In 2021, the organic area in the country was recorded as 711,094.0 hectares, which increased by about 3.4% compared to 2017. Organic farming in the country is concentrated in only a few states. The top ten organic farming states in the country account for about 80.0% of the total organic crop area. A few states have taken the lead in improving organic farming coverage, like Madhya Pradesh, Rajasthan, and Maharashtra, which are the top three organic farming states in the country. Madhya Pradesh alone accounted for about 27.0% of India's total organic cultivation area in 2019.
- Organic cultivation of row crops is dominant in the country, which accounted for about 59.7% of the total organic crop area in 2021. Cereal crop production is dominant rice, wheat, millet, and maize are the major cereals produced. Most cereal crops are grown in the kharif season (June - September). The crops grown in this season are mainly rain dependent or require more water, like rice, maize, cotton, and soybean.
- The overall organic cash crop cultivation area increased from 0.27 million hectares in 2017 to 0.28 million hectares in 2021. The major cash crops produced in the country are cotton, sugarcane, tea, and spices. There is a limited growth of organic horticultural crops currently in the country. The increasing demand for organic products and Indian government initiatives to go organic are anticipated to increase organic crop area between 2023 and 2029.
Growing demand and their easy accessibility through e-commerce channels, rising the per capita spending on organic food
- India's per capita spending on organic products is relatively low at USD 0.23 compared to the average per capita spending on organic products in Asia-Pacific. However, in recent years, shifting consumer demand has increased toward organic products as more customers perceive these items offer better immunity, higher quality, and more accessibility through e-commerce channels. India is a promising and developing market for organic foods and beverages. India's domestic organic food and beverage industry is expected to be worth USD 138.0 million by 2024, rising at a compound annual growth rate of 13% between 2019 to 2024.
- In 2022, the total combined organic food and beverages worth USD 108.0 million consumed in the country. The consumption value of organic products in the country increased from USD 45 million in 2016 to USD 96.0 million in 2021. Organic food sales have seen an increasing trend mainly due to increasing consumer awareness, and high-income consumers are propelling organic food and beverage consumption. Categories that gained the most demand included essential foods, such as organic eggs, dairy, and fruits and vegetables.
- Organic beverage consumption dominated the market and accounted for about 85.2% of the total combined organic food and beverages market value in 2022. The organic beverages segment includes organic packaged food and beverages that are certified by the approved certification body. Organic beverage consumption value increased at a CAGR of 14% between 2020 to 2022. The price premium associated with organic products hampers lower-income consumer access and is the major limiting factor for organic food consumption. However, organic products' active promotion and advantages drive the organic food market during the forecast period.
India Biofertilizer Industry Overview
The India Biofertilizer Market is fragmented, with the top five companies occupying 6.19%. The major players in this market are Biostadt India Limited, Fertilizers and Chemicals Travancore Limited, Gujarat State Fertilizers & Chemicals Ltd, Indian Farmers Fertiliser Cooperative Limited and National Fertilizers Limited (sorted alphabetically).
Additional Benefits:
- The market estimate (ME) sheet in Excel format
- 3 months of analyst support
TABLE OF CONTENTS
1 EXECUTIVE SUMMARY & KEY FINDINGS
2 REPORT OFFERS
3 INTRODUCTION
- 3.1 Study Assumptions & Market Definition
- 3.2 Scope of the Study
- 3.3 Research Methodology
4 KEY INDUSTRY TRENDS
- 4.1 Area Under Organic Cultivation
- 4.2 Per Capita Spending On Organic Products
- 4.3 Regulatory Framework
- 4.3.1 India
- 4.4 Value Chain & Distribution Channel Analysis
5 MARKET SEGMENTATION (includes market size in Value in USD and Volume, Forecasts up to 2030 and analysis of growth prospects)
- 5.1 Form
- 5.1.1 Azospirillum
- 5.1.2 Azotobacter
- 5.1.3 Mycorrhiza
- 5.1.4 Phosphate Solubilizing Bacteria
- 5.1.5 Rhizobium
- 5.1.6 Other Biofertilizers
- 5.2 Crop Type
- 5.2.1 Cash Crops
- 5.2.2 Horticultural Crops
- 5.2.3 Row Crops
6 COMPETITIVE LANDSCAPE
- 6.1 Key Strategic Moves
- 6.2 Market Share Analysis
- 6.3 Company Landscape
- 6.4 Company Profiles (includes Global Level Overview, Market Level Overview, Core Business Segments, Financials, Headcount, Key Information, Market Rank, Market Share, Products and Services, and Analysis of Recent Developments).
- 6.4.1 Biostadt India Limited
- 6.4.2 Fertilizers and Chemicals Travancore Limited
- 6.4.3 GrowTech Agri Science Private Limited
- 6.4.4 Gujarat State Fertilizers & Chemicals Ltd
- 6.4.5 Indian Farmers Fertiliser Cooperative Limited
- 6.4.6 IPL Biologicals Limited
- 6.4.7 Madras Fertilizers Limited
- 6.4.8 National Fertilizers Limited
- 6.4.9 Samriddhi Crops India Pvt. Ltd
- 6.4.10 T.Stanes and Company Limited
7 KEY STRATEGIC QUESTIONS FOR AGRICULTURAL BIOLOGICALS CEOS
8 APPENDIX
- 8.1 Global Overview
- 8.1.1 Overview
- 8.1.2 Porter's Five Forces Framework
- 8.1.3 Global Value Chain Analysis
- 8.1.4 Market Dynamics (DROs)
- 8.2 Sources & References
- 8.3 List of Tables & Figures
- 8.4 Primary Insights
- 8.5 Data Pack
- 8.6 Glossary of Terms
