
|
市場調査レポート
商品コード
1693757
欧州のバイオ肥料:市場シェア分析、産業動向、成長予測(2025年~2030年)Europe Biofertilizer - Market Share Analysis, Industry Trends & Statistics, Growth Forecasts (2025 - 2030) |
||||||
カスタマイズ可能
適宜更新あり
|
|||||||
| 欧州のバイオ肥料:市場シェア分析、産業動向、成長予測(2025年~2030年) |
|
出版日: 2025年03月18日
発行: Mordor Intelligence
ページ情報: 英文 177 Pages
納期: 2~3営業日
|

全表示
- 概要
- 目次
概要
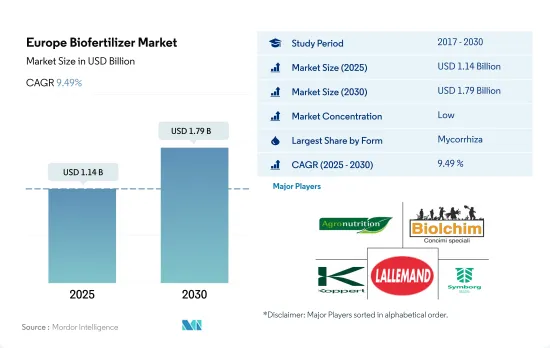
欧州のバイオ肥料市場規模は2025年に11億4,000万米ドルと推定・予測され、2030年には17億9,000万米ドルに達し、予測期間中(2025~2030年)にCAGR 9.49%で成長すると予測されています。
- バイオ肥料は生きた微生物であり、土壌中の養分利用可能性を動員または増加させることによって、植物の栄養を強化することができます。農業でバイオ肥料として使用される最も一般的な微生物は、菌根菌、アゾスピリラム、アゾトバクタ、リゾビウム、リン酸可溶化細菌などです。
- これらのバイオ肥料のうち、菌根菌は欧州で最も多く使用されており、2022年の市場シェアは62.8%、金額は5億4,950万米ドルでした。菌根菌は、植物の根系と共生関係を築く菌類です。菌根菌は植物の根の表面積を増やし、栄養分の吸収を促進します。
- 根粒菌は植物と共生関係にある最も重要な窒素固定細菌で、マメ科植物の根粒に生息しています。根粒菌はこの地域で2番目に消費量の多いバイオ肥料で、2022年には13.2%のシェアを占めます。
- 根粒菌の微生物活動によって、さまざまなマメ科作物で年間1ヘクタールあたり40~250kgの窒素が固定されることがわかっています。EUは、マメ科作物の栽培面積を拡大することで、サステイナブル植物性タンパク質生産への移行を計画しています。この動きは、根粒菌市場を牽引する可能性があります。
- アゾスピリラムとアゾトバクタは、自由生活性の窒素固定細菌で、大気中の窒素を固定し、非共生的に植物に利用できるようにすることができます。生物学的窒素固定は土壌肥沃度と作物生産性に貢献します。食糧生産への需要が増加しているため、欧州でのアゾトバクタの利用は拡大すると予想されています。
- 欧州の生物肥料市場は、主にドイツ、フランス、イタリアなどの国々で有機栽培食品に対する需要が増加していることを背景に、近年大きな成長を遂げています。2017~2022年にかけて、この地域の有機栽培面積は490万ヘクタールから730万ヘクタールに増加し、バイオ肥料市場は28.1%増加しました。
- 欧州における有機農法の成長を支援するため、欧州委員会は2021年、加盟国の有機栽培面積を2030年までに同地域の農地面積の25.0%に拡大する行動計画を発表しました。これを受けて、域内の政府は有機農業従事者への補助金を支給し、農業予算を有機農法の推進に振り向けています。
- 例えば2022年、ドイツ政府は354億6,000万米ドルの予算で有機農業従事者への補助金を計画し、イタリア政府は有機農業推進のための国家戦略計画を通じて35億4,000万米ドルを投資しました。イタリアは、2027年までに農地の25.0%を有機農業に転換することを目指しており、欧州委員会が設定した目標より3年早いです。
- 市場消費の面では、2022年の植物バイオ肥料のシェアはフランスが21.1%で欧州最大の市場であり、次いでイタリアが15.8%、スペインが10.5%でした。
- 欧州のバイオ肥料市場の成長は、有機農法の人気の高まりと、よりサステイナブル農法への移行を推進する政府のイニシアティブの高まりにより、今後も続くと予想されます。
欧州のバイオ肥料市場の動向
欧州のグリーンディールは有機栽培の増加に大きく寄与しており、イタリアは有機栽培の最大面積を占めています。
- 欧州諸国では有機農業の推進が進んでおり、有機栽培に分類される土地の量は過去10年間で大幅に増加しています。2021年3月、欧州委員会は、2030年までに農地の25%を有機農業にするという欧州グリーンディール目標を達成するため、有機行動計画を開始しました。オーストリア、イタリア、スペイン、ドイツは、欧州における有機栽培の主要国のひとつです。イタリアは農地面積の15.0%を有機栽培しており、EU平均の7.5%を上回っています。
- 2021年には、EUの有機栽培地は1,470万ヘクタールと記録されました。農業生産面積は、耕地作物(主に穀物、根菜類、生鮮野菜)、永続的草地、永続的作物の3つの主要な利用タイプに分けられます。2021年の有機耕地面積は650万ヘクタールで、EU全体の有機農業面積の46%に相当します。
- EUにおける穀物、油糧種子、タンパク質作物、豆類の有機栽培面積は、2017~2021年の間に32.6%増加し、160万ヘクタールを超えました。130万ヘクタールで生産されている多年生作物は、2020年には有機栽培地の15%を占めます。オリーブ、ブドウ、アーモンド、柑橘類はこのグループに属する作物の数例です。スペイン、イタリア、ギリシャは有機オリーブの重要な栽培国であり、近年ではそれぞれ197,000ヘクタール、179,000ヘクタール、47,000ヘクタールとなっています。オリーブもブドウも、国内外に需要のある特産品に加工できるため、欧州の農業にとって極めて重要です。この地域における有機栽培面積の増加は、欧州の有機農業産業を強化すると予想されます。
同地域における有機製品に対する需要の増大と1人当たり支出の増加
- 欧州の消費者は、自然材料や自然製法で作られた商品をますます購入するようになっています。有機食品が欧州連合全体の農業生産に占める割合はまだわずかであるもはやニッチ産業ではないです。欧州連合は、オーガニック商品の単一市場としては国際的に2番目に大きく、1人当たりの年間平均支出額は74.8米ドルです。欧州におけるオーガニック食品への1人当たりの支出は、過去10年間で倍増しています。2020年には、スイスとデンマークの消費者が有機食品に最も多く支出した(それぞれ1人当たり494.09米ドルと453.90米ドル)。
- 世界のオーガニックトレードのデータによれば、ドイツは欧州最大のオーガニック食品市場であり、米国に次いで世界第2位の市場規模を誇り、2021年の市場規模は63億米ドル、1人当たり消費額は75.6米ドルです。同国は世界の有機食品需要の10.0%を占め、2021~2026年にかけて2.7%のCAGRで推移すると推定されます。
- フランスの有機食品市場は力強い成長を示し、2021年の小売売上高は12.6%増加しました。世界のオーガニックトレードのデータによると、同国のオーガニック食品に対する1人当たり支出額は2021年に88.8米ドルを記録しました。2018年、Agence BIO/Spirit Insight Barometerが記録したように、フランス人の88%がオーガニック製品を消費したことがあると宣言しました。健康、環境、動物福祉の保護が、フランスでオーガニック食品を消費する主要理由です。オーガニック市場は、スペイン、オランダ、スウェーデンを含む他のいくつかの国でも、オーガニックストアの開店とともに成長し始めています。有機食品の売上は、COVID-19の大流行中とその後に伸びた。消費者が健康問題に関心を持ち始め、従来の方法で栽培された食品の悪影響を知ったからです。
欧州のバイオ肥料産業概要
欧州のバイオ肥料市場はセグメント化されており、上位5社で1.29%を占めています。この市場の主要企業は、Agronutrition、Biolchim SPA、Koppert Biological Systems Inc.、Lallemand Inc.、Symborg、Inc.などです。
その他の特典
- エクセル形式の市場予測(ME)シート
- 3ヶ月のアナリストサポート
目次
第1章 エグゼクティブサマリーと主要調査結果
第2章 レポートのオファー
第3章 イントロダクション
- 調査の前提条件と市場定義
- 調査範囲
- 調査手法
第4章 主要産業動向
- 有機栽培面積
- 一人当たりのオーガニック製品への支出
- 規制の枠組み
- フランス
- ドイツ
- イタリア
- オランダ
- ロシア
- スペイン
- トルコ
- 英国
- バリューチェーンと流通チャネル分析
第5章 市場セグメンテーション
- 形態
- アゾスピリラム
- アゾトバクタ
- 菌根菌
- リン酸可溶菌
- 根粒菌
- その他のバイオ肥料
- 作物タイプ
- 換金作物
- 園芸作物
- 畑作物
- 生産国
- フランス
- ドイツ
- イタリア
- オランダ
- ロシア
- スペイン
- トルコ
- 英国
- その他の欧州
第6章 競合情勢
- 主要な戦略動向
- 市場シェア分析
- 企業情勢
- 企業プロファイル
- Agronutrition
- Andermatt Group AG
- Atlantica Agricola
- Biolchim SPA
- Bionema
- Ficosterra
- Koppert Biological Systems Inc.
- Lallemand Inc.
- Sustane Natural Fertilizer Inc.
- Symborg, Inc.
第7章 CEOへの主要戦略的質問
第8章 付録
- 世界概要
- 概要
- ファイブフォース分析フレームワーク
- 世界のバリューチェーン分析
- 市場力学(DROs)
- 情報源と参考文献
- 図表一覧
- 主要な洞察
- データパック
- 用語集
目次
Product Code: 500017
The Europe Biofertilizer Market size is estimated at 1.14 billion USD in 2025, and is expected to reach 1.79 billion USD by 2030, growing at a CAGR of 9.49% during the forecast period (2025-2030).
- Biofertilizers are living microorganisms that can enhance plant nutrition by either mobilizing or increasing nutrient availability in soils. The most common microorganisms used as biofertilizers in agriculture include mycorrhiza, Azospirillum, Azotobacter, Rhizobium, and phosphate-solubilizing bacteria.
- Among these biofertilizers, mycorrhiza is most predominantly used in Europe and accounted for a market share of 62.8% in 2022, with a value of USD 549.5 million. Mycorrhiza is a fungus that establishes a symbiotic relationship with the plant root system. It increases the root surface area of plants, enhancing their nutrient uptake.
- Rhizobium is the most important nitrogen-fixing bacterium that exists in a symbiotic relationship with plants and lives in the root nodules of leguminous plants. Rhizobium is the second most consumed biofertilizer in the region, accounting for a share of 13.2% in 2022.
- It has been found that 40-250 kg of nitrogen per hectare per year is fixed in different legume crops by the microbial activities of Rhizobium. The European Union is planning to transition toward sustainable plant protein production by expanding the area under leguminous crop cultivation. This move may potentially drive the Rhizobium segment of the market.
- Azospirillum and Azotobacter are free-living, nitrogen-fixing bacteria that can fix atmospheric nitrogen and make it available to plants in a non-symbiotic manner. Biological nitrogen fixation contributes to soil fertility and crop productivity. Due to the increasing demand for food production, the use of Azotobacter in the European region is anticipated to grow.
- The European biofertilizer market has experienced significant growth in recent years, primarily driven by the increasing demand for organically grown food in countries like Germany, France, and Italy. From 2017 to 2022, the region's organically cultivated area grew from 4.9 million hectares to 7.3 million hectares, resulting in a 28.1% increase in the biofertilizer market.
- To support the growth of organic farming practices in Europe, in 2021, the European Commission unveiled an action plan to increase the organic area in member countries to occupy 25.0% of the region's agricultural land area by 2030. In response, governments across the region are providing subsidies to organic farmers and diverting agricultural budgets toward promoting organic farming practices.
- For example, in 2022, the German government planned to subsidize organic farmers with a budget of USD 35.46 billion, while the Italian government invested USD 3.54 billion through the National Strategic Plan to promote organic agriculture. Italy aims to convert 25.0% of its agricultural land to organic farming by 2027, three years ahead of the target set by the European Commission.
- In terms of market consumption, France was the largest market in Europe for plant biofertilizers, accounting for a 21.1% share in 2022, followed by Italy and Spain accounting for 15.8% and 10.5%, respectively.
- The growth of the European biofertilizer market is expected to continue due to the increasing popularity of organic farming practices and rising government initiatives driving the transition toward more sustainable agricultural practices.
Europe Biofertilizer Market Trends
European Green Deal is majorly contributing for increasing organic cultivation, Italy majorly holding largest area under organic
- European countries are increasingly promoting organic farming, and the amount of land categorized as organic has significantly increased over the last 10 years. In March 2021, the European Commission launched an organic action plan to achieve the European Green Deal target of ensuring that 25% of agricultural land is under organic farming by 2030. Austria, Italy, Spain, and Germany are among the leading countries for organic cultivation in the European region. Italy has 15.0% of its agricultural area under organic farming, which is higher than the EU average of 7.5%.
- In 2021, organic land in the European Union was recorded at 14.7 million hectares. The agricultural production area is divided into three main types of use: arable land crops (mainly cereals, root crops, and fresh vegetables), permanent grassland, and permanent crops. The area of organic arable land was 6.5 million hectares in 2021, the equivalent of 46% of the European Union's total organic agricultural area.
- The organic cultivation area of cereals, oilseeds, protein crops, and pulses in the European Union increased by 32.6% between 2017 and 2021, amounting to more than 1.6 million hectares. With 1.3 million hectares in production, perennial crops accounted for 15% of the organic land in 2020. Olives, grapes, almonds, and citrus fruits are a few examples of crops in this group. Spain, Italy, and Greece are significant growers of organic olive trees, with 197,000, 179,000, and 47,000 hectares, respectively, in recent years. Both olives and grapes are crucial for the European agricultural industry because they can be turned into specialty products that are in demand locally and globally. The increasing organic acreage in the region is expected to strengthen the organic agricultural industry in Europe.
Growing demand and rising the per capita spending on organic products in the region
- European consumers are increasingly purchasing goods made using natural materials and methods. Even though organic food still only makes up a fraction of the European Union's overall agricultural production, it is no longer a niche industry. The European Union represents the second-largest single market for organic goods internationally, with an average per capita spending of USD 74.8 annually. The per capita spending on organic food in Europe has doubled in the last decade. In 2020, Swiss and Danish consumers spent the most on organic food (USD 494.09 and USD 453.90 per capita, respectively.
- Germany is the largest organic food market in Europe and the second largest market in the world after the United States, with a market size of USD 6.3 billion in 2021 and a per capita consumption of USD 75.6, as per Global Organic Trade data. The country accounted for 10.0% of the global organic food demand and is estimated to record a CAGR of 2.7% between 2021 and 2026.
- The organic food market in France witnessed strong growth, with a 12.6% rise in retail sales in 2021. The country's per capita spending on organic food was recorded at USD 88.8 in 2021, as per Global Organic Trade data. In 2018, as recorded by the Agence BIO/Spirit Insight Barometer, 88% of French people declared having consumed organic products. The preservation of health, environment, and animal welfare are the primary justifications for consuming organic foods in France. The organic market has begun to grow in several other nations, including Spain, the Netherlands, and Sweden, with the opening of organic stores. Organic food sales grew during and post the COVID-19 pandemic as consumers began paying more attention to health issues and learned the adverse effects of conventionally grown food.
Europe Biofertilizer Industry Overview
The Europe Biofertilizer Market is fragmented, with the top five companies occupying 1.29%. The major players in this market are Agronutrition, Biolchim SPA, Koppert Biological Systems Inc., Lallemand Inc. and Symborg, Inc. (sorted alphabetically).
Additional Benefits:
- The market estimate (ME) sheet in Excel format
- 3 months of analyst support
TABLE OF CONTENTS
1 EXECUTIVE SUMMARY & KEY FINDINGS
2 REPORT OFFERS
3 INTRODUCTION
- 3.1 Study Assumptions & Market Definition
- 3.2 Scope of the Study
- 3.3 Research Methodology
4 KEY INDUSTRY TRENDS
- 4.1 Area Under Organic Cultivation
- 4.2 Per Capita Spending On Organic Products
- 4.3 Regulatory Framework
- 4.3.1 France
- 4.3.2 Germany
- 4.3.3 Italy
- 4.3.4 Netherlands
- 4.3.5 Russia
- 4.3.6 Spain
- 4.3.7 Turkey
- 4.3.8 United Kingdom
- 4.4 Value Chain & Distribution Channel Analysis
5 MARKET SEGMENTATION (includes market size in Value in USD and Volume, Forecasts up to 2030 and analysis of growth prospects)
- 5.1 Form
- 5.1.1 Azospirillum
- 5.1.2 Azotobacter
- 5.1.3 Mycorrhiza
- 5.1.4 Phosphate Solubilizing Bacteria
- 5.1.5 Rhizobium
- 5.1.6 Other Biofertilizers
- 5.2 Crop Type
- 5.2.1 Cash Crops
- 5.2.2 Horticultural Crops
- 5.2.3 Row Crops
- 5.3 Country
- 5.3.1 France
- 5.3.2 Germany
- 5.3.3 Italy
- 5.3.4 Netherlands
- 5.3.5 Russia
- 5.3.6 Spain
- 5.3.7 Turkey
- 5.3.8 United Kingdom
- 5.3.9 Rest of Europe
6 COMPETITIVE LANDSCAPE
- 6.1 Key Strategic Moves
- 6.2 Market Share Analysis
- 6.3 Company Landscape
- 6.4 Company Profiles (includes Global Level Overview, Market Level Overview, Core Business Segments, Financials, Headcount, Key Information, Market Rank, Market Share, Products and Services, and Analysis of Recent Developments).
- 6.4.1 Agronutrition
- 6.4.2 Andermatt Group AG
- 6.4.3 Atlantica Agricola
- 6.4.4 Biolchim SPA
- 6.4.5 Bionema
- 6.4.6 Ficosterra
- 6.4.7 Koppert Biological Systems Inc.
- 6.4.8 Lallemand Inc.
- 6.4.9 Sustane Natural Fertilizer Inc.
- 6.4.10 Symborg, Inc.
7 KEY STRATEGIC QUESTIONS FOR AGRICULTURAL BIOLOGICALS CEOS
8 APPENDIX
- 8.1 Global Overview
- 8.1.1 Overview
- 8.1.2 Porter's Five Forces Framework
- 8.1.3 Global Value Chain Analysis
- 8.1.4 Market Dynamics (DROs)
- 8.2 Sources & References
- 8.3 List of Tables & Figures
- 8.4 Primary Insights
- 8.5 Data Pack
- 8.6 Glossary of Terms

