
|
市場調査レポート
商品コード
1693755
北米の生物農薬:市場シェア分析、産業動向と統計、成長予測(2025年~2030年)North America Biopesticides - Market Share Analysis, Industry Trends & Statistics, Growth Forecasts (2025 - 2030) |
||||||
カスタマイズ可能
適宜更新あり
|
|||||||
| 北米の生物農薬:市場シェア分析、産業動向と統計、成長予測(2025年~2030年) |
|
出版日: 2025年03月18日
発行: Mordor Intelligence
ページ情報: 英文 148 Pages
納期: 2~3営業日
|

全表示
- 概要
- 目次
概要
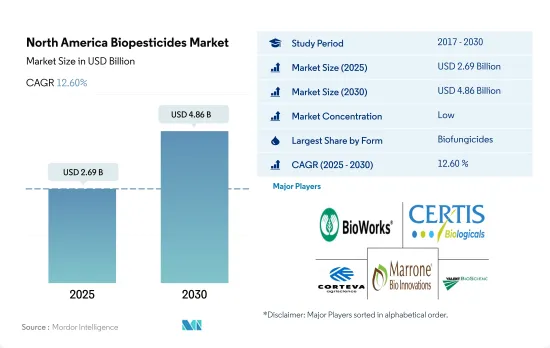
北米の生物農薬市場規模は2025年に26億9,000万米ドルと推定され、2030年には48億6,000万米ドルに達すると予測され、予測期間中(2025~2030年)のCAGRは12.60%で成長する見込みです。
- 生物農薬は、病原性真菌による病気を予防するために植物に散布される物質です。生物農薬には微生物由来のものと植物由来のものがあります。北米では、生物農薬の市場規模は2022年に8億9,120万米ドルとなり、同年の市場シェアは46.7%で、最も人気のある生物農薬タイプとなっています。バチルス菌、トリコデルマ菌、シュードモナス菌などの微生物種が、市場で最も利用されている生物農薬です。
- 北米の生物農薬市場は2022年に5億6,500万米ドルとなり、シェアは29.6%で、2番目に消費量の多い生物農薬となっています。さらに、有機農業の栽培面積が最も大きい畑作物が、2022年の生物農薬使用量の73.5%を占めました。園芸作物が21.4%、換金作物が5%でこれに続きます。
- その他の生物農薬には、殺線虫剤、殺鼠剤、殺ダニ剤、軟体動物駆除剤などの生物由来の製品が含まれます。これらの生物農薬は2022年に16.08%のシェアを占め、生物殺菌剤、生物殺虫剤に次いで第3位を占めています。
- 生物学的除草剤の2022年の市場規模は1億4,440万米ドルで、同年の消費量は9,900トンでした。生物学的除草剤とは、雑草の成長を抑えたり、雑草の種子を発芽させたりすることで、作物の生長と競合する雑草を管理するために使用される微生物、植物抽出物、またはその他の植物毒のことです。
- 農業従事者における農薬の過剰使用に対する意識の高まりや、サステイナブル農法や有機農業を支援する政府の取り組みにより、生物農薬の需要が増加しています。そのため、生物農薬市場は2023~2029年にかけて拡大すると予想されます。
- 北米の生物農薬市場は米国が大きく支配しており、2022年の市場金額の68.9%を占めています。この成長は、同国の広大な有機栽培面積に起因しており、同地域の有機作物総栽培面積の39.5%を占めています。連作作物も重要な役割を果たしており、2022年の市場金額の50.5%を占めています。
- カナダはこの地域で2番目に大きな生物農薬市場で、2022年の市場シェアは23.7%でした。同国の有機作物栽培面積は拡大しており、2017年の40万haから2022年には45万haに拡大しました。この動向は今後も続くと予想され、農業用植物生物農薬市場の成長を牽引します。
- メキシコは北米で2番目に有機農業面積が大きく、2022年の有機作物全体の作付面積は54万haで、2029年には61万haに増加すると予想されています。このような有機農作物作付面積の増加は、生物農薬の主要な需要促進要因です。
- その他の北米地域は、2022年の生物農薬消費量の1.15%以下でした。しかし、市場は2017~2022年にかけて2.9%成長しました。2023~2029年にかけてはCAGR 9.2%を記録すると予測されています。
- 北米の生物農薬市場は、農業従事者の持続可能性に関する知識の増加や有機農業を推進する政府の施策により、他の北米諸国よりも米国の方が成長が早いと予想されます。有機製品やサステイナブル農業に対する需要の高まりも、今後数年間の生物農薬市場の成長を促進する可能性があります。
北米の生物農薬市場動向
米国などの主要国で有機農産物の需要が拡大、政府の支援で栽培面積が増加
- FibL統計が提供したデータによると、北米における作物の有機栽培面積は2021年に150万haを記録しました。同地域の有機栽培面積は2017~2021年の間に13.5%増加しました。北米諸国の中では米国が圧倒的で、有機栽培の農地面積は62万3,000haで、カリフォルニア州、メイン州、ニューヨーク州が農業を実践している主要州です。
- 米国に続くのはメキシコで、2021年の有機農業実施面積は53万1,100haです。メキシコは世界の有機食品生産量のトップ20に入っています。世界のコーヒー・マスターズのデータによれば、メキシコは世界最大の有機コーヒー輸出国です。同国の有機コーヒー生産者数から見た有機コーヒー生産面積は最大です。国内の主要有機食品生産州は、チアパス州、オアハカ州、ミチョアカン州、チワワ州、ゲレロ州で、国内の有機栽培面積の80.0%を占めます。全国有機農業協会(National Association for Organic Agriculture)などの組織が国内で有機農業を推進しており、より多くの農業従事者が有機農業に取り組む動機付けになると期待されています。メキシコ政府は、資金援助に加えて、有機農業を支援する研究開発活動も支援しています。
- カナダの有機作物栽培面積は、2017年の40万haから2021年には45万haに増加しました。2021年には42万haで、列作物が最大面積を占めます。カナダ政府は、有機農業従事者を支援するための有機開発基金として、2021年に29万7,330米ドルを拠出すると発表しました。こうした取り組みにより、同地域の有機栽培面積の増加が期待されます。
国内と国際市場における有機農産物の需要拡大、有機食品に対する1人当たり支出の増加
- 北米における有機食品への1人当たり平均支出額は、2021年には109.7米ドルでした。米国の1人当たり支出は北米諸国の中で最も高く、2021年の平均支出は186.7米ドルです。オーガニックタド協会によると、米国におけるオーガニック製品の売上高は2021年に630億米ドルを超え、前年比2.0%増となり、オーガニック食品の売上高は2021年に575億米ドルとなりました。オーガニック果物・野菜はオーガニック製品売上高全体の15.0%を占め、2021年の金額は210億米ドルでした。
- カナダ有機連合が報告したデータによると、カナダにおける有機食品の売上は2020年に81億米ドルに達しました。カナダはオーガニック製品の世界第6位の市場であり、同国ではオーガニック製品の供給が需要に追いついていないと報告されています。2021年の1人当たりのオーガニック食品への平均支出額は142.6米ドルでした。小売業者に対する政府の支援が増加することで、同国におけるオーガニック製品の入手可能性、入手しやすさ、手頃な価格が高まると予想されます。Organic Tarde Associationは、カナダのオーガニック製品市場は2021~2026年の間にCAGR 6.3%を記録すると予測しています。
- 2021年、メキシコのオーガニック製品市場規模は6,300万米ドルで、世界ランクは35位です。オーガニックトレード協会によると、2021~2026年の間にCAGR7.2%を記録すると推定されています。しかし、同国のオーガニック製品に対する1人当たりの支出額は、この地域の他の国々に比べて少なく、2021年には0.49米ドルを占めています。メキシコ市場に参入する参入企業が増えれば、同国における有機製品の需要が高まると予想されます。
北米の生物農薬産業の概要
北米の生物農薬市場はセグメント化されており、上位5社で6.36%を占めています。この市場の主要企業は、Bioworks Inc.、Certis U.S.A. LLC、Corteva Agriscience、Marrone Bio Innovations Inc.、Valent Biosciences LLCなどです。
その他の特典
- エクセル形式の市場予測(ME)シート
- 3ヶ月のアナリストサポート
目次
第1章 エグゼクティブサマリーと主要調査結果
第2章 レポートのオファー
第3章 イントロダクション
- 調査の前提条件と市場定義
- 調査範囲
- 調査手法
第4章 主要産業動向
- 有機栽培面積
- 一人当たりのオーガニック製品への支出
- 規制の枠組み
- カナダ
- メキシコ
- 米国
- バリューチェーンと流通チャネル分析
第5章 市場セグメンテーション
- 形態
- 生物農薬
- バイオ除草剤
- 生物農薬
- その他の生物農薬
- 作物タイプ
- 換金作物
- 園芸作物
- 耕作作物
- 生産国
- カナダ
- メキシコ
- 米国
- その他の北米地域
第6章 競争情勢
- 主要な戦略動向
- 市場シェア分析
- 企業情勢
- 企業プロファイル
- AEF Global Biopesticides
- Andermatt Group AG
- BIOQUALITUM SA de CV
- Bioworks Inc.
- Certis U.S.A. LLC
- Corteva Agriscience
- Lallemand Inc.
- Marrone Bio Innovations Inc.
- Terramera Inc.
- Valent Biosciences LLC
第7章 CEOへの主要戦略的質問
第8章 付録
- 世界概要
- 概要
- ファイブフォース分析フレームワーク
- 世界のバリューチェーン分析
- 市場力学(DROs)
- 情報源と参考文献
- 図表一覧
- 主要な洞察
- データパック
- 用語集
目次
Product Code: 500015
The North America Biopesticides Market size is estimated at 2.69 billion USD in 2025, and is expected to reach 4.86 billion USD by 2030, growing at a CAGR of 12.60% during the forecast period (2025-2030).
- Biofungicides are substances applied to plants to prevent diseases caused by pathogenic fungi. Biofungicides may be of microbial or botanical origin. In North America, the market for biofungicides was valued at USD 891.2 million in 2022, making them the most popular biopesticide type, with a 46.7% market share in the same year. Microbial species like Bacillus, Trichoderma, and Pseudomonas are the most available biofungicides in the market.
- The market for bioinsecticides in North America was valued at USD 565.0 million in 2022, with a share of 29.6%, making it the second most consumed biopesticide. Furthermore, the field crops with the largest area under organic agriculture accounted for 73.5% of bioinsecticide usage in 2022. Horticulture and cash crops followed with 21.4% and 5%, respectively, in the same year.
- Other biopesticides include products like nematicides, rodenticides, acaricides, and molluscicides of biological origin. These biological pesticides accounted for a share of 16.08% in 2022, occupying the third place after biofungicides and bioinsecticides.
- The market for biological herbicides was valued at USD 144.4 million in 2022, with a volume consumption of 9.9 thousand metric tons in the same year. Bioherbicides are microbes, plant extracts, or other phytotoxins used to manage weeds that compete with crops for growth by reducing weed growth or germinating weed seeds.
- The increasing awareness about the overuse of pesticides among farmers and the government initiatives to support sustainable agricultural practices and organic farming resulted in an increasing demand for biopesticides. Therefore, the market for biopesticides is anticipated to increase between 2023 and 2029.
- The North American biopesticides market is largely dominated by the United States, which accounted for 68.9% of the market value in 2022. This growth can be attributed to the country's vast organic cultivation area, which makes up 39.5% of the total organic crop area in the region. Row crops also play a significant role, which made up 50.5% of the market value in 2022.
- Canada was the second-largest biopesticides market in the region, with a market share of 23.7% in 2022. The country's organic crop farming area has been expanding, which grew from 400.0 thousand ha in 2017 to 450.0 thousand ha in 2022. This trend is expected to continue, driving growth in the agricultural plant biopesticides market.
- Mexico has the second-largest organic agricultural area in North America, with an overall organic crop area of 0.54 million ha in 2022, which is expected to increase to 0.61 million ha by 2029. This growth in organic crop areas is a key demand driver for biopesticides.
- The Rest of North America accounted for less than 1.15% of biopesticide consumption in 2022. However, the market grew by 2.9% between 2017 and 2022. It is projected to register a CAGR of 9.2% between 2023 and 2029.
- The North American biopesticides market is expected to grow faster in the United States than in other North American countries due to increased knowledge of sustainability among farmers and government measures promoting organic farming. The rising demand for organic products and sustainable agriculture practices may also drive growth in the biopesticides market in the coming years.
North America Biopesticides Market Trends
Organic produce demand grows in major countries like the United States, increasing cultivation area with government support
- The area under organic cultivation of crops in North America was recorded at 1.5 million ha in 2021, according to the data provided by FibL statistics. The area under organic cultivation in the region increased by 13.5% between 2017 and 2021. Among the North American countries, the United States is dominant, with 623.0 thousand ha of agricultural land under organic farming, with California, Maine, and New York being the major states practicing agriculture.
- The United States was followed by Mexico, with 531.1 thousand hectares of area under organic farming in 2021. Mexico is among the top 20 organic food producers in the world. Mexico is the largest exporter of organic coffee in the world, according to the Global Coffee Masters data. The country has the largest area under organic coffee production in terms of the number of organic coffee producers in the country. The major organic food-producing states in the country include Chiapas, Oaxaca, Michoacan, Chihuahua, and Guerrero, which account for 80.0% of the total organic area in the country. Organizations such as the National Association for Organic Agriculture are promoting organic agriculture in the country, which is expected to motivate more farmers to take up organic agriculture. In addition to financial assistance, the Mexican government supports research and development activities to help organic agriculture.
- Canada's area under organic crop cultivation increased from 0.4 million ha in 2017 to 0.45 million ha in 2021. Row crops occupied the maximum area with 0.42 million in 2021. The Canadian government announced a sum of USD 297,330 in 2021 as Organic Development Fund to support organic farmers. These initiatives are expected to increase the organic area in the region.
Growing demand for organic produce in domestic and international markets, rise in per capita spending on organic food
- The average per capita spending on organic food products in North America was USD 109.7 in 2021. The per capita spending in the United States is the highest among the North American countries, with average spending of USD 186.7 in 2021. The sales of organic products in the United States crossed USD 63.00 billion in 2021, according to the Organic Tarde Association, with a 2.0% increase over the previous year, with organic food sales standing at USD 57.5 billion in 2021. Organic fruits and vegetables accounted for 15.0% of the total organic product sales, with a value of USD 21.0 billion in 2021.
- Organic food sales in Canada reached a value of USD 8.10 billion in 2020, as per the data reported by the Organic Federation of Canada. It is reported that Canada is the sixth-largest market in the world for organic products, with the supply of organic products failing to keep up with the demand in the country. The average spending on organic food per person was USD 142.6 in 2021. Increasing government support to retailers is expected to increase the availability, accessibility, and affordability of organic products in the country. The Organic Tarde Association estimates that the organic products market in Canada is expected to register a CAGR of 6.3% between 2021 and 2026.
- In 2021, Mexico registered a market size of USD 63.0 million for organic products with a global rank of 35. According to the Organic Trade Association, it is estimated to register a CAGR of 7.2% between 2021 and 2026. However, the per capita spending on organic products in the country is less compared to other countries in the region, accounting for a value of USD 0.49 in 2021. More players entering the market in Mexico are expected to increase the demand for organic products in the country.
North America Biopesticides Industry Overview
The North America Biopesticides Market is fragmented, with the top five companies occupying 6.36%. The major players in this market are Bioworks Inc., Certis U.S.A. LLC, Corteva Agriscience, Marrone Bio Innovations Inc. and Valent Biosciences LLC (sorted alphabetically).
Additional Benefits:
- The market estimate (ME) sheet in Excel format
- 3 months of analyst support
TABLE OF CONTENTS
1 EXECUTIVE SUMMARY & KEY FINDINGS
2 REPORT OFFERS
3 INTRODUCTION
- 3.1 Study Assumptions & Market Definition
- 3.2 Scope of the Study
- 3.3 Research Methodology
4 KEY INDUSTRY TRENDS
- 4.1 Area Under Organic Cultivation
- 4.2 Per Capita Spending On Organic Products
- 4.3 Regulatory Framework
- 4.3.1 Canada
- 4.3.2 Mexico
- 4.3.3 United States
- 4.4 Value Chain & Distribution Channel Analysis
5 MARKET SEGMENTATION (includes market size in Value in USD and Volume, Forecasts up to 2030 and analysis of growth prospects)
- 5.1 Form
- 5.1.1 Biofungicides
- 5.1.2 Bioherbicides
- 5.1.3 Bioinsecticides
- 5.1.4 Other Biopesticides
- 5.2 Crop Type
- 5.2.1 Cash Crops
- 5.2.2 Horticultural Crops
- 5.2.3 Row Crops
- 5.3 Country
- 5.3.1 Canada
- 5.3.2 Mexico
- 5.3.3 United States
- 5.3.4 Rest of North America
6 COMPETITIVE LANDSCAPE
- 6.1 Key Strategic Moves
- 6.2 Market Share Analysis
- 6.3 Company Landscape
- 6.4 Company Profiles (includes Global Level Overview, Market Level Overview, Core Business Segments, Financials, Headcount, Key Information, Market Rank, Market Share, Products and Services, and Analysis of Recent Developments).
- 6.4.1 AEF Global Biopesticides
- 6.4.2 Andermatt Group AG
- 6.4.3 BIOQUALITUM SA de CV
- 6.4.4 Bioworks Inc.
- 6.4.5 Certis U.S.A. LLC
- 6.4.6 Corteva Agriscience
- 6.4.7 Lallemand Inc.
- 6.4.8 Marrone Bio Innovations Inc.
- 6.4.9 Terramera Inc.
- 6.4.10 Valent Biosciences LLC
7 KEY STRATEGIC QUESTIONS FOR AGRICULTURAL BIOLOGICALS CEOS
8 APPENDIX
- 8.1 Global Overview
- 8.1.1 Overview
- 8.1.2 Porter's Five Forces Framework
- 8.1.3 Global Value Chain Analysis
- 8.1.4 Market Dynamics (DROs)
- 8.2 Sources & References
- 8.3 List of Tables & Figures
- 8.4 Primary Insights
- 8.5 Data Pack
- 8.6 Glossary of Terms

