
|
市場調査レポート
商品コード
1693768
アジア太平洋の生物農薬:市場シェア分析、産業動向と統計、成長予測(2025年~2030年)Asia-Pacific Biopesticides - Market Share Analysis, Industry Trends & Statistics, Growth Forecasts (2025 - 2030) |
||||||
カスタマイズ可能
適宜更新あり
|
|||||||
| アジア太平洋の生物農薬:市場シェア分析、産業動向と統計、成長予測(2025年~2030年) |
|
出版日: 2025年03月18日
発行: Mordor Intelligence
ページ情報: 英文 171 Pages
納期: 2~3営業日
|

全表示
- 概要
- 目次
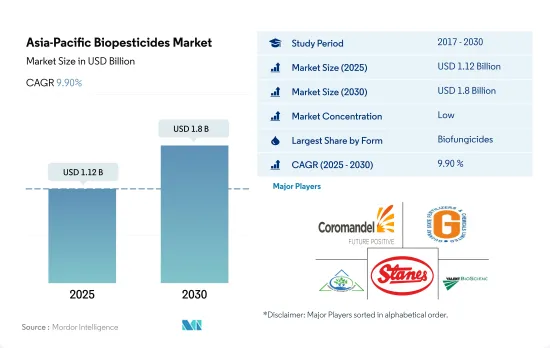
アジア太平洋の生物農薬市場規模は2025年に11億2,000万米ドルと推定され、2030年には18億米ドルに達し、予測期間中(2025~2030年)にCAGR 9.90%で成長すると予測されます。
- 生物農薬は、動物、植物、昆虫、細菌や真菌を含む微生物に由来する天然由来の物質または薬剤です。これらは農業害虫や感染症の管理に使用されます。アジア太平洋の生物農薬市場は、2022年に8億5,420万米ドルと評価されました。
- バイオ殺菌剤はこの地域で最もよく使用されている生物農薬です。2022年の市場シェアは36.8%でした。バチルス菌、トリコデルマ菌、ストレプトマイセス菌、シュードモナス菌は、農業で最も商業的に使用されている微生物種です。これらの生物殺菌剤は、Pythium、Rhizoctonia、Fusarium、Sclerotinia、Thielaviopsis、Botrytis、うどんこ病などの病原菌に対して効果的に作用します。
- バイオ殺虫剤の中でも、細菌殺虫剤であるバチルス・チューリンゲンシスは、胞子形成期にタンパク質を産生することで害虫を駆除することができるため、農業で最も多く使用されています。バチルス・チューリンゲンシスは、幅広い種類の作物に影響を与える鱗翅目害虫の駆除に有効です。
- シュードモナス・フルオレッセンス(Pseudomonas fluorescens)とキサントモナス・カンペストリス(Xanthomonas campestris)はそれぞれ真菌と細菌で、この地域ではバイオ除草剤として商業的に重要性を増しています。これらの菌から放出される細胞外ペプチドとリポ多糖は雑草の成長を阻害します。キサントモナス・カンペストリスはウマノスズクサを効果的に防除することが知られています。
- 農業における生物的ストレスを管理するサステイナブルアプローチの必要性が、この地域における生物農薬使用の潜在的な推進力となっています。
- アジア太平洋では、中国やインドといった国々が市場をリードしており、サステイナブル農業への移行が顕著です。中国は現在、この地域で最大の生物農薬消費国であり、2022年には29.1%のシェアを占めています。
- 土壌汚染、公害、食品中の残留化学品に対する懸念の高まりを受けて、中国政府は有機投入物の使用を促進する積極的な対策を講じています。こうした取り組みには、有機認証取得費用の負担、農場内インフラや有機肥料への資金提供、研修、マーケティング支援、土地取得支援などが含まれます。有機栽培食品に対する需要の高まりを後押ししているのは、中間所得層と高所得層です。
- しかし、インドの有機栽培農業従事者数は世界一であり、有機農地面積は世界第5位です。2021~2022年にかけて、インドは幅広い食品を含む340万トン以上の有機認証製品を生産しました。このような有機農法の採用率の高さが、同地域の生物農薬市場を牽引すると予想されます。
- 生物農薬市場の主要促進要因の1つは、L. rigidum、R. raphanustrum、Bromus spp.、Hordeum spp.などの除草剤耐性雑草の開発です。これらの雑草は、ACCase阻害やALS阻害によって雑草を枯らす従来の化学除草剤に対する耐性を発達させており、防除を困難にしています。これは、農業従事者がバイオ除草剤のような他の代替手段を採用する機会をもたらし、アジア太平洋の生物農薬市場を牽引しています。市場は2023~2029年の間にCAGR 9.8%を記録すると推定されます。
アジア太平洋の生物農薬市場動向
中国、インド、インドネシア、オーストラリアなどの国々における政府支援の拡大がこの地域の有機農業を後押し
- FiBLの統計によれば、アジア太平洋の有機農地面積は2021年には370万ヘクタールを超え、世界の有機農地面積の26.4%を占めています。有機栽培面積は2017~2022年にかけて19.3%増加しました。2020年時点で、この地域の有機生産者は約180万人を記録し、インドが130万人でトップです。中国、インド、インドネシア、オーストラリアは、この地域で有機栽培面積が大きい主要国です。中国やインドなどの政府当局は、作物栽培における化学品への依存を減らすため、有機農業を絶えず推進しています。例えば、インドはParamparagat Krishi Vikas YojanaやAll India Network Programme on Organic Farming(AI-NPOF)のような制度を実施しています。
- 2021年には、中国が250万haで66.1%の最大シェアを占め、次いでインドが19.3%、インドネシアが1.5%、オーストラリアが1.4%でした。全有機農地は、連作作物、園芸作物、換金作物の3つの作物タイプに分けられます。連作作物はこの地域の有機農地の67.5%、すなわち2021年には250万haを占め、大きなシェアを占めています。この地域で栽培されている主要連作作物には、水稲、小麦、豆類、大豆、雑穀が含まれます。
- 換金作物のシェアは第2位で、2021年には70万haとなり、有機農地の18.5%を占めます。砂糖や有機茶のような有機換金作物への需要は世界的に増加しています。中国とインドは、それぞれ最大の有機緑茶と有機紅茶の生産国です。国際的な需要の高まりにより、この地域の有機栽培面積は増加すると予想されます。
オーガニック製品への1人当たり支出はオーストラリアが圧倒的に多く、中国のオーガニック食品市場が大きく成長
- この地域のオーガニック製品に対する1人当たり支出は、2021年には85.1米ドルを記録しました。オーストラリアでは、オーガニック製品に対する一人当たり支出が58.3米ドルと、同年の方が高かったが、これはオーガニック食品は健康によいという消費者の認識による需要の高まりに起因しています。Global Organic Tradeのデータによると、オーストラリアのオーガニック包装飲食品市場は、2021年には8億8,520万米ドルとなりました。
- 中国のオーガニック食品市場は2021年に13.3%成長し、このプラス成長パターンは続くと予想され、2023~2029年の推定CAGRは7.1%です。若い世代の間でオーガニック製品の重要性がますます強調されるようになり、また、就労する母親の数の増加や健康とウェルネスの動向の採用増加によりオーガニックベビーフードの需要が増加していることから、オーガニック製品は2025年までに64億米ドルの規模に達すると予想されます。
- インドのオーガニック製品は世界需要の1.0%に遠く及ばず、2021年の1人当たり支出額はわずか0.08米ドルです。しかし、インドは今後数年間で有望な市場となり、2025年には1億5,330万米ドルに達します。現在、同地域のオーガニック商品市場は非常に断片的で、一部のスーパーマーケットや専門店でしか販売されていないです。消費者の知識と購買意欲の高まりは、同地域における有機食品の持続可能性の特質に対する理解を深めることにつながります。1人当たり所得の増加は、有機食品摂取の重要性に対する消費者の意識の高まりとともに、アジア太平洋の有機食品に対する1人当たり支出を増加させる可能性を秘めています。
アジア太平洋の生物農薬産業概要
アジア太平洋の生物農薬市場はセグメント化されており、上位5社で3.31%を占めています。この市場の主要企業は、Coromandel International Ltd、Gujarat State Fertilizers & Chemicals Ltd、IPL Biologicals Limited、T.Stanes、Company Limited、Valent Biosciences LLCなどです。
その他の特典
- エクセル形式の市場予測(ME)シート
- 3ヶ月のアナリストサポート
目次
第1章 エグゼクティブサマリーと主要調査結果
第2章 レポートのオファー
第3章 イントロダクション
- 調査の前提条件と市場定義
- 調査範囲
- 調査手法
第4章 主要産業動向
- 有機栽培面積
- 一人当たりのオーガニック製品への支出
- 規制の枠組み
- オーストラリア
- 中国
- インド
- インドネシア
- 日本
- フィリピン
- タイ
- ベトナム
- バリューチェーンと流通チャネル分析
第5章 市場セグメンテーション
- 形態
- バイオ殺菌剤
- バイオ除草剤
- バイオ殺虫剤
- その他の生物農薬
- 作物タイプ
- 換金作物
- 園芸作物
- 耕作作物
- 生産国
- オーストラリア
- 中国
- インド
- インドネシア
- 日本
- フィリピン
- タイ
- ベトナム
- その他のアジア太平洋
第6章 競合情勢
- 主要な戦略動向
- 市場シェア分析
- 企業情勢
- 企業プロファイル
- Andermatt Group AG
- Biobest Group NV
- Biolchim SPA
- Coromandel International Ltd
- Gujarat State Fertilizers & Chemicals Ltd
- Henan Jiyuan Baiyun Industry Co. Ltd
- IPL Biologicals Limited
- Koppert Biological Systems Inc.
- T.Stanes and Company Limited
- Valent Biosciences LLC
第7章 CEOへの主要戦略的質問
第8章 付録
- 世界概要
- 概要
- ファイブフォース分析フレームワーク
- 世界のバリューチェーン分析
- 市場力学(DROs)
- 情報源と参考文献
- 図表一覧
- 主要な洞察
- データパック
- 用語集
The Asia-Pacific Biopesticides Market size is estimated at 1.12 billion USD in 2025, and is expected to reach 1.8 billion USD by 2030, growing at a CAGR of 9.90% during the forecast period (2025-2030).
- Biopesticides are naturally occurring substances or agents derived from animals, plants, insects, and microorganisms, including bacteria and fungi. They are used to manage agricultural pests and infections. The market for biopesticides in the Asia-Pacific region was valued at USD 854.2 million in 2022.
- Biofungicides are the most popular biopesticides used in the region. They held a market share of 36.8% in 2022. Bacillus, Trichoderma, Streptomyces, and Pseudomonas are the most commercially used species of microorganisms in agriculture. These biofungicides effectively act against pathogens, such as Pythium, Rhizoctonia, Fusarium, Sclerotinia, Thielaviopsis, Botrytis, and powdery mildew.
- Among bioinsecticides, the bacterial insecticide Bacillus thuringiensis is most predominantly used in agriculture due to its immense potential to control pests by producing proteins during the sporulation phase. Bacillus thuringiensis is effective in managing lepidopteran species that affect a wide range of crop types.
- Pseudomonas fluorescens and Xanthomonas campestris are fungi and bacteria, respectively, gaining commercial importance as bioherbicides in the region. The extracellular peptides and a lipopolysaccharide released from these organisms inhibit the growth of weeds. Xanthomonas campestris is known to control horseweed effectively.
- The need for sustainable approaches in managing biotic stresses in agriculture is the potential driver for biopesticide usage in the region.
- The Asia-Pacific region is witnessing a significant shift toward sustainable agriculture practices, with countries like China and India leading the market. China is currently the largest consumer of biopesticides in the region, and it accounted for a 29.1% share in 2022.
- In response to rising concerns over soil contamination, pollution, and chemical residues in food, the Chinese government is taking proactive measures to promote the usage of organic inputs. These initiatives include bearing the cost of organic certification, providing funding for on-farm infrastructure and organic fertilizers, training, marketing assistance, and assisting with land acquisition. Middle and higher-income families are driving this growing demand for organically-grown food.
- However, India has the world's highest number of organic growers, and it is the fifth-largest country in terms of organic agricultural land area. During 2021-2022, India produced over 3.4 million metric tons of certified organic products, including a wide range of food products. This high adoption of organic farming practices is expected to drive the biopesticides market in the region.
- One key driver of the biopesticides market is the development of herbicide-resistant weeds such as L. rigidum, R. raphanustrum, Bromus spp., and Hordeum spp. These weeds have developed resistance against traditional chemical herbicides that kill the weeds by ACCase- and ALS-inhibition, making control difficult. This presents an opportunity for farmers to adopt other alternatives like bioherbicides, thus driving the Asia-Pacific biopesticides market. The market is estimated to record a CAGR of 9.8% between 2023 and 2029.
Asia-Pacific Biopesticides Market Trends
Growing Government support in countries like China, India, Indonesia, and Australia, boosts organic farming in the region
- The organic agricultural area in the Asia-Pacific region was over 3.7 million hectares in 2021, representing 26.4% of the global organic area, as per FiBL statistics. The organic area under cultivation grew by 19.3% between 2017 and 2022. As of 2020, the region recorded around 1.8 million organic producers, with India topping the list with 1.3 million organic producers. China, India, Indonesia, and Australia are the major countries with large organic cultivation areas in the region. Government authorities in countries like China and India are constantly promoting organic agriculture to reduce reliance on chemical inputs for crop cultivation. For instance, India has implemented schemes like Paramparagat Krishi Vikas Yojana and the All India Network Programme on Organic Farming (AI-NPOF).
- In 2021, China accounted for a maximum share of 66.1%, with 2.5 million ha, followed by India, Indonesia, and Australia, with 19.3%, 1.5%, and 1.4%, respectively. The total organic land is divided into three crop types, namely row crops, horticultural crops, and cash crops. Row crops occupy a major share of organic agricultural land in the region, accounting for 67.5% share, i.e., 2.5 million ha in 2021. The major row crops grown in the region include paddy, wheat, pulses, soybeans, and millets.
- Cash crops held the second largest share, with 0.7 million ha in 2021, accounting for an 18.5% share of organic cropland. The demand for organic cash crops like sugar and organic tea is increasing worldwide. China and India are the largest organic green and black tea producers, respectively. The growing international demand is expected to increase the organic acreages in the region.
Per capita spending on organic product predominant in Australia and China's organic food market growing significantly
- The per capita spending on organic products in the region was recorded at USD 85.1 in 2021. Australia witnessed a higher per capita spending on organic products, with USD 58.3 in the same year, attributed to the higher demand due to consumers' perception of organic food as healthy. As per the Global Organic Trade data, Australia's organic packaged food and beverage market was valued at USD 885.2 million in 2021.
- China's organic food market grew by 13.3% in 2021, and the positive growth pattern is expected to continue, with an estimated CAGR of 7.1% between 2023 and 2029. With an increasing emphasis on the importance of organic products among the younger generation and a rise in demand for organic baby food due to the growing number of mothers in the workforce and the increasing adoption of the health and wellness trend, organic products are expected to reach a value of USD 6.4 billion by 2025.
- Organic products in India represent far less than 1.0% of global demand, with a per capita expenditure of just USD 0.08 in 2021. However, India represents a promising market over the coming years, reaching a value of USD 153.3 million by 2025. Currently, the market for organic goods in the region is very fragmented, with just a few supermarkets and specialty stores selling them, as only people from higher-income families are potential customers. Growing consumer knowledge and buying motivations will lead to a better understanding of the sustainability qualities of organic food in the region. Increasing per capita income, along with increased consumer awareness of the importance of organic food intake, has the potential to raise per capita expenditure on organic food items in the Asia-Pacific region.
Asia-Pacific Biopesticides Industry Overview
The Asia-Pacific Biopesticides Market is fragmented, with the top five companies occupying 3.31%. The major players in this market are Coromandel International Ltd, Gujarat State Fertilizers & Chemicals Ltd, IPL Biologicals Limited, T.Stanes and Company Limited and Valent Biosciences LLC (sorted alphabetically).
Additional Benefits:
- The market estimate (ME) sheet in Excel format
- 3 months of analyst support
TABLE OF CONTENTS
1 EXECUTIVE SUMMARY & KEY FINDINGS
2 REPORT OFFERS
3 INTRODUCTION
- 3.1 Study Assumptions & Market Definition
- 3.2 Scope of the Study
- 3.3 Research Methodology
4 KEY INDUSTRY TRENDS
- 4.1 Area Under Organic Cultivation
- 4.2 Per Capita Spending On Organic Products
- 4.3 Regulatory Framework
- 4.3.1 Australia
- 4.3.2 China
- 4.3.3 India
- 4.3.4 Indonesia
- 4.3.5 Japan
- 4.3.6 Philippines
- 4.3.7 Thailand
- 4.3.8 Vietnam
- 4.4 Value Chain & Distribution Channel Analysis
5 MARKET SEGMENTATION (includes market size in Value in USD and Volume, Forecasts up to 2030 and analysis of growth prospects)
- 5.1 Form
- 5.1.1 Biofungicides
- 5.1.2 Bioherbicides
- 5.1.3 Bioinsecticides
- 5.1.4 Other Biopesticides
- 5.2 Crop Type
- 5.2.1 Cash Crops
- 5.2.2 Horticultural Crops
- 5.2.3 Row Crops
- 5.3 Country
- 5.3.1 Australia
- 5.3.2 China
- 5.3.3 India
- 5.3.4 Indonesia
- 5.3.5 Japan
- 5.3.6 Philippines
- 5.3.7 Thailand
- 5.3.8 Vietnam
- 5.3.9 Rest of Asia-Pacific
6 COMPETITIVE LANDSCAPE
- 6.1 Key Strategic Moves
- 6.2 Market Share Analysis
- 6.3 Company Landscape
- 6.4 Company Profiles (includes Global Level Overview, Market Level Overview, Core Business Segments, Financials, Headcount, Key Information, Market Rank, Market Share, Products and Services, and Analysis of Recent Developments).
- 6.4.1 Andermatt Group AG
- 6.4.2 Biobest Group NV
- 6.4.3 Biolchim SPA
- 6.4.4 Coromandel International Ltd
- 6.4.5 Gujarat State Fertilizers & Chemicals Ltd
- 6.4.6 Henan Jiyuan Baiyun Industry Co. Ltd
- 6.4.7 IPL Biologicals Limited
- 6.4.8 Koppert Biological Systems Inc.
- 6.4.9 T.Stanes and Company Limited
- 6.4.10 Valent Biosciences LLC
7 KEY STRATEGIC QUESTIONS FOR AGRICULTURAL BIOLOGICALS CEOS
8 APPENDIX
- 8.1 Global Overview
- 8.1.1 Overview
- 8.1.2 Porter's Five Forces Framework
- 8.1.3 Global Value Chain Analysis
- 8.1.4 Market Dynamics (DROs)
- 8.2 Sources & References
- 8.3 List of Tables & Figures
- 8.4 Primary Insights
- 8.5 Data Pack
- 8.6 Glossary of Terms

