
|
市場調査レポート
商品コード
1693754
北米のバイオ肥料:市場シェア分析、産業動向、成長予測(2025年~2030年)North America Biofertilizer - Market Share Analysis, Industry Trends & Statistics, Growth Forecasts (2025 - 2030) |
||||||
カスタマイズ可能
適宜更新あり
|
|||||||
| 北米のバイオ肥料:市場シェア分析、産業動向、成長予測(2025年~2030年) |
|
出版日: 2025年03月18日
発行: Mordor Intelligence
ページ情報: 英文 156 Pages
納期: 2~3営業日
|

全表示
- 概要
- 目次
概要
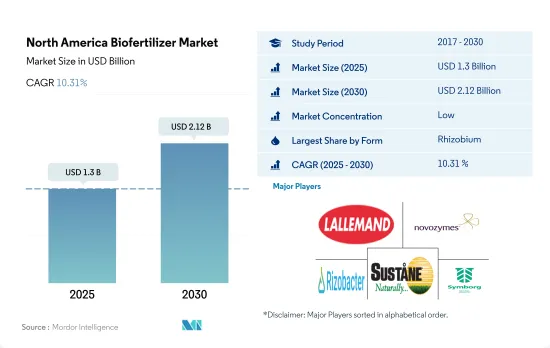
北米のバイオ肥料市場規模は2025年に13億米ドルと推定・予測され、2030年には21億2,000万米ドルに達し、予測期間(2025~2030年)のCAGRは10.31%で成長すると予測されています。
- バイオ肥料は、植物の成長を促進する生きた微生物を含む有機物質です。バイオ肥料市場額は2017~2021年にかけて約49.3%増加したが、これは農業従事者の意識の高まり、この地域における登録有機農場全体の増加、有機栽培またはサステイナブル方法で栽培された商品に対する需要の変化に起因しています。
- 菌根菌ベースのバイオ肥料は2022年の市場規模の約25.6%を占めたが、これは主にその適用によって化学肥料、特にリンの使用を最大30%削減できるためです。
- リゾビウムベースのバイオ肥料は北米のバイオ肥料市場を独占し、2022年の市場規模の約36.5%を占めました。
- アゾスピリラムベースのバイオ肥料は、2022年の市場全体の約21.6%を占めました。アゾスピリラムは、幅広い作物、特にイネ、トウモロコシ、ソルガム、コムギ、キビなどの穀物における大気中窒素固定に関与しています。
- 生物的/生物的ストレス耐性のある菌株を開発するため、継続的な研究が行われています。塩ストレス下では、Trifoliumalexandrinumを接種したRhizobium trifoliiはバイオマスと結節の増加を示しました。
- 農業従事者における肥料の過剰使用に対する意識の高まりや、サステイナブル農法や有機農業を支援する政府の取り組みにより、バイオ肥料の需要が高まっています。そのため、バイオ肥料市場は2023~2029年にかけて拡大すると予想されています。
- 米国は北米のバイオ肥料市場を独占し、2022年の市場金額の約45.6%を占めました。米国の優位性は、主に同地域の有機栽培面積の大きさによるもので、有機作物総面積の39.5%を占めています。
- カナダは北米地域で米国に次いで2番目に大きなバイオ肥料市場です。2022年、カナダはこの地域のバイオ肥料市場全体の約33.2%を占めました。同国では連作作物の栽培が盛んで、大豆、菜種、小麦などが主要作物として栽培されています。
- メキシコは北米地域で2番目に有機栽培面積が大きいにもかかわらず、2022年のバイオ肥料市場金額の18.2%を占めるに過ぎないです。これは主に、同国におけるバイオ肥料の施用率が低いことに起因しています。2022年のバイオ肥料の総消費量は3,300トンでした。
- 北米のその他の中東・アフリカの主要農業国は、コスタリカ、キューバ、ジャマイカ、グアテマラです。これらの国々では、換金作物栽培が連作作物や園芸作物に比べて支配的です。換金作物栽培は、2022年に北米のその他の中東・アフリカで利用可能な有機作物総面積の約92.0%を占めました。これらの国々で栽培されている主要換金作物は、コーヒー、サトウキビ、スパイスです。
- 北米地域のバイオ肥料市場は、同地域の他の国に比べて米国で高いペースで増加すると予測されているが、これは持続可能性に関する生産者の意識やサステイナブル栽培のための政府の取り組みなど、さまざまな理由に起因しています。
北米のバイオ肥料市場動向
米国など主要国で有機農産物の需要が拡大、政府の支援で栽培面積が増加
- FibL統計が提供したデータによると、北米における作物の有機栽培面積は2021年に150万ヘクタールを記録しました。この地域の有機栽培面積は2017~2022年にかけて13.5%増加しました。北米諸国の中では米国が圧倒的で、62万3,000ヘクタールの農地で有機農業が行われており、カリフォルニア州、メイン州、ニューヨーク州が農業を実践している主要州です。
- 米国に続くのはメキシコで、2021年の有機農業実施面積は53万1,100ヘクタールです。メキシコは世界の有機食品生産量の上位20位に入っています。世界のコーヒー・マスターズのデータによれば、メキシコは世界最大の有機コーヒー輸出国です。同国の有機コーヒー生産面積は最大で、国内の有機コーヒー生産者数でも最大です。国内の主要有機食品生産州には、チアパス州、オアハカ州、ミチョアカン州、チワワ州、ゲレロ州があり、2021年の国内の有機栽培面積の80.0%を占めています。全国有機農業協会(National Association for Organic Agriculture)などの組織が国内で有機農業を推進しており、有機農業に取り組む農業従事者を増やす動機付けになると期待されています。メキシコ政府は、資金援助に加え、有機農業の推進に役立つ研究開発活動も支援しています。
- カナダの有機作物栽培面積は、2017年の40万ヘクタールから2021年には45万ヘクタールに増加しました。2021年の栽培面積は42万ヘクタールで最大の面積を占めています。カナダ政府は、有機農業従事者を支援するための有機開発基金として、2021年に29万7,330米ドルを拠出すると発表しました。こうした取り組みにより、同地域の有機栽培面積の増加が期待されます。
国内市場と国際市場における有機農産物の需要拡大、有機食品に対する1人当たり支出の増加
- 北米の有機食品に対する1人当たり平均支出額は、2021年には109.7米ドルでした。米国の1人当たり支出は北米諸国の中で最も高く、2021年の平均支出は186.7米ドルでした。米国におけるオーガニック製品の売上高は、2021年に630億米ドルを超えました。オーガニックタルデ協会は前年比2.0%増を占め、2021年のオーガニック食品売上高は575億米ドルでした。オーガニック果物と野菜は、オーガニック製品売上全体の15.0%を占め、2021年には210億米ドルとなりました。
- カナダ有機連合が報告したデータによると、カナダにおける有機食品売上は2020年に81億米ドルに達しました。カナダはオーガニック製品の世界第6位の市場であり、オーガニック製品の供給が国内の需要に追いついていないと報告されています。2021年の1人当たりのオーガニック食品への平均支出額は142.6米ドルでした。小売業者に対する政府の支援が増加することで、同国におけるオーガニック製品の入手可能性、入手しやすさ、購入しやすさが向上すると予想されます。Organic Tarde Associationは、カナダのオーガニック製品市場が2021~2026年の間に成長し、CAGR6.3%を記録すると推定しています。
- 2021年、メキシコのオーガニック製品市場規模は6,300万米ドルで、世界ランクは35位でした。メキシコは2021~2026年にかけてCAGR 7.2%で成長すると推定されます。しかし、同国のオーガニック製品に対する1人当たりの支出額は、2021年には0.49米ドルと、この地域の他の国に比べて少ないです。メキシコ市場に参入する参入企業が増えれば、同国における有機製品の需要が高まると予想されます。
北米のバイオ肥料産業の概要
北米のバイオ肥料市場はセグメント化されており、上位5社で11.29%を占めています。この市場の主要企業は、Lallemand Inc.、Novozymes、Rizobacter、Sustane Natural Fertilizer、Inc、Symborg Inc.などです。
その他の特典
- エクセル形式の市場予測(ME)シート
- 3ヶ月のアナリストサポート
目次
第1章 エグゼクティブサマリーと主要調査結果
第2章 レポートのオファー
第3章 イントロダクション
- 調査の前提条件と市場定義
- 調査範囲
- 調査手法
第4章 主要産業動向
- 有機栽培面積
- 一人当たりのオーガニック製品への支出
- 規制の枠組み
- カナダ
- メキシコ
- 米国
- バリューチェーンと流通チャネル分析
第5章 市場セグメンテーション
- 形態
- アゾスピリラム
- アゾトバクタ
- 菌根菌
- リン酸可溶菌
- 根粒菌
- その他のバイオ肥料
- 作物タイプ
- 換金作物
- 園芸作物
- 畑作物
- 国名
- カナダ
- メキシコ
- 米国
- その他の北米地域
第6章 競争情勢
- 主要な戦略動向
- 市場シェア分析
- 企業情勢
- 企業プロファイル
- Agriculture Solutions Inc.
- BIOQUALITUM SA de CV
- Indogulf BioAg LLC(Indogulf Companyのバイオテク部門)
- Koppert Biological Systems Inc.
- Lallemand Inc.
- Novozymes
- Rizobacter
- Sustane Natural Fertilizer, Inc
- Symborg Inc.
- The Andersons Inc.
第7章 CEOへの主要戦略的質問
第8章 付録
- 世界概要
- 概要
- ファイブフォース分析フレームワーク
- 世界のバリューチェーン分析
- 市場力学(DROs)
- 情報源と参考文献
- 図表一覧
- 主要な洞察
- データパック
- 用語集
目次
Product Code: 500014
The North America Biofertilizer Market size is estimated at 1.3 billion USD in 2025, and is expected to reach 2.12 billion USD by 2030, growing at a CAGR of 10.31% during the forecast period (2025-2030).
- Biofertilizers are organic substances with living microorganisms that promote plant growth. The biofertilizer market value increased by about 49.3% from 2017 to 2021, attributed to the increasing awareness among farmers, the increasing overall registered organic farms in the region, and the shifting demand for organically or sustainably grown commodities.
- Mycorrhiza-based biofertilizers accounted for about 25.6% of the market value in 2022, mainly because their application can reduce the use of chemical fertilizers, particularly phosphorus, by up to 30%.
- Rhizobium-based biofertilizers dominated the North American biofertilizer market and accounted for about 36.5% of the market value in 2022, mainly due to their ability to decrease the overall dependence on inorganic nitrogen fertilizers.
- Azospirillum-based biofertilizers accounted for about 21.6% of the total market value in 2022. Azospirillum is involved in atmospheric nitrogen fixation in a wide range of crops, particularly in cereal crops like rice, maize, sorghum, wheat, and millet.
- Continuous research is being conducted to develop strains that are biotic/abiotic stress-tolerant. Under salinity stress, Rhizobium trifolii inoculated with Trifoliumalexandrinum showed increased biomass and nodulation.
- The increasing awareness about the overuse of fertilizers among farmers and the government initiatives to support sustainable agricultural practices and organic farming resulted in a rising demand for biofertilizers. Therefore, the market for biofertilizers is anticipated to increase between 2023 and 2029.
- The United States dominated the North American biofertilizer market and accounted for about 45.6% of the market value in 2022. The dominance of the United States is mainly due to its large organic cultivation area in the region, which accounts for 39.5% of the total organic crop area.
- Canada is the second largest biofertilizer market, followed by the United States in the North American region. In 2022, Canada accounted for about 33.2% of the total biofertilizer market value in the region. Row crop cultivation is dominant in the country, and soybean, rapeseed, and wheat are some of the major crops cultivated in the country.
- Despite having the second-largest organic area in the North American region, Mexico accounted for only 18.2% of the biofertilizers market value in 2022. This is mainly attributed to lower application rates of biofertilizers in the country. The total biofertilizer volume consumption accounted for 3.3 thousand metric tons in 2022.
- The major agricultural countries in the rest of North America are Costa Rica, Cuba, Jamaica, and Guatemala. In these countries, cash crop cultivation is dominant compared to row and horticultural crops. Cash crop cultivation accounted for about 92.0% of the total organic crop area available in the rest of North America in 2022. The major cash crops grown in these countries are coffee, sugarcane, and spices.
- The biofertilizer market in the North American region is anticipated to increase at a higher pace in the United States compared to other countries in the region, which is attributed to various reasons like awareness among growers on sustainability and government initiatives for sustainable cultivation.
North America Biofertilizer Market Trends
Organic produce demand grows in major countries like the United States, increasing cultivation area with government support
- The area under organic cultivation of crops in North America was recorded at 1.5 million hectares in 2021, according to the data provided by FibL statistics. The organic area in the region increased by 13.5% between 2017 and 2022. Among the North American countries, the United States was dominant, with 623.0 thousand hectares of agricultural land under organic farming, with California, Maine, and New York being the major states practicing agriculture.
- The United States is followed by Mexico, with 531.1 thousand hectares of area under organic farming in 2021. Mexico is among the top 20 organic food producers in the world. Mexico is the largest exporter of organic coffee in the world, according to Global Coffee Masters data. The country has the largest area under organic coffee production and even in terms of the number of organic coffee producers in the country. The major organic food-producing states in the country include Chiapas, Oaxaca, Michoacan, Chihuahua, and Guerrero, which accounted for 80.0% of the total organic area in the country in 2021. Organizations such as National Association for Organic Agriculture promote organic agriculture in the country, which is expected to motivate more farmers to take up organic agriculture. In addition to financial assistance, the Mexican government supports research and development activities to help promote organic agriculture.
- Canada's area under organic crop cultivation increased from 0.4 million hectares in 2017 to 0.45 million hectares in 2021. Row crops occupied the maximum area with 0.42 million hectares in 2021. The Canadian government announced a sum of USD 297,330 in 2021 as Organic Development Fund to support organic farmers. These initiatives are expected to increase the organic area in the region.
Growing demand for organic produce in domestic and international markets, rise in per capita spending on organic food
- North America's average per capita spending on organic food products was USD 109.7 in 2021. The per capita spending in the United States is the highest among the North American countries, with average spending of USD 186.7 in 2021. The sales of organic products in the United States crossed USD 63.00 billion in 2021. Organic Tarde Association accounted for a 2.0% increase over the previous year, with organic food sales at USD 57.5 billion in 2021. Organic fruits and vegetables accounted for 15.0% of the total organic product sales, valued at USD 21.0 billion in 2021.
- Organic food sales in Canada reached a value of USD 8.10 billion in 2020, as per the data reported by the Organic Federation of Canada. It is reported that Canada is the 6th largest market in the world for Organic products, with the supply of organic products failing to keep up with the demand in the country. The average spending on organic food per person was USD 142.6 in 2021. Increasing government support to retailers is expected to increase the availability, accessibility, and affordability of organic products in the country. Organic Tarde Association estimated the organic products market in Canada to grow and register a CAGR of 6.3% between 2021 and 2026.
- In 2021, Mexico registered a market size of USD 63.0 million for organic products with a global rank of 35. It is estimated to grow and register a CAGR of 7.2% between 2021 and 2026. However, the per capita spending on organic products in the country is less than in other countries in the region, with a value of USD 0.49 in 2021. More players entering the market in Mexico are expected to increase the demand for organic products in the country.
North America Biofertilizer Industry Overview
The North America Biofertilizer Market is fragmented, with the top five companies occupying 11.29%. The major players in this market are Lallemand Inc., Novozymes, Rizobacter, Sustane Natural Fertilizer, Inc and Symborg Inc. (sorted alphabetically).
Additional Benefits:
- The market estimate (ME) sheet in Excel format
- 3 months of analyst support
TABLE OF CONTENTS
1 EXECUTIVE SUMMARY & KEY FINDINGS
2 REPORT OFFERS
3 INTRODUCTION
- 3.1 Study Assumptions & Market Definition
- 3.2 Scope of the Study
- 3.3 Research Methodology
4 KEY INDUSTRY TRENDS
- 4.1 Area Under Organic Cultivation
- 4.2 Per Capita Spending On Organic Products
- 4.3 Regulatory Framework
- 4.3.1 Canada
- 4.3.2 Mexico
- 4.3.3 United States
- 4.4 Value Chain & Distribution Channel Analysis
5 MARKET SEGMENTATION (includes market size in Value in USD and Volume, Forecasts up to 2030 and analysis of growth prospects)
- 5.1 Form
- 5.1.1 Azospirillum
- 5.1.2 Azotobacter
- 5.1.3 Mycorrhiza
- 5.1.4 Phosphate Solubilizing Bacteria
- 5.1.5 Rhizobium
- 5.1.6 Other Biofertilizer
- 5.2 Crop Type
- 5.2.1 Cash Crops
- 5.2.2 Horticultural Crops
- 5.2.3 Row Crops
- 5.3 Country
- 5.3.1 Canada
- 5.3.2 Mexico
- 5.3.3 United States
- 5.3.4 Rest of North America
6 COMPETITIVE LANDSCAPE
- 6.1 Key Strategic Moves
- 6.2 Market Share Analysis
- 6.3 Company Landscape
- 6.4 Company Profiles (includes Global Level Overview, Market Level Overview, Core Business Segments, Financials, Headcount, Key Information, Market Rank, Market Share, Products and Services, and Analysis of Recent Developments).
- 6.4.1 Agriculture Solutions Inc.
- 6.4.2 BIOQUALITUM SA de CV
- 6.4.3 Indogulf BioAg LLC (Biotech Division of Indogulf Company)
- 6.4.4 Koppert Biological Systems Inc.
- 6.4.5 Lallemand Inc.
- 6.4.6 Novozymes
- 6.4.7 Rizobacter
- 6.4.8 Sustane Natural Fertilizer, Inc
- 6.4.9 Symborg Inc.
- 6.4.10 The Andersons Inc.
7 KEY STRATEGIC QUESTIONS FOR AGRICULTURAL BIOLOGICALS CEOS
8 APPENDIX
- 8.1 Global Overview
- 8.1.1 Overview
- 8.1.2 Porter's Five Forces Framework
- 8.1.3 Global Value Chain Analysis
- 8.1.4 Market Dynamics (DROs)
- 8.2 Sources & References
- 8.3 List of Tables & Figures
- 8.4 Primary Insights
- 8.5 Data Pack
- 8.6 Glossary of Terms

