
中国の飼料用プロバイオティクス市場:市場シェア分析、産業動向と統計、成長予測(2025年~2030年)
China Feed Probiotics - Market Share Analysis, Industry Trends & Statistics, Growth Forecasts (2025 - 2030)- 発行日
- ページ情報
- 英文 192 Pages
- 納期
- 2~3営業日
- 商品コード
- 1693740
- カスタマイズ可能 お客様のご希望に応じて、既存データの加工や未掲載情報(例:国別セグメント)の追加などの対応が可能です。詳細はお問い合わせください。
- 適宜更新あり 本レポートは最新情報反映のため適宜更新し、内容構成変更を行う場合があります。ご検討の際はお問い合わせください。
- 翻訳ツール提供対象 PDF対応AI翻訳ツールの無料貸し出しサービスのご利用が可能です
概要
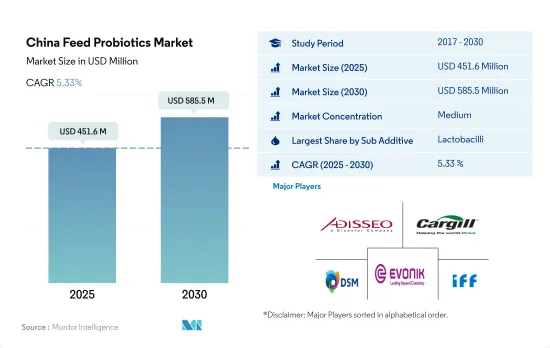
中国の飼料用プロバイオティクス市場規模は2025年に4億5,160万米ドルと推定され、2030年には5億8,550万米ドルに達すると予測され、予測期間(2025~2030年)のCAGRは5.33%で成長する見込みです。
- 中国の飼料プロバイオティクス市場は、2022年にほぼ4億米ドルの価値を記録し、地域の飼料添加物市場のほぼ9%を占めました。中国はアジア太平洋で最大の飼料プロバイオティクス市場を記録し、2022年には地域市場シェアの44%を占めました。市場は2020年には減少したが、2020年のCOVID-19パンデミック時に停止していた全事業の再開後の飼料生産の増加と食肉・乳製品への高い需要により、2021年には48.1%増加しました。
- 中国の飼料用プロバイオティクス市場で最もよく使用されているプロバイオティクスは乳酸菌で、2022年には約1億4,000万米ドルの値を占め、ビフィズス菌、腸球菌、ペディオコッカスがこれに続きました。乳酸菌が好まれるのは、消化器系を刺激し、病気の原因菌と戦い、体内でビタミンの生成を助けるからです。
- 中国の飼料用プロバイオティクス市場では、家禽類が最大の動物タイプのひとつで、2022年の市場シェア全体の46.5%を占めました。家禽用プロバイオティクスのシェアが高いのは、その配合数、投与率が高く、ブロイラーとレイヤーの両方で使用されているためです。中国の家禽用飼料生産量は、2022年には1億トンを超えます。同市場は、飼料生産量の増加に大きな影響を受けています。
- ビフィズス菌、乳酸桿菌、ペディオコッカス、連鎖球菌はいずれも同様の成長率を示しています。これらの品種は、国内での商業的な工場畜産の増加と健康的な動物飼料に対する意識の高まりにより、予測期間中にCAGR 5.4%を記録すると予想されます。飼料用プロバイオティクス市場全体の予測期間中のCAGRは5.3%と予測されます。
中国の飼料プロバイオティクス市場動向
家禽製品の一人当たり消費量の増加と、豚に影響を与えたアフリカ豚熱(ASF)が家禽需要と家禽生産の増加に貢献
- 中国の家禽産業は世界市場で支配的な地位を占めており、主要な家禽生産者は北京、天津、上海、山東、広東に位置しています。この産業の成長の主要因は、人口の増加と都市化、所得水準の向上、豚肉の供給減少につながったアフリカ豚フィーバーの発生による鶏肉への消費者の嗜好の変化です。2017~2022年にかけて、中国の1人当たりの鶏肉消費量は2.06kg増加し、それによって鶏肉製品の需要がさらに促進されました。
- 同国の養鶏産業は鶏、アヒル、ウズラを生産しています。鶏は主要な家禽であり、2022年には4億9,590万頭、世界の鶏卵生産の40%を占めます。国内最大のレイヤー・ファーミングセンターでは年間9億羽を超える採卵鶏と6,000万羽のヒナが孵化しており、レイヤー・ファーミングの採用が増加しています。中国における鶏肉の消費は、その有利な価格、高タンパク食への意識の高まり、消費者の嗜好の変化により増加しました。その結果、鶏肉需要を満たすためにブロイラーの生産が増加しています。生産性を向上させ、鶏肉製品の需要増に対応するため、2021年にブロイラーの国産遺伝子の3品種(Shengze 901、Guangming No.2、Wode 188)が発表されました。
- 同市場における継続的な投資、商業化、新品種・改良品種のリリースは、家禽の生産量の増加と一人当たりの消費量の増加と相まって、予測期間中、中国の家禽産業の成長を牽引すると予想されます。家禽の健康上の利点と栄養価に対する意識の高まりが、同国における家禽産業の成長を促進すると予想されます。
水産物の需要増加と生産者の従来型飼料から配合飼料への移行により、水産養殖種用の飼料生産が増加しています。
- 中国の養殖用飼料生産量は2022年に54.1%の大幅増を記録し、2,280万トンに達しました。しかし、COVID-19の発生とそれに伴う飼料産業の閉鎖により、2020年の生産量は21.3%減少しました。中国における養殖生産の急速な拡大は、同国における水産物需要の増加と飼料生産ユニットの拡大によってもたらされています。例えば、Grobest Chinaは広東省雷州市に新しい養殖飼料工場を設立し、3,770万米ドルの投資額を投じ、年間生産能力は25万トンとなりました。
- 魚は中国における主要な養殖種です。魚の養殖量が2018年の3,740万トンから2022年には3,750万トンに増加したため、飼料需要が高まり、2022年の飼料生産量は3.2%増加しました。生産者は、栄養管理と適正養殖に関する意識の高まりにより、従来の飼料から配合飼料にシフトしています。
- 2022年には、エビは同国の水産飼料市場の2.9%のシェアを占め、60万トンの生産量を記録しました。中国におけるエビ飼料の需要は、中国の消費者が栄養転換期を迎えていることから、エビの需要増によって強く牽引されています。エビは抗酸化物質とアスタキサンチンの優れた供給源であり、神経系と筋骨格系を強化します。養殖セクタの急速な拡大と養殖生産における栄養管理に対する意識の高まりが、予測期間中の市場を押し上げると予想されます。
中国の飼料用プロバイオティクス産業概要
中国の飼料用プロバイオティクス市場は適度に統合されており、上位5社で44.21%を占めています。この市場の主要企業は、Adisseo、Cargill Inc.、DSM Nutritional Products AG、Evonik Industries AG、IFF(Danisco Animal Nutrition)などです。
その他の特典
- エクセル形式の市場予測(ME)シート
- 3ヶ月のアナリストサポート
目次
第1章 エグゼクティブサマリーと主要調査結果
第2章 レポートのオファー
第3章 イントロダクション
- 調査の前提条件と市場定義
- 調査範囲
- 調査手法
第4章 主要産業動向
- 動物頭数
- 家禽
- 反芻動物
- 豚
- 飼料生産
- 水産養殖
- 家禽
- 反芻動物
- 養豚
- 規制の枠組み
- 中国
- バリューチェーンと流通チャネル分析
第5章 市場セグメンテーション
- サブ添加物
- ビフィズス菌
- 腸球菌
- 乳酸菌
- ペディオコッカス
- レンサ球菌
- その他のプロバイオティクス
- 動物
- 水産養殖
- サブ動物別
- 魚類
- エビ
- その他の養殖種
- 家禽類
- 小動物別
- ブロイラー
- レイヤー
- その他の鳥類
- 反芻動物
- 小動物別
- 肉牛
- 乳牛
- その他の反芻動物
- 豚
- その他の動物
- 水産養殖
第6章 競争情勢
- 主要な戦略的動き
- 市場シェア分析
- 企業情勢
- 企業プロファイル
- Adisseo
- Behn Meyer
- Cargill Inc.
- CHR. Hansen A/S
- DSM Nutritional Products AG
- Evonik Industries AG
- IFF(Danisco Animal Nutrition)
- Kemin Industries
- Kerry Group PLC
- Lallemand Inc.
第7章 CEOへの主要戦略的質問
第8章 付録
- 世界概要
- 概要
- ファイブフォース分析フレームワーク
- 世界のバリューチェーン分析
- 世界市場規模とDRO
- 情報源と参考文献
- 図表リスト
- 主要な洞察
- データパック
- 用語集
目次
Product Code: 93774
The China Feed Probiotics Market size is estimated at 451.6 million USD in 2025, and is expected to reach 585.5 million USD by 2030, growing at a CAGR of 5.33% during the forecast period (2025-2030).
- The feed probiotics market in China recorded a value of almost USD 0.4 billion in 2022, accounting for almost 9% of the regional feed additives market. China registered the largest feed probiotics market in the Asia-Pacific region, accounting for 44% of the regional market share in 2022. The market declined in 2020, but it increased by 48.1% in 2021 due to increased feed production and high demand for meat and dairy products after the resumption of all operations that were stopped during the COVID-19 pandemic in 2020.
- Lactobacillus was the most commonly used probiotic in China's feed probiotics market, accounting for a value of almost USD 0.14 billion in 2022, followed by bifidobacterium, enterococcus, and pediococcus. Lactobacillus is favored because it stimulates the digestive system, fights disease-causing bacteria, and helps produce vitamins in the body.
- Poultry birds were among the largest animal types in the feed probiotics market in China, accounting for 46.5% of the total market share in 2022. The share of probiotics for poultry birds is high due to their higher count, dosage rates, and their usage in both broilers and layers. The feed production of poultry birds in China accounted for more than 0.1 billion metric tons in 2022. The market is highly influenced by the rising level of feed production.
- Bifidobacterium, lactobacillus, pediococcus, and streptococcus are all growing at a similar rate. These varieties are expected to record a CAGR of 5.4% during the forecast period due to the growing commercial factory farming in the country and the rising awareness of healthy animal feed. The overall feed probiotics market is expected to witness a CAGR of 5.3% during the forecast period.
China Feed Probiotics Market Trends
Increasing per capita consumption of poultry products and African Swine Fever (ASF) affecting swine helped in increasing the poultry demand and poultry production
- China's poultry industry holds a dominant position in the global market, with the major producers of poultry located in Beijing, Tianjin, Shanghai, Shandong, and Guangdong. The growth of this industry is primarily attributed to rising population and urbanization, increased income levels, and shifting consumer preferences toward poultry meat as a result of the African Swine Fever outbreak that led to a reduction in the supply of pork. From 2017 to 2022, China's per capita consumption of poultry increased by 2.06 kg, thereby further driving the demand for poultry products.
- The country's poultry industry produces chickens, ducks, and quails. Chicken is the major poultry bird, which accounted for 495.9 million heads and 40% of the global egg production in 2022. The adoption of layer farming is rising as over 900 million stock-laying hens and 60 million chicks are hatching annually at the country's largest layer farming center. The consumption of poultry meat in China increased due to its favorable prices, increasing awareness of high-protein diets, and a shift in consumers' preferences. As a result, broilers are being grown to meet the demand for poultry meat. To improve productivity and meet the rising demand for poultry products, three domestic varieties of broiler genetics were released in 2021, which were Shengze 901, Guangming No. 2, and Wode 188.
- The continued investment, commercialization, and release of new and improved breeds in the market, coupled with the rising production of poultry and increasing per capita consumption, are expected to drive the growth of the poultry industry in China during the forecast period. Increasing awareness of the health benefits and nutritional value of poultry is anticipated to fuel the growth of the poultry industry in the country.
Rising demand for seafood and shifting of producers from conventional feed to compound feed is increasing the feed production for aquaculture species
- Aquaculture feed production in China witnessed a significant rise of 54.1% in 2022, reaching 22.8 million metric tons. However, there was a 21.3% drop in volumes in 2020 due to the COVID-19 outbreak and the resulting closure of feed industries. The rapid expansion of aquaculture production in China is driven by the increasing demand for seafood in the country and the expansion of feed production units. For instance, Grobest China established a new aquaculture feed factory in Guangdong Leizhou, putting in an investment value of USD 37.7 million and resulting in an annual production capacity of 250,000 tons.
- Fish is the primary aquaculture species in China. Feed production increased by 3.2% in 2022 due to the rising demand for feed as the cultivation volume of fish increased to 37.5 million metric tons in 2022 from 37.4 million metric tons in 2018. Producers are shifting from conventional feed to compound feed due to the increasing awareness about nutrient management and good farming practices.
- In 2022, shrimp accounted for 2.9% of the aquafeed market's share in the country, registering a production volume of 0.6 million metric tons. The demand for shrimp feed in China is strongly driven by the increasing demand for shrimps, as Chinese consumers are undergoing a nutritional transition. Shrimps are a good source of antioxidants and astaxanthin, which bolster the nervous and musculoskeletal systems. The rapid expansion of the aquaculture sector and increasing awareness about nutrient management in aquaculture production are expected to boost the market during the forecast period.
China Feed Probiotics Industry Overview
The China Feed Probiotics Market is moderately consolidated, with the top five companies occupying 44.21%. The major players in this market are Adisseo, Cargill Inc., DSM Nutritional Products AG, Evonik Industries AG and IFF(Danisco Animal Nutrition) (sorted alphabetically).
Additional Benefits:
- The market estimate (ME) sheet in Excel format
- 3 months of analyst support
TABLE OF CONTENTS
1 EXECUTIVE SUMMARY & KEY FINDINGS
2 REPORT OFFERS
3 INTRODUCTION
- 3.1 Study Assumptions & Market Definition
- 3.2 Scope of the Study
- 3.3 Research Methodology
4 KEY INDUSTRY TRENDS
- 4.1 Animal Headcount
- 4.1.1 Poultry
- 4.1.2 Ruminants
- 4.1.3 Swine
- 4.2 Feed Production
- 4.2.1 Aquaculture
- 4.2.2 Poultry
- 4.2.3 Ruminants
- 4.2.4 Swine
- 4.3 Regulatory Framework
- 4.3.1 China
- 4.4 Value Chain & Distribution Channel Analysis
5 MARKET SEGMENTATION (includes market size in Value in USD and Volume, Forecasts up to 2030 and analysis of growth prospects)
- 5.1 Sub Additive
- 5.1.1 Bifidobacteria
- 5.1.2 Enterococcus
- 5.1.3 Lactobacilli
- 5.1.4 Pediococcus
- 5.1.5 Streptococcus
- 5.1.6 Other Probiotics
- 5.2 Animal
- 5.2.1 Aquaculture
- 5.2.1.1 By Sub Animal
- 5.2.1.1.1 Fish
- 5.2.1.1.2 Shrimp
- 5.2.1.1.3 Other Aquaculture Species
- 5.2.2 Poultry
- 5.2.2.1 By Sub Animal
- 5.2.2.1.1 Broiler
- 5.2.2.1.2 Layer
- 5.2.2.1.3 Other Poultry Birds
- 5.2.3 Ruminants
- 5.2.3.1 By Sub Animal
- 5.2.3.1.1 Beef Cattle
- 5.2.3.1.2 Dairy Cattle
- 5.2.3.1.3 Other Ruminants
- 5.2.4 Swine
- 5.2.5 Other Animals
- 5.2.1 Aquaculture
6 COMPETITIVE LANDSCAPE
- 6.1 Key Strategic Moves
- 6.2 Market Share Analysis
- 6.3 Company Landscape
- 6.4 Company Profiles (includes Global Level Overview, Market Level Overview, Core Business Segments, Financials, Headcount, Key Information, Market Rank, Market Share, Products and Services, and Analysis of Recent Developments).
- 6.4.1 Adisseo
- 6.4.2 Behn Meyer
- 6.4.3 Cargill Inc.
- 6.4.4 CHR. Hansen A/S
- 6.4.5 DSM Nutritional Products AG
- 6.4.6 Evonik Industries AG
- 6.4.7 IFF(Danisco Animal Nutrition)
- 6.4.8 Kemin Industries
- 6.4.9 Kerry Group PLC
- 6.4.10 Lallemand Inc.
7 KEY STRATEGIC QUESTIONS FOR FEED ADDITIVE CEOS
8 APPENDIX
- 8.1 Global Overview
- 8.1.1 Overview
- 8.1.2 Porter's Five Forces Framework
- 8.1.3 Global Value Chain Analysis
- 8.1.4 Global Market Size and DROs
- 8.2 Sources & References
- 8.3 List of Tables & Figures
- 8.4 Primary Insights
- 8.5 Data Pack
- 8.6 Glossary of Terms
中国の飼料用プロバイオティクス市場:市場シェア分析、産業動向と統計、成長予測(2025年~2030年)
- 発行日
- 発行
- Mordor Intelligence
- ページ情報
- 英文 192 Pages
- 納期
- 2~3営業日


