
インドの飼料用プロバイオティクス-市場シェア分析、産業動向・統計、成長予測(2025~2030年)
India Feed Probiotics - Market Share Analysis, Industry Trends & Statistics, Growth Forecasts (2025 - 2030)- 発行日
- ページ情報
- 英文 189 Pages
- 納期
- 2~3営業日
- 商品コード
- 1693743
- カスタマイズ可能 お客様のご希望に応じて、既存データの加工や未掲載情報(例:国別セグメント)の追加などの対応が可能です。詳細はお問い合わせください。
- 適宜更新あり 本レポートは最新情報反映のため適宜更新し、内容構成変更を行う場合があります。ご検討の際はお問い合わせください。
- 翻訳ツール提供対象 PDF対応AI翻訳ツールの無料貸し出しサービスのご利用が可能です
概要
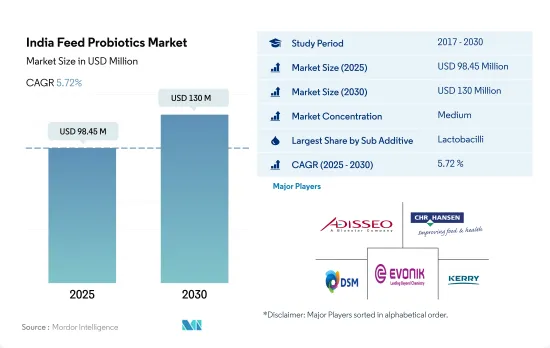
インドの飼料用プロバイオティクス市場規模は2025年に9,845万米ドルと推定され、2030年には1億3,000万米ドルに達すると予測され、予測期間(2025~2030年)のCAGRは5.72%で成長する見込みです。
- インドでは、飼料プロバイオティクス市場は飼料添加物市場全体の中で重要な位置を占めています。2022年には飼料添加物市場全体のほぼ8.7%を占め、その市場規模は約8,360万米ドルでした。特に水産養殖種と家禽鳥類における飼料生産の増加により、2019年の市場規模は2018年と比較して14.8%増加しました。
- すべての飼料プロバイオティクスタイプの中で、乳酸菌は国内最大のシェアを占め、2022年には約2,980万米ドルと評価されました。同国における乳酸菌のシェアが高いのは、消化器系を刺激し、病気の原因となる細菌と闘い、動物の病気の発生を回避するのに不可欠なビタミンの生成を助けるその能力によるものです。2022年には、ビフィズス菌、腸球菌、ペディオコッカスが乳酸菌に続いて国内で使用されるようになりました。
- インドでは家禽類が最も重要な動物タイプであり、2022年の飼料用プロバイオティクス市場全体の67.9%を占めています。家禽類におけるプロバイオティクスのシェアが高いのは、頭数と投与率が高いためです。商業的畜産の増加に伴い、ビフィズス菌は飼料プロバイオティクスタイプの中で最も急速に成長しており、予測期間中のCAGRは5.9%と推定されます。
- 全体として、インドの飼料用プロバイオティクス市場は成長し、予測期間中にCAGR 5.7%を記録すると予想されます。同国では商業的農業が拡大し、動物の健康と栄養に対する意識が高まっているため、市場は大きな可能性を秘めています。動物性タンパク質に対する需要の増加と健康への関心の高まりにより、インドでは飼料用プロバイオティクスの需要が伸びると予想されます。
インドの飼料用プロバイオティクス市場動向
家禽肉と卵の消費需要の増加により家禽の生産量は増加しているが、鳥インフルエンザなどの疾病が家禽人口に悪影響を及ぼしています。
- インドの家禽産業は、卵とブロイラー肉の世界最大の生産者のひとつです。近年、同産業は、主に鶏肉と卵の消費量の増加に牽引され、2017~2022年の鶏肉生産量の7.1%増に拍車をかけ、大きな変貌を遂げました。同国の1人当たりの鶏肉消費量は2022年に2.65kgに達し、2017年から13.7%増加しました。卵の一人当たりの入手可能量は、2021年には前年より4個多い年間91個に上昇しました。
- インドの鶏肉市場は主にアンドラ・プラデシュ州、タミル・ナードゥ州、テランガナ州に集中しており、国内の生産量のかなりの部分を占めています。鶏肉産業は世界市場における重要な参入企業としての地位を確立し、2021~22年に輸出された鶏肉製品は320,240.46トン、7,104万米ドルに達しました。インドの鶏肉製品の主要輸入国は、オマーン、モルディブ、インドネシア、ベトナム、日本、ロシアなどです。
- しかし、同国の養鶏産業はいくつかの課題に直面しています。鳥インフルエンザやその他の病気が発生したため、家禽の淘汰が行われ、多額の経済的損失が生じた。さらに、飼料価格の高騰、加工・貯蔵施設の不備、信用供与の制限といった問題にも悩まされています。こうした課題を克服するには、政府の支援とともに、インフラや技術への多額の投資が必要です。全体として、輸入国における鶏肉需要の増加と国内需要の増加が、インドにおける鶏肉生産の大幅な増加につながりました。
インドは第3位の魚生産国であり、水産物の需要の急増と政府の取り組みにより、水産飼料の需要と生産が増加しています。
- インドの水産養殖産業は、水産物の需要急増により著しい成長を遂げ、水産飼料市場の急成長につながりました。2022年、同国の養殖飼料生産量は220万トンに達し、2017~2022年比で48.6%増加したが、これは主にインドにおける養殖の増加によるものです。インドの水産飼料市場は魚類飼料が圧倒的に多く、2022年には同国の水産飼料生産量全体の87%を占め、次いでエビ飼料が6.6%でした。魚の需要は国内外で高まっており、同国の高品質魚の需要を維持するためには水産飼料市場が不可欠となっています。
- インドは世界第3位の魚生産国で、世界生産量の7.96%を占めています。2020年から21年にかけて、同国は1,470万トンの魚を生産しました。さらに、アンドラ・プラデシュ州はインド最大の魚飼料消費州であり、西ベンガル州がそれに続きます。エビ飼料の生産量は2018年から75.6%増加したが、これは主にエビの世界の需要の急増によるものです。このため、水産飼料メーカーは需要増に対応するために大量のエビ飼料を生産することになりました。
- 水産飼料に対する需要の増加は、新しい池の建設、飼料の購入、加工ユニットの設置に対する補助金や奨励金の提供など、養殖セクタに対する政府の取り組みや投資の拡大と相まって、今後数年間におけるインドの水産飼料市場の成長を促進すると予想されます。水産飼料市場の拡大は、インド経済の発展を支え、雇用機会を創出し、食糧安全保障に貢献すると期待されています。
インドの飼料用プロバイオティクス産業概要
インドの飼料用プロバイオティクス市場は適度に統合されており、上位5社で55.26%を占めています。この市場の主要企業は、Adisseo、CHR. Hansen A/S、DSM Nutritional Products AG、Evonik Industries AG、Kerry Group PLCなどです。
その他の特典
- エクセル形式の市場予測(ME)シート
- 3ヶ月のアナリストサポート
目次
第1章 エグゼクティブサマリーと主要調査結果
第2章 レポートのオファー
第3章 イントロダクション
- 調査の前提条件と市場定義
- 調査範囲
- 調査手法
第4章 主要産業動向
- 動物頭数
- 家禽
- 反芻動物
- 豚
- 飼料生産
- 水産養殖
- 家禽
- 反芻動物
- 養豚
- 規制の枠組み
- インド
- バリューチェーンと流通チャネル分析
第5章 市場セグメンテーション
- サブ添加物
- ビフィズス菌
- 腸球菌
- 乳酸菌
- ペディオコッカス
- レンサ球菌
- その他のプロバイオティクス
- 動物
- 水産養殖
- サブ動物別
- 魚類
- エビ
- その他の養殖種
- 家禽類
- 小動物別
- ブロイラー
- レイヤー
- その他の鳥類
- 反芻動物
- 小動物別
- 肉牛
- 乳牛
- その他の反芻動物
- 豚
- その他の動物
- 水産養殖
第6章 競争情勢
- 主要な戦略的動き
- 市場シェア分析
- 企業情勢
- 企業プロファイル
- Adisseo
- Blue Aqua International Co. Ltd
- Cargill Inc.
- CHR. Hansen A/S
- DSM Nutritional Products AG
- Evonik Industries AG
- IFF(Danisco Animal Nutrition)
- Kemin Industries
- Kerry Group PLC
- Marubeni Corporation(Orffa International Holding B.V.)
第7章 CEOへの主要戦略的質問
第8章 付録
- 世界概要
- 概要
- ファイブフォース分析フレームワーク
- 世界のバリューチェーン分析
- 世界市場規模とDRO
- 情報源と参考文献
- 図表リスト
- 主要な洞察
- データパック
- 用語集
目次
Product Code: 93777
The India Feed Probiotics Market size is estimated at 98.45 million USD in 2025, and is expected to reach 130 million USD by 2030, growing at a CAGR of 5.72% during the forecast period (2025-2030).
- In India, the feed probiotics market is a significant part of the total feed additives market. It accounted for almost 8.7% of the total feed additives market in 2022, valued at nearly USD 83.6 million. The market value increased by 14.8% in 2019 compared to 2018 due to increased feed production, especially in aquaculture species and poultry birds.
- Among all the feed probiotic types, lactobacilli occupied the largest share in the country, valued at almost USD 29.8 million in 2022. The higher share of lactobacilli in the country was due to its ability to stimulate the digestive system, fight disease-causing bacteria, and help produce vitamins, which are essential in avoiding the occurrence of diseases in animals. Bifidobacteria, Enterococcus, and Pediococcus followed lactobacilli in usage in the country in 2022.
- Poultry birds were the most significant animal type in India, occupying 67.9% of the total feed probiotics market in 2022. The higher share of probiotics in poultry birds was due to the higher headcount and dosage rates. With the growing commercial farming, Bifidobacteria is the fastest-growing feed probiotic type, with an estimated growth rate of CAGR of 5.9% during the forecast period.
- Overall, the feed probiotics market is expected to grow and register a CAGR of 5.7% during the forecast period in India. The market has significant potential in the country, owing to the growing commercial farming and increased awareness about animal health and nutrition. With the increasing demand for animal protein and rising health concerns, the demand for feed probiotics is expected to grow in India.
India Feed Probiotics Market Trends
Rising demand for poultry meat and egg consumption is increasing the poultry production but diseases such as Avian Influenza had negative impact on poultry population
- The Indian poultry industry is one of the largest producers of eggs and broiler meat worldwide. In recent years, the industry went through significant transformations, driven primarily by the rise in poultry meat and egg consumption, which fueled a 7.1% increase in poultry production in 2022 from 2017. The country's per capita consumption of poultry meat reached 2.65 kg in 2022, a 13.7% increase from 2017. The per capita availability of eggs rose to 91 per annum in 2021, which was four more units than in the previous year.
- The Indian poultry market is primarily concentrated in Andhra Pradesh, Tamil Nadu, and Telangana, accounting for a significant portion of the country's production. The poultry industry established itself as a significant player in the global market, with 320,240.46 metric tons of poultry products exported during 2021-22, amounting to USD 71.04 million. Major importers of Indian poultry products include Oman, Maldives, Indonesia, Vietnam, Japan, and Russia.
- However, the poultry industry in the country encountered several challenges. The outbreak of avian influenza and other diseases in poultry led to the culling of birds, resulting in substantial financial losses. Additionally, the industry is plagued by issues such as high feed costs, inadequate processing and storage facilities, and limited access to credit. Overcoming these challenges requires significant investments in infrastructure and technology, along with government support. Overall, the increasing demand for poultry meat in importing countries and rising domestic demand led to a significant increase in poultry production in India.
India being third largest fish producing country and the surge in demand for seafood as well as the government's initiatives is increasing the aqua feed demand and production
- The Indian aquaculture industry experienced significant growth due to the surge in demand for seafood, leading to a sudden increase in the growth of the aquafeed market. In 2022, the country's aquaculture feed production reached 2.2 million metric tons, a 48.6% increase from 2017-2022, primarily driven by the increasing aquaculture in India. Fish feed dominated the aquafeed market in India, accounting for 87% of the total aquafeed production in the country, followed by shrimp feed at 6.6% in 2022. The demand for fish is rising domestically and internationally, making it essential for the aqua feed market to maintain the demand for high-quality fish in the country.
- India is the world's third-largest fish-producing country, contributing 7.96% to global production. During 2020-21, the country produced 14.7 million metric ton of fish. Additionally, Andhra Pradesh is the largest fish-feed-consuming state in India, followed by West Bengal, owing to its high fish production in the country. Shrimp feed production grew by 75.6% from 2018, mainly due to the surging global demand for shrimp. This led to aquafeed manufacturers producing large quantities of shrimp feed to cater to the growing demand.
- The increasing demand for seafood, coupled with the government's initiatives and growing investments in the aquaculture sector, such as offering subsidies and incentives for the construction of new ponds, purchasing feeds, and setting up processing units, is expected to fuel the growth of the aquafeed market in India in the coming years. The expansion of the aquafeed market is expected to support the development of the Indian economy, create employment opportunities, and contribute to food security.
India Feed Probiotics Industry Overview
The India Feed Probiotics Market is moderately consolidated, with the top five companies occupying 55.26%. The major players in this market are Adisseo, CHR. Hansen A/S, DSM Nutritional Products AG, Evonik Industries AG and Kerry Group PLC (sorted alphabetically).
Additional Benefits:
- The market estimate (ME) sheet in Excel format
- 3 months of analyst support
TABLE OF CONTENTS
1 EXECUTIVE SUMMARY & KEY FINDINGS
2 REPORT OFFERS
3 INTRODUCTION
- 3.1 Study Assumptions & Market Definition
- 3.2 Scope of the Study
- 3.3 Research Methodology
4 KEY INDUSTRY TRENDS
- 4.1 Animal Headcount
- 4.1.1 Poultry
- 4.1.2 Ruminants
- 4.1.3 Swine
- 4.2 Feed Production
- 4.2.1 Aquaculture
- 4.2.2 Poultry
- 4.2.3 Ruminants
- 4.2.4 Swine
- 4.3 Regulatory Framework
- 4.3.1 India
- 4.4 Value Chain & Distribution Channel Analysis
5 MARKET SEGMENTATION (includes market size in Value in USD and Volume, Forecasts up to 2030 and analysis of growth prospects)
- 5.1 Sub Additive
- 5.1.1 Bifidobacteria
- 5.1.2 Enterococcus
- 5.1.3 Lactobacilli
- 5.1.4 Pediococcus
- 5.1.5 Streptococcus
- 5.1.6 Other Probiotics
- 5.2 Animal
- 5.2.1 Aquaculture
- 5.2.1.1 By Sub Animal
- 5.2.1.1.1 Fish
- 5.2.1.1.2 Shrimp
- 5.2.1.1.3 Other Aquaculture Species
- 5.2.2 Poultry
- 5.2.2.1 By Sub Animal
- 5.2.2.1.1 Broiler
- 5.2.2.1.2 Layer
- 5.2.2.1.3 Other Poultry Birds
- 5.2.3 Ruminants
- 5.2.3.1 By Sub Animal
- 5.2.3.1.1 Beef Cattle
- 5.2.3.1.2 Dairy Cattle
- 5.2.3.1.3 Other Ruminants
- 5.2.4 Swine
- 5.2.5 Other Animals
- 5.2.1 Aquaculture
6 COMPETITIVE LANDSCAPE
- 6.1 Key Strategic Moves
- 6.2 Market Share Analysis
- 6.3 Company Landscape
- 6.4 Company Profiles (includes Global Level Overview, Market Level Overview, Core Business Segments, Financials, Headcount, Key Information, Market Rank, Market Share, Products and Services, and Analysis of Recent Developments).
- 6.4.1 Adisseo
- 6.4.2 Blue Aqua International Co. Ltd
- 6.4.3 Cargill Inc.
- 6.4.4 CHR. Hansen A/S
- 6.4.5 DSM Nutritional Products AG
- 6.4.6 Evonik Industries AG
- 6.4.7 IFF(Danisco Animal Nutrition)
- 6.4.8 Kemin Industries
- 6.4.9 Kerry Group PLC
- 6.4.10 Marubeni Corporation (Orffa International Holding B.V.)
7 KEY STRATEGIC QUESTIONS FOR FEED ADDITIVE CEOS
8 APPENDIX
- 8.1 Global Overview
- 8.1.1 Overview
- 8.1.2 Porter's Five Forces Framework
- 8.1.3 Global Value Chain Analysis
- 8.1.4 Global Market Size and DROs
- 8.2 Sources & References
- 8.3 List of Tables & Figures
- 8.4 Primary Insights
- 8.5 Data Pack
- 8.6 Glossary of Terms
インドの飼料用プロバイオティクス-市場シェア分析、産業動向・統計、成長予測(2025~2030年)
- 発行日
- 発行
- Mordor Intelligence
- ページ情報
- 英文 189 Pages
- 納期
- 2~3営業日


