|
|
市場調査レポート
商品コード
1693659
電気バス:市場シェア分析、産業動向・統計、成長予測(2025年~2030年)Electric Bus - Market Share Analysis, Industry Trends & Statistics, Growth Forecasts (2025 - 2030) |
||||||
|
|||||||
カスタマイズ可能
適宜更新あり
|
|||||||

| 電気バス:市場シェア分析、産業動向・統計、成長予測(2025年~2030年) |
|
出版日: 2025年03月18日
発行: Mordor Intelligence
ページ情報: 英文 360 Pages
納期: 2~3営業日
|

全表示
- 概要
- 目次
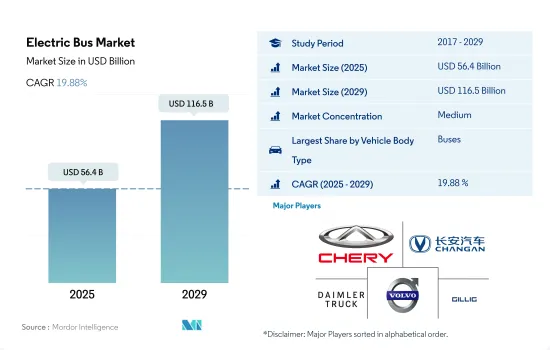
電気バスの市場規模は2025年に564億米ドルと推計され、2029年には1,165億米ドルに達すると予測され、予測期間中(2025-2029年)のCAGRは19.88%で成長すると予測されます。
電気バスの世界需要は、環境問題への懸念、燃料コストの上昇、グリーン車規制の厳格化により大きく伸びています。
- 電気バスの世界需要は近年大幅に急増しています。この急増は、二酸化炭素排出に起因する環境問題の高まり、燃料費の高騰、高運用費の負担、および世界各国政府による厳しいグリーン車規制の賦課に起因しています。その結果、電気バスの世界需要は2021年と比較して2022年に顕著な増加が見られました。
- いくつかの国の公共交通機関は、電気バスの採用を積極的に支持しています。例えば、インド最大の公共交通バス運行会社であるバンガロール都市交通公社(BMTC)は、バッテリー式電気バスの野心的な計画を発表しました。カルナタカ州政府は、2030年までにBMTCのバス6,500台すべてをゼロエミッション車に移行することを目指しています。このような取り組みは、電気バスの世界の需要と販売を強化する態勢を整えています。
- 世界中の政府機関が電気バスを採用するようになってきています。米国では、電気バスを導入する都市や大学が増えており、その動向は明らかです。特筆すべきは、カリフォルニア州がこの移行におけるフロントランナーとして登場し、革新的クリーン交通ルール(ICTR)を導入したことです。この規則では、新規購入バスの25%をゼロエミッションバスにすることを義務付けており、その後、2029年までにカリフォルニア州の交通機関から100%ゼロエミッションバスを受注することを目標としています。カリフォルニア州は、2040年までに1万2,000台の市バスをすべて電動化することを目指しています。他の国々でも同様の取り組みが行われており、2024年から2030年にかけて電気バスの需要が高まる見通しです。
世界の電気バス市場動向
世界の需要の高まりと政府の支援が電気自動車市場の成長を後押し
- 電気自動車(EV)は、エネルギー効率を高め、温室効果ガスや公害の排出を削減する可能性に後押しされ、自動車産業において不可欠なものとなっています。この急成長の主な要因は、環境に対する関心の高まりと政府の支援策にあります。特に、EVの世界販売台数は、2021年と比較して2022年には10.82%増と堅調な伸びを示しました。予測によると、電気乗用車の年間販売台数は2025年末までに500万台を突破し、自動車販売台数全体の約15%を占めるようになります。
- ロンドン警視庁消防局のような大手メーカーや組織は、電動モビリティ戦略を積極的に推進しています。例えば、2025年までに車両をゼロエミッション化し、2030年までにバンの40%を電動化、2040年までに完全電動化を達成するという目標を掲げています。世界的にも同様の動向が予想され、2024年から2030年にかけて電気自動車の需要と販売が急増します。
- アジア太平洋と欧州は、バッテリー技術と車両電化の進歩に牽引され、電気自動車生産を支配する態勢を整えています。2020年5月、起亜自動車欧州は「プランS」を発表し、電動化への戦略的シフトを表明しました。この決定は、起亜のEVが欧州で記録的な販売台数を達成したことを受けてのものです。起亜は2025年までに、乗用車、SUV、MPVなどさまざまなセグメントにまたがる11のEVモデルを世界に投入するという野心的な計画を掲げています。同社は、2026年までにEVの世界年間販売台数50万台の達成を目指しています。
電気バス業界の概要
電気バス市場は適度に統合されており、上位5社で48.55%を占めています。この市場の主要企業は以下の通り。 Chery Automobile, Chongqing Changan Automobile Company Limited, Daimler Truck Holding AG, Volvo Group and Zhejiang Geely Holding Group(アルファベット順)
その他の特典
- エクセル形式の市場予測(ME)シート
- 3ヶ月間のアナリストサポート
目次
第1章 エグゼクティブサマリーと主な調査結果
第2章 レポートのオファー
第3章 イントロダクション
- 調査の前提条件と市場定義
- 調査範囲
- 調査手法
第4章 主要産業動向
- 人口
- アフリカ
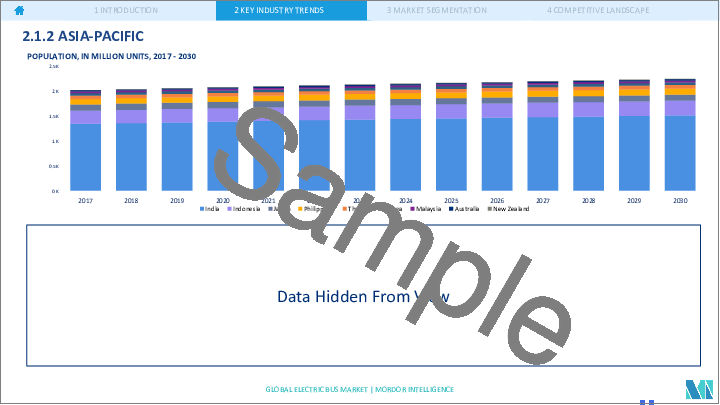
- アジア太平洋
- 欧州
- 中東
- 北米
- 南米
- 一人当たりGDP
- アフリカ
- アジア太平洋
- 欧州
- 中東
- 北米
- 南米
- 自動車購入のための消費支出(cvp)
- アフリカ
- アジア太平洋
- 欧州
- 中東
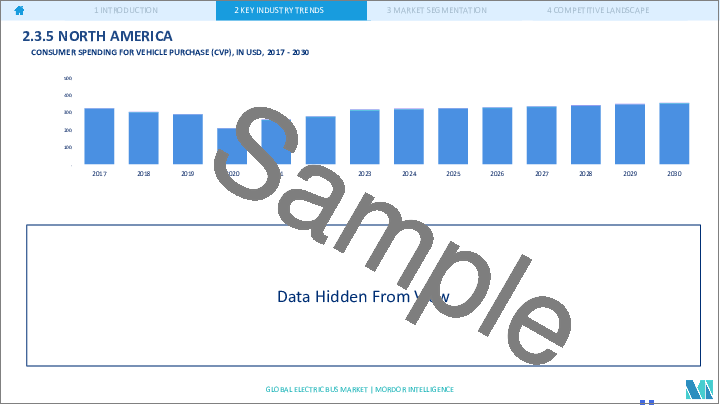
- 北米
- 南米
- インフレ率
- アフリカ
- アジア太平洋
- 欧州
- 中東
- 北米
- 南米
- 自動車ローン金利
- シェアライド
- シェアライド
- 電化の影響
- EV充電ステーション
- バッテリーパック価格
- アフリカ
- アジア太平洋
- 欧州
- 中東
- 北米
- 南米
- Xev新モデル発表
- 燃料価格
- OEM生産統計
- 規制の枠組み
- バリューチェーンと流通チャネル分析
第5章 市場セグメンテーション
- 燃料カテゴリー
- BEV
- FCEV
- HEV
- PHEV
- 地域
- アフリカ
- 南アフリカ
- アジア太平洋
- 中国
- インド
- 日本
- 韓国
- 欧州
- フランス
- ドイツ
- イタリア
- スペイン
- 英国
- その他欧州
- 中東
- アラブ首長国連邦
- その他中東
- 北米
- カナダ
- メキシコ
- 米国
- 南米
- アルゼンチン
- ブラジル
- その他南米
- アフリカ
第6章 競合情勢
- 主要な戦略動向
- 市場シェア分析
- 企業情勢
- 企業プロファイル
- Anhui Ankai Automobile Co. Ltd.
- Ashok Leyland Limited
- Byd Auto Industry Company Limited
- Chery Automobile Co. Ltd.
- Chongqing Changan Automobile Company Limited
- CRRC Electric Vehicle Co. Ltd.
- Daimler Truck Holding AG
- King Long United Automotive Industry Co. Ltd.
- NFI Group Inc.
- Proterra INC.
- Tata Motors Limited
- Volvo Group
- Zhejiang Geely Holding Group Co. Ltd
- Zhengzhou Yutong Bus Co. Ltd.
- Zhongtong Bus Holding Co. Ltd.
第7章 CEOへの主な戦略的質問
第8章 付録
- 世界概要
- 概要
- ファイブフォース分析フレームワーク
- 世界のバリューチェーン分析
- 市場力学(DROs)
- 情報源と参考文献
- 図表一覧
- 主要洞察
- データパック
- 用語集
The Electric Bus Market size is estimated at 56.4 billion USD in 2025, and is expected to reach 116.5 billion USD by 2029, growing at a CAGR of 19.88% during the forecast period (2025-2029).
The global demand for electric buses is experiencing significant growth due to environmental concerns, rising fuel costs, and stringent green vehicle regulations
- The global demand for electric buses has surged significantly in recent years. This uptick can be attributed to mounting environmental concerns stemming from carbon emissions, escalating fuel costs, the burden of high operational expenses, and the imposition of stringent green vehicle regulations by governments worldwide. Consequently, the global demand for electric buses saw a notable increase in 2022 compared to 2021.
- Public transit agencies in several nations are actively championing the adoption of electric buses. For instance, the Bangalore Metropolitan Transport Corporation (BMTC), India's largest public transit bus operator, has unveiled ambitious plans for battery electric buses. It has committed to procuring up to 1,800 electric buses in the coming years, while the Karnataka state government aims to transition BMTC's entire fleet of 6,500 buses to zero-emission vehicles by 2030. Such initiatives are poised to bolster the global demand and sales of electric buses.
- Government bodies worldwide are increasingly embracing electric buses. In the United States, the trend is evident as more cities and universities are incorporating electric bus fleets. Notably, California emerged as a frontrunner in this transition, introducing the Innovative Clean Transit Rule (ICTR). This rule mandates that 25% of new bus purchases be zero-emission buses, with a subsequent target of 100% zero-emission orders from California transport agencies by 2029. California aims to electrify its entire fleet of 12,000 city buses by 2040. Similar endeavors in other nations are poised to fuel the demand for electric buses from 2024 to 2030.
Global Electric Bus Market Trends
The rising global demand and government support propel electric vehicle market growth
- Electric vehicles (EVs) have become indispensable in the automotive industry, driven by their potential to enhance energy efficiency and reduce greenhouse gas and pollution emissions. This surge is primarily attributed to growing environmental concerns and supportive government initiatives. Notably, global EV sales witnessed a robust 10.82% growth in 2022 compared to 2021. Projections indicate that annual sales of electric passenger cars will surpass 5 million by the end of 2025, accounting for approximately 15% of total vehicle sales.
- Leading manufacturers and organizations, like the London Metropolitan Police & Fire Service, have been actively pursuing their electric mobility strategies. For instance, they have set a target of a zero-emission fleet by 2025, with a goal of electrifying 40% of their vans by 2030 and achieving full electrification by 2040. Similar trends are expected globally, with the period from 2024 to 2030 witnessing a surge in demand and sales of electric vehicles.
- Asia-Pacific and Europe are poised to dominate electric vehicle production, driven by their advancements in battery technology and vehicle electrification. In May 2020, Kia Motors Europe unveiled its "Plan S," signaling a strategic shift toward electrification. This decision came on the heels of record-breaking sales of Kia's EVs in Europe. Kia has ambitious plans to introduce 11 EV models globally by 2025, spanning various segments like passenger vehicles, SUVs, and MPVs. The company aims to achieve annual global EV sales of 500,000 by 2026.
Electric Bus Industry Overview
The Electric Bus Market is moderately consolidated, with the top five companies occupying 48.55%. The major players in this market are Chery Automobile Co. Ltd., Chongqing Changan Automobile Company Limited, Daimler Truck Holding AG, Volvo Group and Zhejiang Geely Holding Group Co. Ltd (sorted alphabetically).
Additional Benefits:
- The market estimate (ME) sheet in Excel format
- 3 months of analyst support
TABLE OF CONTENTS
1 EXECUTIVE SUMMARY & KEY FINDINGS
2 REPORT OFFERS
3 INTRODUCTION
- 3.1 Study Assumptions & Market Definition
- 3.2 Scope of the Study
- 3.3 Research Methodology
4 KEY INDUSTRY TRENDS
- 4.1 Population
- 4.1.1 Africa
- 4.1.2 Asia-Pacific
- 4.1.3 Europe
- 4.1.4 Middle East
- 4.1.5 North America
- 4.1.6 South America
- 4.2 GDP Per Capita
- 4.2.1 Africa
- 4.2.2 Asia-Pacific
- 4.2.3 Europe
- 4.2.4 Middle East
- 4.2.5 North America
- 4.2.6 South America
- 4.3 Consumer Spending For Vehicle Purchase (cvp)
- 4.3.1 Africa
- 4.3.2 Asia-Pacific
- 4.3.3 Europe
- 4.3.4 Middle East
- 4.3.5 North America
- 4.3.6 South America
- 4.4 Inflation
- 4.4.1 Africa
- 4.4.2 Asia-Pacific
- 4.4.3 Europe
- 4.4.4 Middle East
- 4.4.5 North America
- 4.4.6 South America
- 4.5 Interest Rate For Auto Loans
- 4.6 Shared Rides
- 4.7 Shared Rides
- 4.8 Impact Of Electrification
- 4.9 EV Charging Station
- 4.10 Battery Pack Price
- 4.10.1 Africa
- 4.10.2 Asia-Pacific
- 4.10.3 Europe
- 4.10.4 Middle East
- 4.10.5 North America
- 4.10.6 South America
- 4.11 New Xev Models Announced
- 4.12 Fuel Price
- 4.13 Oem-wise Production Statistics
- 4.14 Regulatory Framework
- 4.15 Value Chain & Distribution Channel Analysis
5 MARKET SEGMENTATION (includes market size in Value in USD and Volume, Forecasts up to 2029 and analysis of growth prospects)
- 5.1 Fuel Category
- 5.1.1 BEV
- 5.1.2 FCEV
- 5.1.3 HEV
- 5.1.4 PHEV
- 5.2 Region
- 5.2.1 Africa
- 5.2.1.1 South Africa
- 5.2.2 Asia-Pacific
- 5.2.2.1 China
- 5.2.2.2 India
- 5.2.2.3 Japan
- 5.2.2.4 South Korea
- 5.2.3 Europe
- 5.2.3.1 France
- 5.2.3.2 Germany
- 5.2.3.3 Italy
- 5.2.3.4 Spain
- 5.2.3.5 UK
- 5.2.3.6 Rest-of-Europe
- 5.2.4 Middle East
- 5.2.4.1 UAE
- 5.2.4.2 Rest-of-Middle East
- 5.2.5 North America
- 5.2.5.1 Canada
- 5.2.5.2 Mexico
- 5.2.5.3 US
- 5.2.6 South America
- 5.2.6.1 Argentina
- 5.2.6.2 Brazil
- 5.2.6.3 Rest-of-South America
- 5.2.1 Africa
6 COMPETITIVE LANDSCAPE
- 6.1 Key Strategic Moves
- 6.2 Market Share Analysis
- 6.3 Company Landscape
- 6.4 Company Profiles
- 6.4.1 Anhui Ankai Automobile Co. Ltd.
- 6.4.2 Ashok Leyland Limited
- 6.4.3 Byd Auto Industry Company Limited
- 6.4.4 Chery Automobile Co. Ltd.
- 6.4.5 Chongqing Changan Automobile Company Limited
- 6.4.6 CRRC Electric Vehicle Co. Ltd.
- 6.4.7 Daimler Truck Holding AG
- 6.4.8 King Long United Automotive Industry Co. Ltd.
- 6.4.9 NFI Group Inc.
- 6.4.10 Proterra INC.
- 6.4.11 Tata Motors Limited
- 6.4.12 Volvo Group
- 6.4.13 Zhejiang Geely Holding Group Co. Ltd
- 6.4.14 Zhengzhou Yutong Bus Co. Ltd.
- 6.4.15 Zhongtong Bus Holding Co. Ltd.
7 KEY STRATEGIC QUESTIONS FOR VEHICLES CEOS
8 APPENDIX
- 8.1 Global Overview
- 8.1.1 Overview
- 8.1.2 Porter's Five Forces Framework
- 8.1.3 Global Value Chain Analysis
- 8.1.4 Market Dynamics (DROs)
- 8.2 Sources & References
- 8.3 List of Tables & Figures
- 8.4 Primary Insights
- 8.5 Data Pack
- 8.6 Glossary of Terms
