
|
市場調査レポート
商品コード
1693386
シンガポールの接着剤:市場シェア分析、産業動向・統計、成長予測(2025年~2030年)Singapore Adhesives - Market Share Analysis, Industry Trends & Statistics, Growth Forecasts (2025 - 2030) |
||||||
カスタマイズ可能
適宜更新あり
|
|||||||
| シンガポールの接着剤:市場シェア分析、産業動向・統計、成長予測(2025年~2030年) |
|
出版日: 2025年03月18日
発行: Mordor Intelligence
ページ情報: 英文 209 Pages
納期: 2~3営業日
|

全表示
- 概要
- 目次
概要
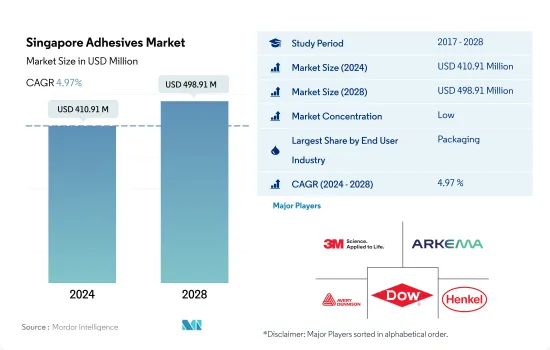
シンガポールの接着剤市場規模は2024年に4億1,091万米ドルと推定・予測され、2028年には4億9,891万米ドルに達し、予測期間(2024-2028年)のCAGRは4.97%で成長すると予測されます。
接着剤市場全体の成長に大きな影響を与えるシンガポールのヘルスケア産業の主要成長率
- シンガポールのヘルスケア、パッケージング、電子産業にわたる強力な製造能力と接着剤は、接着と組み立てアプリケーションの面で成長機会を見出しています。2020年の接着剤需要は、COVID-19パンデミックによる貿易とサプライチェーンの制限により減少し、その結果2019年のそれと比較して7.5%以上の減少となりました。
- 接着剤は、プラスチック、金属、紙や段ボールの包装用途の接着における重要性により、国内の包装産業で主に消費されています。水系接着剤は、これらの用途で必要とされる安価なコストと高い接着強度のため、業界で非常に消費されています。2021年には約3万2,000トンの水性接着剤が国内の包装業界で消費されたと見られています。ホットメルト接着剤は包装産業で最も急成長している技術であり、2022~2028年のCAGRは5.58%です。持続可能な食品包装は、消費される食品の安全性を確保すると同時に、食品廃棄物を減らし、その結果、接着剤需要が業界で増加するのを助けるかもしれないです。これらの要因は、食品分野における包装の需要を非常に動機づけられています。
- シンガポールの接着剤はまた、主にヘルスケア業界全体で消費されています。シンガポールのヘルスケアシステムは、最先端の治療を提供し、世界で最も偉大なもの一つとしてみなされています。これは、しっかりとした規制監督、商業部門と公的部門の両方を含む費用負担構造、医療貯蓄口座からの支払いによるものです。
シンガポールの接着剤市場動向
包装用プラスチックにリサイクル可能なプラスチックが使用され、業界の成長に新たな機会がもたらされる
- 包装は主に保護、封じ込め、情報提供、実用性、販促のために使われます。成長するシンガポールの包装市場セグメントは、予測期間中にCAGR 3.77%を記録すると予想されます。2017年、紙、板紙、プラスチック包装を含む包装の使用量は3,340万トンを占めました。2020年にはCOVID-19の発生により、サプライチェーンの混乱、包装資材の不足、商品の輸出入の制限、工場の低能力操業により、市場は-5.54%のマイナス成長を記録しました。
- 2021年には、市場は4.40%のプラス成長を記録し、3,560万トンの包装材料が様々な目的で使用されます。eコマースセクターが増加し、商品の出荷に特殊な包装が必要となるため、包装業界を大きく後押ししていることから、包装業界は今後も成長を続けると予想されます。2021年、シンガポールのeコマース市場は59億米ドルと評価され、2026年には100億米ドルに上昇すると予想されています。競争の激しい今日のFMCG市場において、企業が競合他社に差をつけ、市場でのブランドを維持するためには、魅力的な包装を使用し、包装にイノベーションをもたらすことが不可避となっています。
- シンガポール政府は、製品にリサイクル可能なプラスチックを含める規制を実施しています。同国では、包装材の生産は主にプラスチックが牽引しており、2021年に生産される包装材の約64%を占めています。プラスチックのリサイクル性の向上により、プラスチック分野は成長を維持し、予測期間中に約4.75%のCAGRで推移すると思われます。
公共建築物建設への継続的かつ今後の投資がエンドユーザー産業を支える
- シンガポールの建設業界は、2022~2028年の予測期間中に約2.6%のCAGRで推移すると予測されます。建設需要は2019年に5年ぶりの高水準に達し、推定334億SGD相当のプロジェクトが受注され、上期予測の320億SGDを上回りました。これは2018年と比較して建設需要が9.5%増加したことを表しています。しかし、2020年にはCOVID-19パンデミックの影響によりプロジェクト実施スケジュールが混乱し、建設需要の速報値は36.5%減の213億SGDとなりました。シンガポールの建設用接着剤とシーラント市場は、2022~2028年の予測期間中に数量で約2.86%、金額で約5.31%のCAGRで推移すると予測されています。
- 公共部門の建設は2019年の190億SGDから2020年には132億SGDに減少したが、これはパンデミックがリソース管理とプロジェクトスケジューリングに与える影響を検討するための時間を必要としたため、特定の大型インフラプロジェクトが延期されたためです。さらに、シンガポールの建設需要は2022年には270億~320億米ドルになると推定され、公共部門が需要全体の約60%を占めるとみられます。公共部門の建設需要は160億~190億米ドルと予想されます。
- 他方、シンガポールの住宅建設は、売れ残り建物のストックの増加により依然として低調であり、COVID-19の流行による景気後退によってさらに悪化しています。しかし、パンデミックの中、寮の人口密度を下げるため、政府は2020年末までに約6万人の出稼ぎ労働者向けに住宅を追加建設する計画を立てていました。こうした要因により、予測期間中は接着剤とシーラントの需要が抑制されると予想されます。
シンガポールの接着剤産業の概観
シンガポールの接着剤市場は細分化されており、上位5社で19.36%を占めています。この市場の主要企業は以下の通り。 3M, Arkema Group, AVERY DENNISON CORPORATION, Dow and Henkel AG & Co. KGaA(アルファベット順)
その他の特典
- エクセル形式の市場予測(ME)シート
- 3ヶ月のアナリストサポート
目次
第1章 エグゼクティブサマリーと主な調査結果
第2章 レポートのオファー
第3章 イントロダクション
- 調査の前提条件と市場定義
- 調査範囲
- 調査手法
第4章 主要産業動向
- エンドユーザー動向
- 航空宇宙
- 自動車
- 建築・建設
- 靴・皮革
- 包装
- 木工・建具
- 規制の枠組み
- シンガポール
- バリューチェーンと流通チャネル分析
第5章 市場セグメンテーション
- エンドユーザー産業
- 航空宇宙
- 自動車
- 建築・建設
- 履物・皮革
- ヘルスケア
- 包装
- 木工・建具
- その他のエンドユーザー産業
- テクノロジー
- ホットメルト
- 反応性
- 溶剤系
- UV硬化型接着剤
- 水系
- 樹脂
- アクリル系
- シアノアクリレート
- エポキシ
- ポリウレタン
- シリコーン
- VAE・EVA
- その他の樹脂
第6章 競合情勢
- 主要な戦略動向
- 市場シェア分析
- 企業情勢
- 企業プロファイル
- 3M
- ALTECO co., ltd.
- Arkema Group
- AVERY DENNISON CORPORATION
- Dow
- Dymax
- H.B. Fuller Company
- Henkel AG & Co. KGaA
- Huntsman International LLC
- Sika AG
第7章 CEOへの主な戦略的質問
第8章 付録
- 世界の接着剤とシーラント産業の概要
- 概要
- ファイブフォース分析フレームワーク(産業魅力度分析)
- 世界のバリューチェーン分析
- 促進要因、抑制要因、機会
- 情報源と参考文献
- 図表一覧
- 主要洞察
- データパック
- 用語集
目次
Product Code: 92441
The Singapore Adhesives Market size is estimated at 410.91 million USD in 2024, and is expected to reach 498.91 million USD by 2028, growing at a CAGR of 4.97% during the forecast period (2024-2028).
The major growth rates poised for the Healthcare industry of Singapore to have a considerable influence on the overall growth of adhesives market
- Singapore's strong manufacturing capacities across healthcare, packaging, and electronic industries and adhesives have found a growth opportunity in terms of bonding and assembling applications. The demand for adhesives declined in 2020 due to trade and supply chain restrictions because of the COVID-19 pandemic, which resulted in a decline of above 7.5% in comparison to that of 2019.
- Adhesives are majorly consumed in the packaging industry in the country owing to their importance in bonding plastics, metals, and paper and cardboard packaging applications. Waterborne adhesives are highly consumed in the industry because of their cheaper cost and high bonding strength, which is required in these applications. It is seen that nearly 32 thousand tons of water-borne adhesives were consumed in the packaging industry of the country in 2021. Hot-melt adhesives are the fastest-growing technology in the packaging industry, with a CAGR of 5.58% during the period 2022-2028. Sustainable food packaging may assist ensure the safety of the food consumed while also reducing food waste and thus helping the adhesives demand to increase in the industry. These factors have highly motivated the demand for packaging in the food sector.
- Singapore's adhesives are also largely being consumed across the healthcare industry. Singapore's healthcare system is regarded as one of the greatest in the world, offering some of the most cutting-edge medical treatments. This is due to robust regulatory oversight, a cost-sharing structure that includes both the commercial and public sectors and payments from medical savings accounts.
Singapore Adhesives Market Trends
Usage of recyclable plastics for packaging production will open new opportunities to the industry growth
- Packaging is mainly used for protection, containment, information, utility, and promotion. The growing Singaporean packaging market segment is expected to register a CAGR of 3.77% during the forecast period. In 2017, packaging usage accounted for 33.4 million ton of packaging, including paper, paperboard, and plastic packaging. Due to the COVID-19 outbreak in 2020, the market registered a negative growth of -5.54% due to disruptions in the supply chain, shortage of packaging material, restrictions on the import and export of goods, and factories operating at low capacity.
- In 2021, the market registered a positive growth of 4.40%, with 35.6 million ton of packaging material used for various purposes. The packaging industry is expected to keep growing as there has been a rise in the e-commerce sector, which has significantly boosted the packaging industry as special packaging is required for shipping goods. In 2021, the Singaporean e-commerce market was valued at USD 5.9 billion, and it is expected to rise to USD 10 billion by 2026. In today's competitive FMCG market, it has become inevitable for companies to use attractive packaging and bring innovation to their packaging to stand out from their competitors and maintain their brand in the market.
- The Singaporean government has implemented regulations to include recyclable plastics in products. Packaging production is majorly driven by plastic in the country, which nearly accounts for around 64% of the packaging produced in 2021. With the advancement of plastic recyclability, the plastic segment is likely to maintain its growth and record a CAGR of around 4.75% during the forecast period.
Ongoing and upcoming investments in the construction of public buildings will support the end-user industry
- The Singaporean construction industry is projected to record a CAGR of about 2.6% during the forecast period from 2022 to 2028. The construction demand hit a five-year high in 2019, with an estimated SGD 33.4 billion worth of projects awarded, higher than its top-end projection of SGD 32 billion. This represented a 9.5% increase in construction demand compared to 2018. However, in 2020, due to the impact of the COVID-19 pandemic, which disrupted project implementation schedules, the preliminary figure for construction demand witnessed a decline of 36.5% to SGD 21.3 billion. The Singaporean construction adhesives and sealants market is projected to record a CAGR of about 2.86% in volume and 5.31% in value during the forecast period 2022-2028.
- Public sector construction declined from SGD 19 billion in 2019 to SGD 13.2 billion in 2020, as certain large infrastructure projects were postponed due to the need for more time to examine the pandemic's impact on resource management and project scheduling. Moreover, construction demand in Singapore is estimated to be between USD 27 billion and USD 32 billion in 2022, and the public sector is likely to provide roughly 60% of the overall demand. The public sector's construction demand is expected to range between USD 16 billion and USD 19 billion.
- On the other hand, residential construction in Singapore remains weak due to the growing stock of unsold buildings, further aggravated by the economic downturn due to the COVID-19 pandemic. However, to reduce the population density in dormitories amid the pandemic, the government had planned to construct additional housing for around 60,000 migrant workers by the end of 2020. These factors are expected to restrain the demand for adhesives and sealants over the forecast period.
Singapore Adhesives Industry Overview
The Singapore Adhesives Market is fragmented, with the top five companies occupying 19.36%. The major players in this market are 3M, Arkema Group, AVERY DENNISON CORPORATION, Dow and Henkel AG & Co. KGaA (sorted alphabetically).
Additional Benefits:
- The market estimate (ME) sheet in Excel format
- 3 months of analyst support
TABLE OF CONTENTS
1 EXECUTIVE SUMMARY & KEY FINDINGS
2 REPORT OFFERS
3 INTRODUCTION
- 3.1 Study Assumptions & Market Definition
- 3.2 Scope of the Study
- 3.3 Research Methodology
4 KEY INDUSTRY TRENDS
- 4.1 End User Trends
- 4.1.1 Aerospace
- 4.1.2 Automotive
- 4.1.3 Building and Construction
- 4.1.4 Footwear and Leather
- 4.1.5 Packaging
- 4.1.6 Woodworking and Joinery
- 4.2 Regulatory Framework
- 4.2.1 Singapore
- 4.3 Value Chain & Distribution Channel Analysis
5 MARKET SEGMENTATION (includes market size in Value in USD and Volume, Forecasts up to 2028 and analysis of growth prospects)
- 5.1 End User Industry
- 5.1.1 Aerospace
- 5.1.2 Automotive
- 5.1.3 Building and Construction
- 5.1.4 Footwear and Leather
- 5.1.5 Healthcare
- 5.1.6 Packaging
- 5.1.7 Woodworking and Joinery
- 5.1.8 Other End-user Industries
- 5.2 Technology
- 5.2.1 Hot Melt
- 5.2.2 Reactive
- 5.2.3 Solvent-borne
- 5.2.4 UV Cured Adhesives
- 5.2.5 Water-borne
- 5.3 Resin
- 5.3.1 Acrylic
- 5.3.2 Cyanoacrylate
- 5.3.3 Epoxy
- 5.3.4 Polyurethane
- 5.3.5 Silicone
- 5.3.6 VAE/EVA
- 5.3.7 Other Resins
6 COMPETITIVE LANDSCAPE
- 6.1 Key Strategic Moves
- 6.2 Market Share Analysis
- 6.3 Company Landscape
- 6.4 Company Profiles (includes Global Level Overview, Market Level Overview, Core Business Segments, Financials, Headcount, Key Information, Market Rank, Market Share, Products and Services, and Analysis of Recent Developments).
- 6.4.1 3M
- 6.4.2 ALTECO co., ltd.
- 6.4.3 Arkema Group
- 6.4.4 AVERY DENNISON CORPORATION
- 6.4.5 Dow
- 6.4.6 Dymax
- 6.4.7 H.B. Fuller Company
- 6.4.8 Henkel AG & Co. KGaA
- 6.4.9 Huntsman International LLC
- 6.4.10 Sika AG
7 KEY STRATEGIC QUESTIONS FOR ADHESIVES AND SEALANTS CEOS
8 APPENDIX
- 8.1 Global Adhesives and Sealants Industry Overview
- 8.1.1 Overview
- 8.1.2 Porter's Five Forces Framework (Industry Attractiveness Analysis)
- 8.1.3 Global Value Chain Analysis
- 8.1.4 Drivers, Restraints, and Opportunities
- 8.2 Sources & References
- 8.3 List of Tables & Figures
- 8.4 Primary Insights
- 8.5 Data Pack
- 8.6 Glossary of Terms

