
|
市場調査レポート
商品コード
1692576
アジア太平洋のEVA接着剤:市場シェア分析、産業動向、成長予測(2025~2030年)Asia-Pacific EVA Adhesives - Market Share Analysis, Industry Trends & Statistics, Growth Forecasts (2025 - 2030) |
||||||
カスタマイズ可能
適宜更新あり
|
|||||||
| アジア太平洋のEVA接着剤:市場シェア分析、産業動向、成長予測(2025~2030年) |
|
出版日: 2025年03月18日
発行: Mordor Intelligence
ページ情報: 英文 214 Pages
納期: 2~3営業日
|

全表示
- 概要
- 目次
概要
アジア太平洋のEVA接着剤市場規模は2024年に41億2,000万米ドルと推定され、2028年には53億1,000万米ドルに達すると予測され、予測期間中(2024~2028年)のCAGRは6.52%で成長する見込みです。
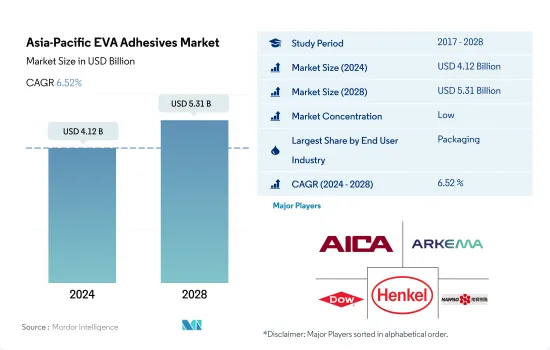
包装が最も急成長しているエンドユーザーであり、ポールポジションを維持しています。
- EVA接着剤は、包装、自動車、木工・建具、建築・建設など、さまざまなエンドユーザー産業で応用されています。これらの接着剤は、紙、木材、プラスチック、ゴム、金属、皮革などの基材を接着することができます。EVA接着剤の主要用途としては、紙/カードストック箱、包装・ラベリング、カートン・シーリング、組立、自動車内装、紙変換などが挙げられます。
- EVA接着剤の需要は2017~2019年にかけて大きく伸びています。韓国のフットウェア皮革産業は、アジア太平洋のEVA接着剤市場で最も高い成長(27.62%)を示しました。
- 2020年、EVA接着剤の需要は、操業や貿易の制限、サプライチェーンの制約、COVID-19パンデミックによる労働力不足など様々な要因から、すべてのエンドユーザー産業から減少しました。フットウェア皮革産業からの需要が最も苦しく、前年同期比14.22%減少しました。2020年の世界のフットウェア消費量が前年比22%減少したため、アジア太平洋に集中しているフットウェアメーカーは生産量を減らさざるを得なかりました。これは、この産業におけるEVA接着剤の需要にマイナスの影響を与えました。
- この産業の成長動向は予測期間中も続くと予想されます。数量ベースでは、すべてのエンドユーザー産業を合わせたEVA接着剤の需要は、予測期間2022~2028年にCAGR 5.09%を記録すると予想されます。包装産業は、その速硬化特性のために他のものよりもEVA接着剤を好むため、需要の最大のシェアを占めており、予測期間2022~2028の間、最大のエンドユーザー産業であり続けると予想されます。
アジア太平洋の大規模な製造能力がEVA接着剤の最高需要の確保に貢献
- 2017~2021年にかけて、アジア太平洋から生み出されたEVA接着剤市場の需要は、全地域の中で最も高かったです。この地域の接着剤需要のシェアは、すべてのエンドユーザー産業において高い製造能力を有しているため、一貫して世界需要の46~47%を占めています。ホットメルト技術を用いたEVA樹脂ベースの接着剤が、この地域の需要の大半を生み出しています。
- 2017~2019年にかけて、この地域の接着剤需要は1%以下のCAGRを記録しました。EVA樹脂系接着剤の伸びの鈍化は、同地域の建設活動と自動車生産の減少によるものです。これらのエンドユーザー産業からの需要は、2018年と2019年にそれぞれ-2.4%と-2.25%のCAGRで減少しました。
- 2020年には、操業、労働力、原料、サプライチェーン、その他の面での制約により、この地域のすべてのエンドユーザー産業からの需要が減少しました。同地域の全産業の中で、オーストラリアのフットウェア産業が最も大きな打撃を受け、2020年の数量ベースで前年比49.53%減少しました。内需の減少は、経済の低迷による購買力の低下によるもので、パンデミック時にこの産業に深刻な影響を与えました。
- 2021年には、規制が緩和されたため、EVA樹脂ベースの接着剤の需要は急速にパンデミック前の数量に回復しました。インド市場は数量ベースで前年比8.55%増と最も高い伸びを示しました。アジア太平洋全体の需要は、予測期間中にCAGR 4.46%を記録して成長すると予想されます。この需要成長は、予測期間中、同地域の建設、包装、自動車産業によって牽引されると予想されます。
アジア太平洋のEVA接着剤市場動向
発展途上国におけるeコマース産業の急成長により、産業が拡大
- 包装は主に、保護、封じ込め、情報提供、実用性、プロモーションのために使用されます。そのため、包装はほとんどの産業にとって不可欠な要素となっています。2017年には、紙と板紙、プラスチック包装を含む包装の使用量は25億トンを占めました。2020年には、COVID-19の大流行により、サプライチェーンの混乱、包装資材の不足、商品の輸出入の制限、工場の低能力操業などにより、市場は7.4%のマイナス成長率を記録しました。
- 中国とインドネシアは海洋プラスチック廃棄物の第1位と第2位の排出国であるため、アジア各国の政府はプラスチックの使用を減らすための措置を講じています。中国は過剰包装に関する新たな規制を発表し、すべての食品・化粧品メーカーに対し、製品に比例して許容される包装の量を決定する特定のガイドラインを遵守するよう求めました。インドネシア政府による拡大生産者責任(EPR)規制は、生産者と小売業者に対し、リサイクル可能な材料の比率を高めるよう製品包装を再設計することを義務付けるものです。
- 2021年、市場は8%のプラス成長を記録し、27億トンの包装材が様々な目的に使用されました。中間所得層の増加、サプライチェーンの改善、eコマース活動の活発化により、包装産業は今後も成長を続けると予想され、商品の出荷には特殊な包装が必要となるため、ここ数年で包装産業を大きく後押ししています。成長するアジア市場は包装の利用を促進し、予測期間中(2022~2028年)にCAGR 5.7%を記録することを可能にすると予想されています。
電気自動車の普及が産業を牽引
- アジア太平洋の自動車産業は、自動車販売が大きく伸びていることから、市場をリードする産業の一つです。すべての国の中で、中国が最大の自動車生産国で、この地域の生産量の約57%を占めており、次いで日本が17%、インドが10%、韓国が8%となっています。
- 同地域の自動車販売台数は生産台数とともに大きく減少しており、そのために接着剤の利用が影響を受けています。2017-18年の前年比変動は-1.8%であったが、2018-19年はさらに-6.4%減少しました。2019~20年には、地域の生産は再びマイナスの影響を受け、COVID-19の流行により前年比-10.2%を記録しました。製造施設の操業停止とサプライチェーンの混乱による自動車部品の不足が生産水準を制約しました。しかし、2021年には自動車需要が再び増加し、今後も続くと予想されるため、予測期間中は地域全体で接着剤の利用が増加します。
- アジア太平洋のEV市場は、接着剤市場にとってもう一つの成長機会となります。EVとハイブリッド車の生産台数と採用台数の増加が、自動車の電子部品組立用接着剤の使用量を押し上げています。中国はEVの世界最大の生産国であると同時に、この地域全体でも最大の生産国です。2016~2021年にかけて、商用電気自動車の台数は56万2,603台から111万6,382台に増加し、約98%の成長率を記録しました。これらの要因により、接着剤の需要が増加し、予測期間中の市場成長率が高まると予想されます。
アジア太平洋のEVA接着剤産業概要
アジア太平洋のEVA接着剤市場は細分化されており、上位5社で9.91%を占めています。この市場の主要企業は、Aica Kogyo、Arkema Group、Dow、Henkel AG & Co. KGaA、NANPAO RESINS CHEMICAL GROUPなどです。
その他の特典
- エクセル形式の市場予測(ME)シート
- 3ヶ月のアナリストサポート
目次
第1章 エグゼクティブサマリーと主要調査結果
第2章 レポートのオファー
第3章 イントロダクション
- 調査の前提条件と市場定義
- 調査範囲
- 調査手法
第4章 主要産業動向
- エンドユーザー動向
- 航空宇宙
- 自動車
- 建築・建設
- フットウェア皮革
- 包装
- 木工・建具
- 規制の枠組み
- オーストラリア
- 中国
- インド
- インドネシア
- 日本
- マレーシア
- シンガポール
- 韓国
- タイ
- バリューチェーンと流通チャネル分析
第5章 市場セグメンテーション
- エンドユーザー産業
- 航空宇宙
- 自動車
- 建築・建設
- フットウェアと皮革
- 医療
- 包装
- 木工・建具
- その他
- 技術
- ホットメルト
- 溶剤系
- 水性
- 国名
- オーストラリア
- 中国
- インド
- インドネシア
- 日本
- マレーシア
- シンガポール
- 韓国
- タイ
- その他のアジア太平洋
第6章 競合情勢
- 主要な戦略動向
- 市場シェア分析
- 企業情勢
- 企業プロファイル
- Aica Kogyo Co..Ltd.
- Arkema Group
- CEMEDINE Co.,Ltd.
- Dow
- H.B. Fuller Company
- Henkel AG & Co. KGaA
- NANPAO RESINS CHEMICAL GROUP
- OKONG Corp.
- Paramelt B.V.
- Selic Corp Public Company Limited.
第7章 CEOへの主要戦略的質問
第8章 付録
- 世界の接着剤・シーラント産業概要
- 概要
- ファイブフォース分析フレームワーク(産業魅力度分析)
- 世界のバリューチェーン分析
- 促進要因、抑制要因、機会
- 情報源と参考文献
- 図表一覧
- 主要な洞察
- データパック
- 用語集
目次
Product Code: 92413
The Asia-Pacific EVA Adhesives Market size is estimated at 4.12 billion USD in 2024, and is expected to reach 5.31 billion USD by 2028, growing at a CAGR of 6.52% during the forecast period (2024-2028).
Packaging is the fastest-growing end-user and remains as pole position
- EVA adhesives find applications in various end-user industries, including packaging, automotive, woodworking and joinery, and building and construction. These adhesives can bond substrates like paper, wood, plastics, rubbers, metals, and leather. Some major applications of these adhesives are paper/card stock boxes, package labeling, carton sealing, assembly, vehicle interiors, and paper conversion, among others.
- The demand for EVA adhesives has grown significantly from 2017 to 2019. The footwear and leather industry in South Korea witnessed the highest growth (of 27.62%) in the Asia-Pacific EVA adhesives market.
- In 2020, the demand for EVA adhesives declined from all end-user industries because of various factors such as operational and trade restrictions, supply chain constraints, and labor shortages due to the COVID-19 pandemic. The demand from the footwear and leather industry suffered the most, declining by 14.22% y-o-y. As global footwear consumption decreased by 22% y-o-y in 2020, footwear manufacturers concentrated in the Asia-Pacific region had to reduce their production. This negatively affected the demand for EVA adhesives in this industry.
- The industry's growth trend is expected to continue during the forecast period. In volume terms, the demand for EVA adhesives from all end-user industries combined is expected to record a CAGR of 5.09% during the forecast period 2022-2028. The packaging industry favors EVA adhesives over others because of their fast-curing properties and, thus, accounts for the largest share of the demand and is expected to remain the largest end-user industry during the forecast period 2022-2028.
The large manufacturing capacities of the Asia-Pacific region helped to secure the highest demand for EVA adhesives
- From 2017 to 2021, the demand for the EVA adhesives market generated from Asia-Pacific was the highest among all regions. This region's share of adhesive demand has consistently accounted for 46-47% of the global demand because of the region's high manufacturing capacity in all end-user industries. EVA resin-based adhesives with hot-melt technologies generate most of the demand in the area.
- From 2017 to 2019, the demand for adhesives from this region recorded a CAGR of less than 1%. The slow growth in EVA resin-based adhesives was due to a decrease in construction activities and automotive production in the region. The demand from these end-user industries declined at CAGRs of -2.4% and -2.25% in 2018 and 2019, respectively.
- In 2020, the demand from all end-user industries across the region declined due to constraints in operations, labor, raw material, supply chain, and other aspects. Among all industries in the region, the Australian footwear industry took the worst hit, declining by 49.53% Y-o-Y in volume terms in 2020. The decrease in domestic demand was due to the low purchasing power resulting from a weak economy, severely affecting this industry during the pandemic.
- In 2021, the demand for EVA resin-based adhesives quickly rebounded to the pre-pandemic volumes as restrictions eased. The Indian market witnessed the highest Y-o-Y growth of 8.55% in volume terms. The overall demand from the Asia-Pacific region is expected to grow, recording a CAGR of 4.46%, during the forecast period. This demand growth is expected to be driven by the region's construction, packaging, and automotive industries during the forecast period.
Asia-Pacific EVA Adhesives Market Trends
Fast paced growth of e-commerce industry in developing nations to augment the industry
- Packaging is mainly used for protection, containment, information, utility, and promotion. This makes packaging an integral part of most industries. In 2017, packaging usage accounted for 2.5 billion ton of packaging, including paper and paperboard and plastic packaging. In 2020, due to the COVID-19 pandemic, the market registered a negative growth rate of 7.4% due to disruptions in the supply chain, shortage of packaging material, restrictions on the import and export of goods, and factories operating at low capacity.
- Governments of different Asian countries have taken steps to reduce the use of plastic, as China and Indonesia are the first and second-largest contributors to plastic waste in the ocean. China has announced new restrictions on excessive packaging, requiring all food and cosmetics producers to adhere to specific guidelines determining the volume of packaging allowed in proportion to a product. The extended producer responsibility (EPR) regulation imposed by the Indonesian government will oblige producers and retailers to redesign their product packaging to include a higher proportion of recyclable material.
- In 2021, the market registered a positive growth of 8%, with 2.7 billion ton of packaging material used for various purposes. The packaging industry is expected to keep growing due to the rising middle-income population, improvement of supply chains, and rising e-commerce activities, which have significantly boosted the packaging industry in the past few years as special packaging is required for shipping goods. The growing Asian market is expected to boost packaging usage, enabling it to register a CAGR of 5.7% during the forecast period (2022-2028).
Increasing adoption of electric vehicles to drive the industry
- The Asia-Pacific automotive industry is one of the leading industries in the market, as the sales of automotive vehicles are largely increasing. Among all the countries, China is the largest automotive producer, accounting for about 57% of the regional production, followed by Japan with 17%, India with 10%, and South Korea with 8%.
- Vehicle sales in the region have majorly declined along with production, owing to which the utilization of adhesives has been impacted. While the Y-o-Y variation in 2017-18 was -1.8%, it fell further by -6.4% in 2018-19. In 2019-20, regional production was again impacted negatively and recorded a -10.2% decline from the previous year due to the COVID-19 pandemic. The shutdown of manufacturing facilities and the shortage of vehicle components due to disruptions in the supply chain constrained the production level. However, in 2021, the demand for automobiles rose again and is expected to continue, thereby increasing the utilization of adhesives across the region over the forecast period.
- The EV market in Asia-Pacific offers another opportunity for the adhesives market to grow. The rising production and adoption of EVs and hybrid vehicles are boosting the usage of adhesives for electronic component assembly in vehicles. China is the largest producer of EVs globally as well as across the region. From 2016 to 2021, the volume of commercial electric vehicles increased from 562,603 to 1,116,382 units, recording a growth rate of about 98%. These factors are expected to increase the demand for adhesives and result in the higher market growth over the forecast period.
Asia-Pacific EVA Adhesives Industry Overview
The Asia-Pacific EVA Adhesives Market is fragmented, with the top five companies occupying 9.91%. The major players in this market are Aica Kogyo Co..Ltd., Arkema Group, Dow, Henkel AG & Co. KGaA and NANPAO RESINS CHEMICAL GROUP (sorted alphabetically).
Additional Benefits:
- The market estimate (ME) sheet in Excel format
- 3 months of analyst support
TABLE OF CONTENTS
1 EXECUTIVE SUMMARY & KEY FINDINGS
2 REPORT OFFERS
3 INTRODUCTION
- 3.1 Study Assumptions & Market Definition
- 3.2 Scope of the Study
- 3.3 Research Methodology
4 KEY INDUSTRY TRENDS
- 4.1 End User Trends
- 4.1.1 Aerospace
- 4.1.2 Automotive
- 4.1.3 Building and Construction
- 4.1.4 Footwear and Leather
- 4.1.5 Packaging
- 4.1.6 Woodworking and Joinery
- 4.2 Regulatory Framework
- 4.2.1 Australia
- 4.2.2 China
- 4.2.3 India
- 4.2.4 Indonesia
- 4.2.5 Japan
- 4.2.6 Malaysia
- 4.2.7 Singapore
- 4.2.8 South Korea
- 4.2.9 Thailand
- 4.3 Value Chain & Distribution Channel Analysis
5 MARKET SEGMENTATION (includes market size in Value in USD and Volume, Forecasts up to 2028 and analysis of growth prospects)
- 5.1 End User Industry
- 5.1.1 Aerospace
- 5.1.2 Automotive
- 5.1.3 Building and Construction
- 5.1.4 Footwear and Leather
- 5.1.5 Healthcare
- 5.1.6 Packaging
- 5.1.7 Woodworking and Joinery
- 5.1.8 Other End-user Industries
- 5.2 Technology
- 5.2.1 Hot Melt
- 5.2.2 Solvent-borne
- 5.2.3 Water-borne
- 5.3 Country
- 5.3.1 Australia
- 5.3.2 China
- 5.3.3 India
- 5.3.4 Indonesia
- 5.3.5 Japan
- 5.3.6 Malaysia
- 5.3.7 Singapore
- 5.3.8 South Korea
- 5.3.9 Thailand
- 5.3.10 Rest of Asia-Pacific
6 COMPETITIVE LANDSCAPE
- 6.1 Key Strategic Moves
- 6.2 Market Share Analysis
- 6.3 Company Landscape
- 6.4 Company Profiles (includes Global Level Overview, Market Level Overview, Core Business Segments, Financials, Headcount, Key Information, Market Rank, Market Share, Products and Services, and Analysis of Recent Developments).
- 6.4.1 Aica Kogyo Co..Ltd.
- 6.4.2 Arkema Group
- 6.4.3 CEMEDINE Co.,Ltd.
- 6.4.4 Dow
- 6.4.5 H.B. Fuller Company
- 6.4.6 Henkel AG & Co. KGaA
- 6.4.7 NANPAO RESINS CHEMICAL GROUP
- 6.4.8 OKONG Corp.
- 6.4.9 Paramelt B.V.
- 6.4.10 Selic Corp Public Company Limited.
7 KEY STRATEGIC QUESTIONS FOR ADHESIVES AND SEALANTS CEOS
8 APPENDIX
- 8.1 Global Adhesives and Sealants Industry Overview
- 8.1.1 Overview
- 8.1.2 Porter's Five Forces Framework (Industry Attractiveness Analysis)
- 8.1.3 Global Value Chain Analysis
- 8.1.4 Drivers, Restraints, and Opportunities
- 8.2 Sources & References
- 8.3 List of Tables & Figures
- 8.4 Primary Insights
- 8.5 Data Pack
- 8.6 Glossary of Terms
