
米国の加工豚肉:市場シェア分析、産業動向・統計、成長予測(2025年~2030年)
United States Processed Pork Meat - Market Share Analysis, Industry Trends & Statistics, Growth Forecasts (2025 - 2030)- 発行日
- ページ情報
- 英文 167 Pages
- 納期
- 2~3営業日
- 商品コード
- 1692073
- カスタマイズ可能 お客様のご希望に応じて、既存データの加工や未掲載情報(例:国別セグメント)の追加などの対応が可能です。詳細はお問い合わせください。
- 適宜更新あり 本レポートは最新情報反映のため適宜更新し、内容構成変更を行う場合があります。ご検討の際はお問い合わせください。
- 翻訳ツール提供対象 PDF対応AI翻訳ツールの無料貸し出しサービスのご利用が可能です
概要
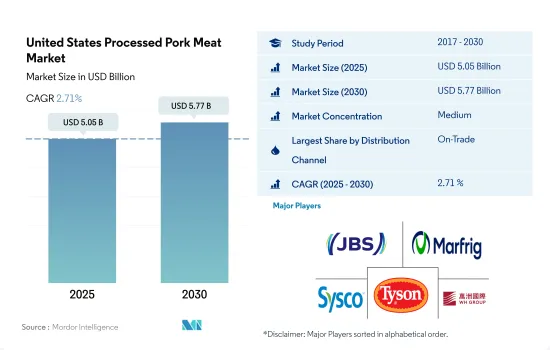
米国の加工豚肉の市場規模は2025年に50億5,000万米ドルと推定・予測され、2030年には57億7,000万米ドルに達し、予測期間(2025-2030年)のCAGRは2.71%で成長すると予測されます。
先進技術の導入がショッピング体験を向上させ、オフトレードチャネルの売上を増加させています。
- 加工豚肉の流通チャネルはオントレードが金額で圧倒しています。豚肉の消費量はオン・トレード・チャネルを通じて増加し、年間約15kgを占める。レストランや外食産業は、惣菜、クックド・ハム、風味と滑らかな食感を付加したロールパンの形で加工豚肉を提供し、消費者の関心を集めています。2022年現在、米国全土には45,000以上の中華料理レストランがあり、広東料理レストランではポークチョップやチャーシューなど、豚肉は欠かせないメニューの一部となっています。
- オフトレード・チャネルは最も急成長している流通チャネルであり、予測期間中に金額ベースでCAGR 3.33%を記録すると予想されます。加工豚肉の宅配や簡単な注文方法が、加工豚肉への需要の高まりとともに、オンライン・チャネルやスーパーマーケット/ハイパーマーケットの利用を促進しています。加工豚肉の消費が増加しているのは、牛肉や家禽類を好む米国の消費者が、kg当たり牛肉価格より50%以上安い豚肉価格を理由に、これまで以上に豚肉を食べるようになったためです。
- 米国のオンライン食料品店の顧客は、フルフィルメント・オプションとして、宅配よりもクリック・アンド・コレクトを好みます。2022年には、顧客は食肉加工品を含む4.4倍の商品を閲覧し、6倍の時間をインターネット・サイトに費やすことになり、オンライン食料品チャネルが最も急成長することになります。予測期間中、オンライン・チャネルは金額ベースでCAGR 18.22%を記録すると予想されます。しかし、フリー・チェックアウト、人工知能、クリーン・ラベルの食肉商品による自動請求などの近代的なスーパーマーケット・テクノロジーは、非売品チャネルを通じた赤身肉の総需要を押し上げると予測されます。
米国の加工豚肉市場動向
国内生産の増加が市場成長を牽引
- 米国は世界第3位の豚肉生産国です。2022年には同地域の豚肉生産量の約73%を占め、同地域の主要な豚肉生産国でもあります。同国の豚肉生産は米国経済に大きな影響を与えています。米国内の6万6,000の養豚場で毎年約1億4,000万頭の市場豚が飼育され、その大半が家族経営であり、数百の包装施設によって約270億ポンドの豚肉が生産されます。養豚と豚肉生産は、付加価値活動を通じて61万人以上の従業員と570億米ドル以上のGDPを支えています。豚肉生産は、米国養豚業者が農場レベルの生産性向上により豚肉の供給量を増やした結果、拡大すると予想されます。
- 2021年には、6万6,000以上の豚肉生産者が1億4,000万頭以上の豚肉を販売し、その総現金収入は280億米ドルを超えました。しかし、豚の生産頭数は2000年の5,911万頭から2021年12月には7,415万頭に増加し、その内訳は市場豚が6,802万頭、繁殖豚が612万頭です。米国の豚の約93%は2,000頭以上の農場で飼育されているが、2,000頭未満の農場で飼育されているのはわずか7%です。家族経営の農場は、米国における養豚場全体の96%、豚の在庫の80%を占めています。
- 頭数が減少しているにもかかわらず、2021年1月から5月までにと畜された豚は前年同期に比べ139万頭、2.6%増加しました。豚肉生産量は3.2%も増加して530万頭でした。しかし、パンデミックの影響により、米国ではと畜場の閉鎖や能力制限が相次いです。
インフレは国内の豚肉価格に影響すると予想される
- 米国では、豚肉サプライチェーン全体の人件費の上昇、供給のボトルネック、遅延などにより、2017年から2022年にかけて豚肉価格が11.74%上昇しました。その他、収穫ラインの高速化を禁止する連邦裁判所の判決により豚の包装能力が2.5%減少したこと、総コストが23.9%増加したこと、飼料コストが35.5%増加したこと、そして最も重大なこととして、労働力不足が生産性を阻害し給与が上昇したことなどが挙げられます。
- 2022年の豚肉生産量はわずかに2%減少しました。輸入は20%増加し、輸出は同年9%減少しました。そのため、2022年の1人当たり豚肉供給量は2021年より0.3ポンド多くなりました。しかし、2022年の豚肉価格が前年より高かったのは、主にインフレの影響によるものです。2022年10月の豚肉小売価格の平均は1ポンド当たり5.047米ドルで、前年より23.1セント上昇しました。2021年11月の豚肉小売価格の高値平均は1ポンドあたり約4.823米ドルでした。
- 豚肉の国内供給は拡大が見込まれるもの、国内の豚肉価格は今後数年間は安定的に推移すると予想されます。2021年の生体換算平均価格は約67米ドル/トンであったが、2022年には約71米ドル/トンとなり、2023年には約71米ドル/トンと比較的安定して推移すると予想されます。2023年の国内生産は、豚の収穫量が一貫して増加し、動物の体重が増加したため、2022年に比べて1%増加すると予想されました。メキシコや中国のような重要な輸入国からの需要が減少したため、米国の輸出は2023年に減少すると予測されました。こうした要因が重なり、今後数年間は豚肉価格が安定する可能性があります。
米国の加工豚肉産業の概要
米国の加工豚肉市場は適度に統合されており、上位5社で46.04%を占めています。この市場の主要企業は以下の通りです。 JBS SA, Marfrig Global Foods SA, Sysco Corporation, Tyson Foods Inc. and WH Group Limited(sorted alphabetically).
その他の特典
- エクセル形式の市場予測(ME)シート
- 3ヶ月のアナリストサポート
目次
第1章 エグゼクティブサマリーと主な調査結果
第2章 イントロダクション
- 調査の前提条件と市場定義
- 調査範囲
- 調査手法
第3章 主要産業動向
- 価格動向
- 豚肉
- 生産動向
- 豚肉
- 規制の枠組み
- 米国
- バリューチェーンと流通チャネル分析
第4章 市場セグメンテーション
- 流通チャネル
- オフトレード
- コンビニエンスストア
- オンライン・チャネル
- スーパーマーケットとハイパーマーケット
- その他
- オントレード
- オフトレード
第5章 競合情勢
- 主要な戦略動向
- 市場シェア分析
- 企業情勢
- 企業プロファイル
- BRF SA
- Hormel Foods Corporation
- JBS SA
- Johnsonville LLC
- Marcangelo Foods Inc.
- Marfrig Global Foods SA
- NH Foods Ltd
- Sysco Corporation
- Tyson Foods Inc.
- WH Group Limited
第6章 CEOへの主な戦略的質問
第7章 付録
- 世界概要
- 概要
- ファイブフォース分析フレームワーク
- 世界のバリューチェーン分析
- 市場力学(DROs)
- 情報源と参考文献
- 図表一覧
- 主要洞察
- データパック
- 用語集
目次
The United States Processed Pork Meat Market size is estimated at 5.05 billion USD in 2025, and is expected to reach 5.77 billion USD by 2030, growing at a CAGR of 2.71% during the forecast period (2025-2030).
The incorporation of advanced technologies is improving the shopping experience, thereby increasing sales in off-trade channels
- On-trade dominates the distribution channel for processed pork meat by value. The consumption of pork meat increased through the on-trade channel, accounting for around 15 kg per year. Restaurants and foodservices offer processed pork in the form of deli meats, cooked ham, and rolls with additional flavors and smooth texture, attracting consumer interest. As of 2022, there were more than 45,000 Chinese restaurants across the United States, and pork is an integral part of the menu in Cantonese restaurants, including Pork Chops and Char Siu.
- The off-trade channel is expected to be the fastest-growing distribution channel and register a CAGR of 3.33% by value during the forecast period. Doorstep delivery of processed pork products and easy ordering options, along with the rising demand for processed pork products, are encouraging the use of online channels and supermarkets/hypermarkets. The consumption of processed pork is increasing, as US consumers who prefer beef and fowl are now eating more pork than ever due to its lower price, which is more than 50% less than the beef price per kg.
- Online grocery customers in the United States prefer click-and-collect over home delivery as their preferred fulfillment option. Customers viewed 4.4 times more products, including processed meat products, and spent six times more time on internet sites in 2022, making online grocery channels the fastest-growing. During the forecast period, the online channel is expected to record a CAGR of 18.22% in terms of value. However, modern supermarket technologies such as free checkout, artificial intelligence, and auto-billing with clean-label meat goods are projected to boost the total demand for red meat through the off-trade channel.
United States Processed Pork Meat Market Trends
Increased domestic production is driving market growth
- Globally, the United States is the third-largest pork producer. It is also the leading pork producer in the region, accounting for around 73% of the region's pork production in 2022. Pork production in the country has a substantial impact on the US economy. About 140 million market hogs are raised on the 66,000 pig farms in the United States each year, the vast majority of which are family-run, and nearly 27 billion pounds of pork are produced by the hundreds of packing facilities. Hog and pork farming supports more than 610,000 employees and more than USD 57 billion in GDP through value-added activity. Pork production is expected to expand as a result of US hog growers' greater supply of pork meat due to higher farm-level productivity.
- In 2021, more than 66,000 pork producers sold over 140 million hogs worth more than USD 28 billion in gross cash revenue. However, hog production rose from 59.11 million heads in 2000 to 74.15 million heads in December 2021, including 68.02 million market hogs and 6.12 million breeding hogs. About 93% of the hogs in the United States are raised on farms with 2,000 or more hogs, whereas only 7% are raised on farms with fewer than 2,000 animals. Family farms account for 96% of all hog farms and 80% of hog inventories in the United States.
- Despite the declining herd population, hogs slaughtered from January 2021 to May 2021 were up by 1.39 million heads or 2.6% compared to the same period the previous year. Pork production was up by as much as 3.2% to 5.3 million. However, due to the pandemic, there were numerous slaughterhouse closures or capacity restrictions in the United States.
Inflation is expected to affect the prices of pork in the country
- In the United States, pork prices grew by 11.74% between 2017 and 2022 due to rising labor expenses across the pork supply chain, supply bottlenecks, and delays. Other issues included a 2.5% decrease in hog packing capacity as a result of a federal court decision prohibiting faster harvesting line speeds, an increase of 23.9% in total costs, a 35.5% increase in feed costs, and, most critically, a labor scarcity that hampered productivity and increased salaries.
- Pork production slightly went down by 2% in 2022. Imports grew by 20%, while exports declined by 9% in the same year. Thus, the per capita pork supply was 0.3 pounds more in 2022 than in 2021. However, the high price of pork in 2022 compared to the previous year was mainly due to the effect of inflation. In October 2022, the retail price of pork averaged USD 5.047 per pound, an increase of 23.1 cents from the previous year. In November 2021, the high average for retail pork was around USD 4.823 per pound.
- The price of pork in the country is expected to stay stable in the coming years, although the domestic supply of pork is anticipated to expand. Compared to around USD 67/cwt in 2021, the average price on a live equivalent basis was USD 71/cwt in 2022, which was anticipated to stay relatively stable at about USD 71/cwt in 2023. Domestic production was expected to increase by 1% in 2023 compared to 2022 due to the consistently rising pig harvests and higher animal weights. Due to a drop in demand from important importers like Mexico and China, US exports were projected to decline in 2023. These factors may coalesce to stability in pork prices in the next few years.
United States Processed Pork Meat Industry Overview
The United States Processed Pork Meat Market is moderately consolidated, with the top five companies occupying 46.04%. The major players in this market are JBS SA, Marfrig Global Foods SA, Sysco Corporation, Tyson Foods Inc. and WH Group Limited (sorted alphabetically).
Additional Benefits:
- The market estimate (ME) sheet in Excel format
- 3 months of analyst support
TABLE OF CONTENTS
1 EXECUTIVE SUMMARY & KEY FINDINGS
2 INTRODUCTION
- 2.1 Study Assumptions & Market Definition
- 2.2 Scope of the Study
- 2.3 Research Methodology
3 KEY INDUSTRY TRENDS
- 3.1 Price Trends
- 3.1.1 Pork
- 3.2 Production Trends
- 3.2.1 Pork
- 3.3 Regulatory Framework
- 3.3.1 United States
- 3.4 Value Chain & Distribution Channel Analysis
4 MARKET SEGMENTATION (includes market size in Value in USD, Forecasts up to 2030 and analysis of growth prospects)
- 4.1 Distribution Channel
- 4.1.1 Off-Trade
- 4.1.1.1 Convenience Stores
- 4.1.1.2 Online Channel
- 4.1.1.3 Supermarkets and Hypermarkets
- 4.1.1.4 Others
- 4.1.2 On-Trade
- 4.1.1 Off-Trade
5 COMPETITIVE LANDSCAPE
- 5.1 Key Strategic Moves
- 5.2 Market Share Analysis
- 5.3 Company Landscape
- 5.4 Company Profiles (includes Global level Overview, Market level overview, Core Business Segments, Financials, Headcount, Key Information, Market Rank, Market Share, Products and Services, and analysis of Recent Developments)
- 5.4.1 BRF SA
- 5.4.2 Hormel Foods Corporation
- 5.4.3 JBS SA
- 5.4.4 Johnsonville LLC
- 5.4.5 Marcangelo Foods Inc.
- 5.4.6 Marfrig Global Foods SA
- 5.4.7 NH Foods Ltd
- 5.4.8 Sysco Corporation
- 5.4.9 Tyson Foods Inc.
- 5.4.10 WH Group Limited
6 KEY STRATEGIC QUESTIONS FOR MEAT INDUSTRY CEOS
7 APPENDIX
- 7.1 Global Overview
- 7.1.1 Overview
- 7.1.2 Porter's Five Forces Framework
- 7.1.3 Global Value Chain Analysis
- 7.1.4 Market Dynamics (DROs)
- 7.2 Sources & References
- 7.3 List of Tables & Figures
- 7.4 Primary Insights
- 7.5 Data Pack
- 7.6 Glossary of Terms
- 発行日
- 発行
- Mordor Intelligence
- ページ情報
- 英文 167 Pages
- 納期
- 2~3営業日


