
|
市場調査レポート
商品コード
1911355
欧州のシーフード市場:市場シェア分析、業界動向と統計、成長予測(2026年~2031年)Europe Seafood - Market Share Analysis, Industry Trends & Statistics, Growth Forecasts (2026 - 2031) |
||||||
カスタマイズ可能
適宜更新あり
|
|||||||
| 欧州のシーフード市場:市場シェア分析、業界動向と統計、成長予測(2026年~2031年) |
|
出版日: 2026年01月12日
発行: Mordor Intelligence
ページ情報: 英文 251 Pages
納期: 2~3営業日
|

概要
欧州のシーフード市場規模は、2026年に874億4,000万米ドルと推定されております。
これは2025年の831億7,000万米ドルから成長した数値であり、2031年には1,123億3,000万米ドルに達すると予測されております。2026年から2031年にかけては、CAGR5.14%で拡大が見込まれております。
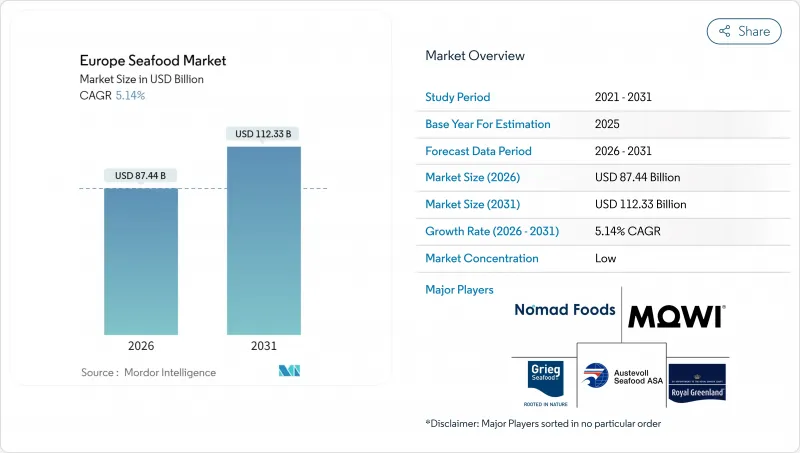
この拡大は、持続可能な養殖業への地域全体の断固たる転換、堅調なコールドチェーン投資、そして高タンパク質食への消費者嗜好の高まりによって推進されています。スペインは二つの海岸線における収穫・加工の強みを背景に、地域需要の約3分の1を占めており、一方イタリアは高級加工品と南部における新たな養殖ライセンス取得を追い風に、最も急速な成長を見せています。スーパーマーケットが日常販売を支配し続けていますが、デジタルネイティブの消費者が主導するオンラインシフトが急速に進み、鮮度とトレーサビリティを保証できる生産者に利益をもたらしています。製品レベルでは、魚が欧州水産物市場の基盤を維持していますが、革新的な陸上養殖システムが過去の輸入依存を克服するにつれ、エビが漸増的な成長のペースを決定づけています。
欧州水産物市場の動向と洞察
高タンパク質食への消費者嗜好の変化
欧州の消費者はタンパク質豊富な栄養プロファイルをますます重視しており、陸上タンパク源の代替を求める健康志向層におけるシーフード消費量は年間12%増加しています。欧州食品安全機関(EFSA)は、シーフードが植物性タンパク質と比較して優れた生体利用能を持つ完全なアミノ酸プロファイルを提供することを確認しており、ドイツ、オランダ、スカンジナビア諸国における健康意識の高い消費者層の採用を促進しています。この食習慣の変化は、可処分所得がプレミアムシーフードの購入を支える都市部市場で特に加速しています。一方、地中海諸国では、伝統的なシーフード消費パターンを活用し、高付加価値種や調理法への拡大を図っています。EU栄養・健康表示規則(EC)No 1924/2006を含む規制遵守枠組みにより、シーフード販売業者は検証済みの健康効果を伝えることが可能となり、従来はタンパク質サプリメントに依存していた消費者層への市場浸透を支援しています。
コールドチェーンと物流能力の拡大
温度管理された流通ネットワークへの戦略的投資により、これまでアクセスが困難だった欧州内陸市場が開拓され、2024年以降、中東欧回廊におけるコールドチェーン容量は年間18%のペースで拡大しています。欧州委員会の欧州横断交通ネットワーク(TEN-T)プログラムは、冷蔵倉庫インフラ整備に12億ユーロを配分し、沿岸加工施設から内陸小売ネットワークまで、48時間以内の生鮮水産物流通を実現しました。高度な物流能力は、特にノルウェー産サーモンやスコットランド産貝類の生産者に恩恵をもたらし、サプライチェーンの制約により水産物消費が伝統的に低調だったドイツ、ポーランド、チェコ市場へのアクセスを可能にしております。ロッテルダムとハンブルクの自動化冷蔵施設は流通ハブとして機能し、廃棄率を8%から3%未満に低減するとともに、製品の保存期間を40%延長し、これまで十分にサービスが行き届いていなかった地域セグメントへの市場拡大を直接支援しております。
変動の激しい漁獲量
欧州の漁獲漁業は前例のない変動に直面しており、評価対象資源の約70%が過剰漁獲と分類されることで供給不安が生じ、従来の水産物バリューチェーンを混乱させています。欧州環境庁の報告によれば、地中海のカレイ資源は2020年以降40%減少、北海のタラ漁獲枠は年間15%減少しており、加工業者は代替種への切り替えや養殖依存度の増加を余儀なくされています。気候変動による魚種の移動パターン変化により、伝統的な漁場が北方にシフトしています。これにより漁船運航者はより長距離を航行する必要が生じると同時に、EU排出量取引制度(EU ETS)の下でより厳格な燃料排出規制に直面しています。欧州委員会の2025年総漁獲可能量(TAC)割当は、資源への継続的な圧力を反映しており、欧州カレイや大西洋サバなどの主要商業種は割当削減の対象となっています。これにより天然魚介類の入手が制限され、加工事業における原材料コストが上昇しています。
セグメント分析
魚類は2025年の収益の78.82%を占め、欧州水産物市場の構造的核としての役割を確固たるものにしております。統合されたノルウェー産サーモンチェーン、大西洋マグロ漁船団、バルト海トロール漁船は、複数の価格帯に対応する生鮮・缶詰・燻製製品を供給しております。継続的な遺伝的改良、循環式養殖システム、認証された持続可能性ラベルが消費者の信頼と小売店の棚優先度を維持しております。
エビは現在規模こそ小さいもの、成長の牽引役です。スペイン、イタリア、ギリシャにおける陸上バイオフロック式養殖タンクが15kg/m3を超える密度に拡大し、アジアからの輸入品と比較して物流コストを削減した結果、2031年までのCAGR5.69%は他の全種を上回ります。有機認証や抗生物質不使用の表示は40~60%の価格プレミアムをもたらし、欧州水産物市場規模におけるプレミアムセグメントの拡大に寄与しています。電子商取引やシェフ主導のレストラン流通網が、高品質な欧州産エビの需要をさらに拡大しています。
2025年には養殖が68.08%の価値を占め、欧州が不安定な天然漁獲から管理生産へ移行していることを示しています。自動化、スマートセンサー、選択的育種により収量が向上し、厳格なEU環境基準も満たしています。アイルランドの循環式プラットフォームやノルウェーの完全密閉型沖合ケージは操業期間を延長し疾病リスクを低減、欧州水産物市場における優位性を支えています。
2026年から2031年にかけて、養殖業のCAGR 6.86%は、沖合養殖のライセンシング拡大と藻類ベース飼料の画期的な進展(コスト15%削減)に左右されます。欧州海洋漁業基金は閉鎖型養殖のパイロット事業や海藻混養技術を支援し、循環型経済の収益を組み込んでおります。こうした進展により、国産魚介類が輸入品と直接競合可能となり、生態系への負荷を増大させることなく欧州水産物市場の規模拡大が図られております。
欧州水産物市場は、製品タイプ(魚、エビ、その他水産物)、調達源(養殖、天然漁獲)、形態(缶詰、生鮮、冷凍、加工品)、流通経路(スーパーマーケット・ハイパーマーケット、コンビニエンスストア、オンライン小売、その他)、地域(フランス、ドイツ、イタリア、オランダ、ロシア、スペイン、英国、その他欧州)によって区分されています。市場予測は、金額(米ドル)および数量(単位)で提供されます。
その他の特典:
- エクセル形式の市場予測(ME)シート
- アナリストによる3ヶ月間のサポート
よくあるご質問
目次
第1章 イントロダクション
- 調査範囲
第2章 調査手法
第3章 エグゼクティブサマリー
第4章 市場情勢
- 市場促進要因
- 高タンパク質食への消費者嗜好の変化
- コールドチェーン及び物流能力の拡充
- EU資金による持続可能性・トレーサビリティプログラム
- 手軽なシーフード料理への需要拡大
- 藻類飼料による養殖業の台頭が飼料コスト削減に貢献
- 北欧排他的経済水域(EEZ)における沖合養殖業のライセンシング自由化
- 市場抑制要因
- 不安定な漁獲漁業の水揚げ量
- アジア産エビに対する厳格な輸入関税割当
- カーボンラベルによる高炭素排出製品の購入抑制
- 洋上風力発電との海洋空間利用における競合の増加
- バリュー/サプライチェーン分析
- 規制情勢
- テクノロジーの展望
- ポーターのファイブフォース
- 新規参入業者の脅威
- 供給企業の交渉力
- 買い手の交渉力
- 代替品の脅威
- 競争企業間の敵対関係
第5章 市場規模と成長予測
- タイプ別
- 魚
- サーモン
- マグロ
- スケトウダラ
- ティラピア
- その他
- エビ
- その他の魚介類(頭足類、二枚貝など)
- 魚
- ソース別
- 養殖
- 天然物
- 形態別
- 缶詰
- 生鮮
- 冷凍
- 加工品(燻製、衣揚げ、調理済み)
- 流通チャネル
- スーパーマーケット・ハイパーマーケット
- コンビニエンスストア
- オンライン小売
- その他
- 国別
- フランス
- ドイツ
- イタリア
- オランダ
- ロシア
- スペイン
- 英国
- その他欧州地域
第6章 競合情勢
- 戦略的動向
- 市場シェア分析
- 企業プロファイル
- Associated Seafoods Ltd
- Austevoll Seafood ASA
- Bolton Group SRL
- Grieg Seafood ASA
- Iceland Seafood International hf
- Kilic Seafood Co.
- Mowi ASA
- Nomad Foods Ltd
- Nordic Seafood AS
- Royal Greenland AS
- Seafood King EU BV
- Sofina Foods
- Sykes Seafood Ltd
- Thai Union Group PCL
- Leroy Seafood Group
- SalMar ASA
- Samherji hf
- Nueva Pescanova SA
- Young's Seafood Ltd
- Clearwater Seafoods
