
アジア太平洋の植物性タンパク質成分:市場シェア分析、産業動向と統計、成長予測(2025年~2030年)
Asia-Pacific Plant Protein Ingredients - Market Share Analysis, Industry Trends & Statistics, Growth Forecasts (2025 - 2030)
- 発行日
- ページ情報
- 英文 268 Pages
- 納期
- 2~3営業日
- 商品コード
- 1690993
- カスタマイズ可能 お客様のご希望に応じて、既存データの加工や未掲載情報(例:国別セグメント)の追加などの対応が可能です。詳細はお問い合わせください。
- 適宜更新あり 本レポートは最新情報反映のため適宜更新し、内容構成変更を行う場合があります。ご検討の際はお問い合わせください。
- 翻訳ツール提供対象 PDF対応AI翻訳ツールの無料貸し出しサービスのご利用が可能です
概要
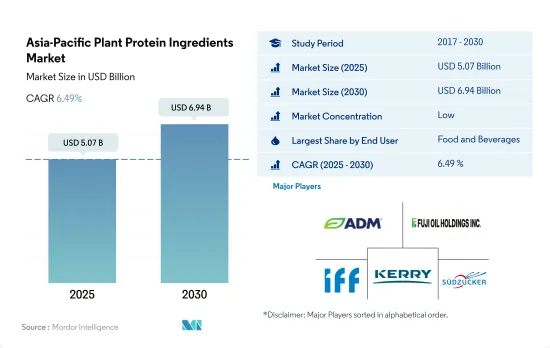
アジア太平洋の植物性タンパク質原料市場規模は2025年に50億7,000万米ドルと推定され、2030年には69億4,000万米ドルに達すると予測され、予測期間中(2025~2030年)のCAGRは6.49%で成長すると予測されます。
エンドユーザー別では飲食品と動物飼料が主要シェアを占める
- アジア太平洋では、飲食品産業が植物性タンパク質の主要ユーザーとして際立っています。タンパク質の機能性に対する需要の急増と、タンパク質が豊富な食事に対する意識の高まりが、この動向を後押ししています。飲食品領域では、肉/鶏肉/水産物と肉代替製品のサブセグメントが大きなシェアを占め、2023年には45.75%を占めます。特筆すべきは、植物性タンパク質が肉の代替品としてますます使用されるようになり、この地域で増加する菜食主義者の人口に対応していることです。この動向は中国がリードしており、世界最大のベジタリアン人口で知られるインドが僅差で続いています。このセグメントの主要参入企業には、大豆、小麦、米のプロテインがあります。
- 一方、スナック菓子のサブセグメントは、2024~2029年のCAGRが金額ベースで7.01%と予測され、成長のフロントランナーとして浮上しています。タンパク質の中では、大豆タンパク質が市場の大部分を占めています。大豆プロテインを間食にすると、食欲が抑制されるだけでなく、特に10代の若者の食生活が改善されるという研究結果もあります。大豆タンパクの魅力はさらに、幅広いスナック組成を可能にする適応性にあります。
- 動物飼料産業に目を向けると、大豆タンパクは植物性タンパクの利用において第2位に位置しています。予測では、2024~2029年のCAGRは金額ベースで6.48%と健全です。エンドウタンパク質のような植物性タンパク質は、反芻動物、家禽、豚、さらには水産飼料やペットフードなど、さまざまな家畜に適しており、多くの利点を記載しています。飼料におけるエンドウタンパクの人気が高まっているのは、ペレットや顆粒を形成するのに重要な結合プロセスを助けるといった機能的特性によるものです(水に溶けないため、ペレットの破壊が少ない)。
消費者の植物ベースの食品と飲食品への傾倒で中国が市場を独占
- 2023年には、中国が植物性タンパク質の需要急増の先頭に立りました。これらのタンパク質は、その持続可能性と無残な自然性で賞賛され、環境保護主義者と増加する菜食主義者層からますます支持されています。二酸化炭素排出量と食糧不足に対する懸念の高まりが、中国の植物性タンパク質市場をさらに活性化しています。用途別に見ると、飲食品産業が圧倒的で、2022年の数量シェアは53.44%に達します。僅差で続いたのは動物飼料産業で、45.9%のシェアを確保しました。動物飼料セグメントは、2024~2029年にかけて金額ベースで9.58%のCAGRが予測され、市場のトップランナーになるものと考えられます。
- 植物ベースのセグメントへの投資は、需要状況の形成に極めて重要な役割を果たしました。特筆すべきは、植物性食品の資金調達が30%急増し、2億8,700万米ドルから3億7,200万米ドルに跳ね上がったことです。さらに、戦略的パートナーシップは、実質的な変化を促進し、タンパク質の移行を促進する鍵を握っています。こうした協力関係は、民間セクタ、農業従事者、金融機関、研究機関、政府機関を結びつけることで、イノベーションを促進し、市場のエコシステムを強化することができます。
- マレーシアは世界的に傑出しており、2024~2029年のCAGRは6.82%で、最も高い金額成長を示すと予想されます。一方、インドはその活気ある飲食品産業に牽引され、消費量ではこれに次ぐ。同国ではヴィーガン人口が拡大しており、植物由来の製品を求める声が高まっています。注目すべきことに、2022年にはマレーシア人の68%が植物由来の代替食品を受け入れており、まだこれらの製品を探求していない人はわずか23%に過ぎないです。
アジア太平洋の植物性タンパク質原料市場の動向
植物性タンパク質の消費拡大が植物性タンパク質原料セグメントの主要企業に機会を与える
- アジア太平洋では、植物性タンパク質の有用性に対する認識と証明が高まっており、植物性タンパク質はアジア太平洋市場で関心を集めています。すべての植物性タンパク質の中で、大豆タンパク質は、様々な食品における原料の受容性の向上とその生産量の増加により、市場シェアを占めています。2020~2021年の中国の大豆粕消費量は72.68百万MTで、2018年より約9%増加しました。研究への高額の投資、急速な技術進歩、先進的イノベーション技術が、大豆タンパク質を含む開発されたタンパク質原料の使用をもたらしている主要因の一部です。
- 大豆、エンドウ豆、麻、ジャガイモなどのアレルゲンフリー植物性タンパク質の主要促進要因は、ベジタリアンライフスタイルの採用の増加、ラクトースフリーとグルテンフリー製品に対する需要の増加、健康に関連する問題に対する懸念の高まりです。2021年には、インドの消費者の約81%が肉食を控えています。動物性タンパク質に対する植物性タンパク質原料の主要利点には、高い栄養価、数種類のビタミンとミネラルの優れた供給源であること、様々な食品産業における技術の進歩、消費者の嗜好を変えると予想される天然と有機代替物への需要の増加が含まれます。
- 同地域における植物性タンパク質の消費の増加と消費者の受容は、メーカーがこれらの成分を強化した製品を革新する原動力となっています。日本で消費される主要穀物は大豆、米、小麦で、トウモロコシやエンドウ豆など他タイプもあります。植物性タンパク質の増加は、今後数年間も食品メーカーに機会を提供し続けると予想されます。
大豆、小麦、エンドウ豆は植物性タンパク質メーカーの原料として大きく貢献しています。
- グラフは、エンドウ(乾燥)、コメ、大豆、小麦など、植物性タンパク質に使用される基本原料の生産量を示しています。中国におけるトウモロコシ生産の増加は、大豆生産の減少につながっています。植物性タンパク質全体の生産量は、菜食主義者の増加により2016~2020年にかけて4%増加し、2020年には14%を占めます。例えば、2020年の中国の大豆生産量は約1,960万トン、小麦生産量は約1億3,400万トンです。
- インドの大豆作付面積は2020~2021年に8%以上増加し、生産量は31.5%以上増加して122.475トンとなりました。これは、公開会社と非公開会社が協力して様々な技術を開発し、農業従事者と直接関わり、農業従事者所得の向上と大豆収量の増加を図ったためと考えられます。2014年には、州政府の総合農業開発官民パートナーシップ(PPPIAD)がADMと協力して、大豆栽培の新技術を導入し、農業従事者の収量増に貢献しました。
- この地域では、生産量の増加により、植物由来の様々なタンパク質が可能になっています。主にダイズが中心で、作付面積では日本で最も多いマメ科植物です(141,800ヘクタール)。日本では米の生産も盛んです。日本では、230万戸の農業従事者の約85%が毎年米を作付しています。しかしオーストラリアでは、農業従事者は約3億9,400万ヘクタールで8万8,073の作物・家畜を生産しています。約335億米ドル相当の農産物が生産されました。2021年、リヴァリーナの稲作は約45万トンに達しました。この作柄は、干ばつと低水量配分の影響を受けた2020年産米の10倍でした。
アジア太平洋の植物性タンパク質原料産業概要
アジア太平洋の植物性タンパク質原料市場はセグメント化されており、上位5社で16.24%を占めています。この市場の主要企業は、 Archer Daniels Midland Company、Fuji Oil Group、International Flavors & Fragrances、Inc.、Kerry Group PLC、Sudzucker AGなどです。
その他の特典
- エクセル形式の市場予測(ME)シート
- 3ヶ月間のアナリストサポート
目次
第1章 エグゼクティブサマリーと主要調査結果
第2章 イントロダクション
- 調査の前提条件と市場定義
- 調査範囲
- 調査手法
第3章 主要産業動向
- エンドユーザー市場規模
- ベビーフードと乳児用調製粉乳
- ベーカリー
- 飲料
- 朝食用シリアル
- 調味料/ソース
- 菓子類
- 乳製品と乳製品代替製品
- 高齢者栄養・医療栄養
- 肉・鶏肉・魚介類と肉代替製品
- RTE/RTC食品
- スナック
- スポーツ/パフォーマンス栄養
- 動物飼料
- パーソナルケアと化粧品
- タンパク質消費動向
- 植物
- 生産動向
- 植物
- 規制の枠組み
- オーストラリア
- 中国
- インド
- 日本
- バリューチェーンと流通チャネル分析
第4章 市場セグメンテーション
- プロテインタイプ
- ヘンプ・プロテイン
- エンドウ豆プロテイン
- ポテト・プロテイン
- 米プロテイン
- 大豆プロテイン
- 小麦プロテイン
- その他の植物性プロテイン
- エンドユーザー
- 動物飼料
- 飲食品
- サブエンドユーザー別
- ベーカリー
- 飲料
- 朝食用シリアル
- 調味料/ソース
- 菓子類
- 乳製品・乳製品代替品
- 肉・鶏肉・魚介類と肉代替製品
- RTE/RTC食品
- スナック
- パーソナルケアと化粧品
- サプリメント
- サブエンドユーザー別
- ベビーフードと乳児用調製粉乳
- 高齢者栄養と医療栄養
- スポーツ/パフォーマンス栄養
- 国別
- オーストラリア
- 中国
- インド
- インドネシア
- 日本
- マレーシア
- ニュージーランド
- 韓国
- タイ
- ベトナム
- その他のアジア太平洋
第5章 競合情勢
- 主要な戦略動向
- 市場シェア分析
- 企業情勢
- 企業プロファイル
- Archer Daniels Midland Company
- Bunge Limited
- CHS Inc.
- Fuji Oil Group
- International Flavors & Fragrances, Inc.
- Kerry Group PLC
- Nagata Group
- Nippn Corporation
- Shandong Jianyuan Bioengineering Co. Ltd
- Sudzucker AG
- Tereos SCA
- Wilmar International Ltd
第6章 CEOへの主要戦略的質問
第7章 付録
- 世界概要
- 概要
- ファイブフォース分析フレームワーク
- 世界のバリューチェーン分析
- 市場力学(DROs)
- 情報源と参考文献
- 図表一覧
- 主要な洞察
- データパック
- 用語集
目次
The Asia-Pacific Plant Protein Ingredients Market size is estimated at 5.07 billion USD in 2025, and is expected to reach 6.94 billion USD by 2030, growing at a CAGR of 6.49% during the forecast period (2025-2030).
Food and beverage and animal feed hold major shares by end user
- In Asia-Pacific, the food and beverage industry stands out as the primary user of plant proteins. The surge in demand for protein functionalities, coupled with a growing awareness of protein-rich diets, propels this trend. Within the food and beverage domain, the meat/poultry/seafood and meat alternative products sub-segment took the lion's share, accounting for 45.75% in 2023. Notably, plant proteins are increasingly being used as meat substitutes, catering to the rising vegan population in the region. China leads the way in this trend, closely followed by India, which is known for having the world's largest vegetarian populace. Key players in this space include soy, wheat, and rice proteins.
- On the flip side, the snacks sub-segment emerges as the frontrunner in growth, with a projected CAGR of 7.01% in value from 2024 to 2029. Among the proteins, soy protein commands a significant portion of the market. Studies highlight that snacking on soy protein not only enhances appetite control but also boosts diet quality, especially among teenagers. Its appeal further lies in its adaptability, allowing for a wide range of snack compositions.
- Turning to the animal feed industry, it takes the second spot in the utilization of plant proteins. Projections suggest a healthy CAGR of 6.48% in value from 2024 to 2029. Plant proteins, like pea protein, offer a host of benefits, being suitable for a variety of livestock, including ruminants, poultry, pigs, and even in aquafeed and pet food. Their rising popularity in feeds can be attributed to their functional properties, such as aiding in the binding process crucial for forming pellets or granules (thanks to their water insolubility, which reduces pellet breakdown).
China dominates the market with consumer inclination toward plant-based food and beverages
- In 2023, China spearheaded the surge in demand for plant proteins. These proteins, lauded for their sustainability and cruelty-free nature, are increasingly favored by environmentalists and the growing vegan demographic. Heightened concerns over carbon footprints and food shortages have further catalyzed China's plant protein market. Breaking down the applications, the food and beverage industry dominated, commanding a substantial 53.44% volume share in 2022. Following closely was the animal feed industry, securing a 45.9% share. The animal feed segment is poised to be the market's frontrunner, with a projected CAGR of 9.58% in value, spanning 2024-2029.
- Investments in the plant-based arena played a pivotal role in shaping the demand landscape. Notably, plant-based food funding surged by 30%, leaping from USD 287 million to USD 372 million, largely buoyed by TiNDLE, a startup from Singapore, during its series A funding. Moreover, strategic partnerships hold the key to driving substantial change and expediting the protein transition. These collaborations can fuel innovation and fortify the market's ecosystem by uniting the private sector, farmers, financial entities, research institutions, and governmental bodies.
- Malaysia is the standout on the global stage and is poised to exhibit the highest value growth, with a CAGR of 6.82% from 2024 to 2029. Meanwhile, India, led by its vibrant food and beverage industry, is closely followed in consumption. The country's expanding vegan populace is increasingly clamoring for plant-based offerings. Notably, in 2022, a significant 68% of Malaysians embraced plant-based alternatives, leaving only a mere 23% who had yet to explore these products.
Asia-Pacific Plant Protein Ingredients Market Trends
The consumption growth of plant protein fuels opportunities for key players in the plant protein ingredients segment
- Plant proteins are gaining interest in the Asia-Pacific market as awareness and proof of their benefits are rising in the region. Among all plant proteins, soy proteins occupy the market share with the increased acceptability of the ingredients in different foods and their increased production. The volume of soybean meal consumption in China in 2020-21 was 72.68 MMT, which was around 9% more than in 2018. High investments in research, rapid technological advancements, and advanced innovation techniques are some of the major factors resulting in the use of developed protein ingredients, including soy proteins.
- Major drivers of allergen-free plant proteins such as soy, pea, hemp, and potato are the rising adoption of a vegetarian lifestyle, increasing demand for lactose-free and gluten-free products, and growing concerns about health-related problems. Around 81% of Indian consumers restrained meat from their diet in 2021. Major benefits of plant protein ingredients over animal proteins include high nutritional value, being a good source of several vitamins and minerals, technological advancements in various food industries, and increasing demand for natural and organic substitutes, which are expected to change consumer preferences.
- The increasing consumption of plant proteins and consumer acceptance in the region are driving manufacturers to innovate products fortified with these ingredients. Major grains consumed in Japan are soybeans, rice, and wheat, along with some other types like corn and peas. The rise in plant-based protein is expected to continue to provide opportunities for food manufacturers in the coming years.
Soy, wheat, and peas contribute majorly as raw materials for plant protein manufacturers
- The graph given depicts the production of basic raw materials used for plant protein, including peas (dry), rice, soybeans, and wheat. The increase in maize production in China is leading to a decline in soybean production. The overall plant protein production increased by 4% from 2016 to 2020 due to the increased vegan population, which accounted for 14% in 2020. For instance, in 2020, the production of soybeans in China amounted to approximately 19.6 million tons, while wheat production in China amounted to approximately 134 million tons.
- India's soybean acreage increased by over 8% in 2020-21, while production increased by more than 31.5% to 122.475 lakh tonnes. This could be attributed to the collaboration of public and private companies in developing various techniques and directly engaging with farmers to enhance farm incomes and increase soybean yield. In 2014, the state government's Public-Private Partnership for Integrated Agriculture Development (PPPIAD), in collaboration with ADM, introduced new technologies for soybean cultivation that aided farmers in increasing their yields.
- The region's various proteins from plant sources are possible due to increased production. It is mainly dominated by soybean, the most planted legume in Japan in terms of acreage (141,800 ha). Significant rice production also takes place in Japan. About 85% of the 2.3 million farms in Japan plant rice yearly. However, in Australia, farmers produced around 394 million hectares of 88,073 crop and livestock businesses. Around USD 33.5 billion worth of agricultural products were produced. In 2021, Riverina rice crops amounted to around 450,000 paddy tonnes. The crop was 10 times larger than the 2020 rice crop impacted by drought and low water allocations.
Asia-Pacific Plant Protein Ingredients Industry Overview
The Asia-Pacific Plant Protein Ingredients Market is fragmented, with the top five companies occupying 16.24%. The major players in this market are Archer Daniels Midland Company, Fuji Oil Group, International Flavors & Fragrances, Inc., Kerry Group PLC and Sudzucker AG (sorted alphabetically).
Additional Benefits:
- The market estimate (ME) sheet in Excel format
- 3 months of analyst support
TABLE OF CONTENTS
1 EXECUTIVE SUMMARY & KEY FINDINGS
2 INTRODUCTION
- 2.1 Study Assumptions & Market Definition
- 2.2 Scope of the Study
- 2.3 Research Methodology
3 KEY INDUSTRY TRENDS
- 3.1 End User Market Volume
- 3.1.1 Baby Food and Infant Formula
- 3.1.2 Bakery
- 3.1.3 Beverages
- 3.1.4 Breakfast Cereals
- 3.1.5 Condiments/Sauces
- 3.1.6 Confectionery
- 3.1.7 Dairy and Dairy Alternative Products
- 3.1.8 Elderly Nutrition and Medical Nutrition
- 3.1.9 Meat/Poultry/Seafood and Meat Alternative Products
- 3.1.10 RTE/RTC Food Products
- 3.1.11 Snacks
- 3.1.12 Sport/Performance Nutrition
- 3.1.13 Animal Feed
- 3.1.14 Personal Care and Cosmetics
- 3.2 Protein Consumption Trends
- 3.2.1 Plant
- 3.3 Production Trends
- 3.3.1 Plant
- 3.4 Regulatory Framework
- 3.4.1 Australia
- 3.4.2 China
- 3.4.3 India
- 3.4.4 Japan
- 3.5 Value Chain & Distribution Channel Analysis
4 MARKET SEGMENTATION (includes market size in Value in USD and Volume, Forecasts up to 2030 and analysis of growth prospects)
- 4.1 Protein Type
- 4.1.1 Hemp Protein
- 4.1.2 Pea Protein
- 4.1.3 Potato Protein
- 4.1.4 Rice Protein
- 4.1.5 Soy Protein
- 4.1.6 Wheat Protein
- 4.1.7 Other Plant Protein
- 4.2 End User
- 4.2.1 Animal Feed
- 4.2.2 Food and Beverages
- 4.2.2.1 By Sub End User
- 4.2.2.1.1 Bakery
- 4.2.2.1.2 Beverages
- 4.2.2.1.3 Breakfast Cereals
- 4.2.2.1.4 Condiments/Sauces
- 4.2.2.1.5 Confectionery
- 4.2.2.1.6 Dairy and Dairy Alternative Products
- 4.2.2.1.7 Meat/Poultry/Seafood and Meat Alternative Products
- 4.2.2.1.8 RTE/RTC Food Products
- 4.2.2.1.9 Snacks
- 4.2.3 Personal Care and Cosmetics
- 4.2.4 Supplements
- 4.2.4.1 By Sub End User
- 4.2.4.1.1 Baby Food and Infant Formula
- 4.2.4.1.2 Elderly Nutrition and Medical Nutrition
- 4.2.4.1.3 Sport/Performance Nutrition
- 4.3 Country
- 4.3.1 Australia
- 4.3.2 China
- 4.3.3 India
- 4.3.4 Indonesia
- 4.3.5 Japan
- 4.3.6 Malaysia
- 4.3.7 New Zealand
- 4.3.8 South Korea
- 4.3.9 Thailand
- 4.3.10 Vietnam
- 4.3.11 Rest of Asia-Pacific
5 COMPETITIVE LANDSCAPE
- 5.1 Key Strategic Moves
- 5.2 Market Share Analysis
- 5.3 Company Landscape
- 5.4 Company Profiles (includes Global Level Overview, Market Level Overview, Core Business Segments, Financials, Headcount, Key Information, Market Rank, Market Share, Products and Services, and Analysis of Recent Developments).
- 5.4.1 Archer Daniels Midland Company
- 5.4.2 Bunge Limited
- 5.4.3 CHS Inc.
- 5.4.4 Fuji Oil Group
- 5.4.5 International Flavors & Fragrances, Inc.
- 5.4.6 Kerry Group PLC
- 5.4.7 Nagata Group
- 5.4.8 Nippn Corporation
- 5.4.9 Shandong Jianyuan Bioengineering Co. Ltd
- 5.4.10 Sudzucker AG
- 5.4.11 Tereos SCA
- 5.4.12 Wilmar International Ltd
6 KEY STRATEGIC QUESTIONS FOR PROTEIN INGREDIENTS INDUSTRY CEOS
7 APPENDIX
- 7.1 Global Overview
- 7.1.1 Overview
- 7.1.2 Porter's Five Forces Framework
- 7.1.3 Global Value Chain Analysis
- 7.1.4 Market Dynamics (DROs)
- 7.2 Sources & References
- 7.3 List of Tables & Figures
- 7.4 Primary Insights
- 7.5 Data Pack
- 7.6 Glossary of Terms
- 発行日
- 発行
- Mordor Intelligence
- ページ情報
- 英文 268 Pages
- 納期
- 2~3営業日

