
北米の植物性タンパク質原料:市場シェア分析、産業動向と統計、成長予測(2025年~2030年)
North America Plant Protein Ingredients - Market Share Analysis, Industry Trends & Statistics, Growth Forecasts (2025 - 2030)
- 発行日
- ページ情報
- 英文 255 Pages
- 納期
- 2~3営業日
- 商品コード
- 1690977
- カスタマイズ可能 お客様のご希望に応じて、既存データの加工や未掲載情報(例:国別セグメント)の追加などの対応が可能です。詳細はお問い合わせください。
- 適宜更新あり 本レポートは最新情報反映のため適宜更新し、内容構成変更を行う場合があります。ご検討の際はお問い合わせください。
- 翻訳ツール提供対象 PDF対応AI翻訳ツールの無料貸し出しサービスのご利用が可能です
概要
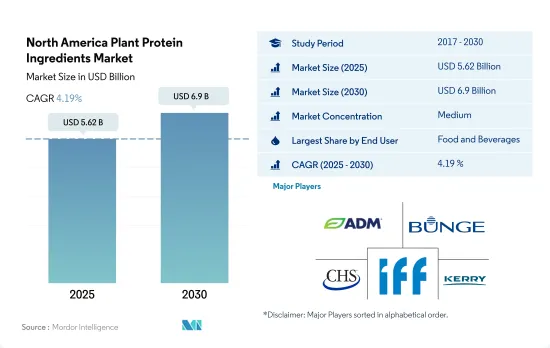
北米の植物性タンパク質原料市場規模は2025年に56億2,000万米ドルと推定され、2030年には69億米ドルに達すると予測され、予測期間中(2025~2030年)のCAGRは4.19%で成長すると予測されます。
- 2022年には、飲食品セグメントが最も高い需要を目の当たりにし、次いで動物飼料が続きます。F&Bセグメントは調査期間中にCAGR 4.63%を記録しました。動物飼料と化粧品における植物タンパク質の利用率の上昇が、近年の成長を牽引しています。乳製品や食肉代替品における植物タンパク質の需要の増加は、予測期間中このセグメントを牽引すると予想されます。
- タンパク質の機能性に対する需要の増加、タンパク質が豊富な食事に対する認識、新しい技術開発が主に植物タンパク質の市場需要を牽引しています。すべての飲食品セグメントの中で、代替肉は筋肉肉の食感を模倣するタンパク質の能力により、タンパク質市場の需要をリードしています。また、肉代替製品のタンパク質強化にも使用できます。2022年には、飲食品セグメントで消費される植物性タンパク質全体の41%を代替肉が占めています。しかし、サプリメントセグメントは、予測期間中の数量CAGRが6.12%で、植物タンパク質の最も高い需要を記録すると予想されます。この需要は、ライフスタイルの変化による日常的な栄養要求量の増加、特にスポーツ/パフォーマンス栄養カテゴリーにおいて高いです。
- 肉/鶏肉/魚と代替肉セグメントは、2022年に同地域で消費された総タンパク質の19.62%を占めました。小麦タンパク質や大豆タンパク質を原料とするテクスチャード・ベジタブル・プロテインは、肉製品の官能特性に酷似しているため、植物ベースの肉メーカーにとって主要な原料として浮上しています。国内で肉製品の摂取による悪影響に対する意識が高まるにつれ、メーカーは肉製品に代わる新たな方法を模索しており、TVPはその有力な選択肢の一つとなっています。
主に米国が牽引するサステイナブルタンパク源への需要の高まりが市場セグメントに影響
- 米国は調査期間中、この地域で最大の植物性タンパク質消費国であり続けた。そのシェアは、菜食主義の台頭、環境問題、サステイナブルタンパク質源に対する需要の高まりの中で、植物ベースの食品に対する需要が高まっていることに大きく影響されています。2022年、米国における植物性食品の小売売上高は前年比27%増加しました。従って、小売エンドにおける需要の急増は、植物性タンパク質の数量をさらに押し上げると予想されます。米国の消費者の約61%は、動物性タンパク質よりも植物を優先的なタンパク質源と考えており、これが市場成長を押し上げると予想されます。
- 一方、カナダとメキシコの2022年の数量シェアはわずかで、主にF&Bと動物飼料セグメントが牽引しています。カナダ市場は、同セグメントで実施される調査研究の増加に伴い成長しており、消費者の関心を高めています。市場需要の拡大に伴い、投資も増加しています。2021年、プロテインインダストリーズ・カナダはダイエーやメリット・ファンクショナル・フーズといったブランドの植物性タンパク質プロジェクトに970万米ドルを投資しました。
- 成長という点では、メキシコが地域市場で最も急成長している国になると予想され、予測期間中の予想CAGRは金額ベースで6.67%です。同国における菜食主義者の増加による需要が、主にメキシコの植物性タンパク質市場を牽引しています。2021年現在、メキシコ人の20%がベジタリアンまたはヴィーガンであると自認しています。メキシコ料理は伝統的に植物性食品をベースとしており、この植物性食品への回帰はシェフやレストランにその伝統を創造的に発表する機会を提供しています。
北米の植物性タンパク質原料市場の動向
植物性タンパク質消費の成長が原料産業の主要企業に機会を与える
- 2017~2022年にかけて、同地域では投資とイノベーションに牽引され、一人当たりの植物性タンパク質消費量が2.42%増加しました。この急増は主に、動物愛護への懸念が主要動機となってヴィーガンまたはベジタリアン食にシフトする消費者の増加によって促進されました。2020年には、さらに約960万人の米国人が植物ベースの食生活を採用し、米国人口の3%近くを占めることになります。COVID-19の大流行後、植物性タンパク質の消費量が急増したが、これは動物性タンパク質のウイルス汚染に対する懸念や、動物性と植物性の両方を含むタンパク質配合の一般的な増加も一因となっています。
- ほとんどのアメリカ人は肉の摂取量を減らしてはいるが、厳格な菜食主義やベジタリアンというよりは、フレキシタリアン的な食事に傾いています。植物性タンパク質は、スポーツ栄養学や肉の代替品として重要な用途を見出しています。特に大豆と乳清タンパク質は、飲食品、サプリメント、スポーツ栄養に広く使われています。2021年までに、米国の消費者の36%が大豆タンパク質をよく知り、摂取したことがあり、ホエイ・プロテインを試したことがある人の割合は31%とやや低いです。
- カナダは第2位のフレキシタリアン人口を誇り、消費者の間でフレキシタリアニズムと菜食主義への大きなシフトが見られます。この動向は、メーカーが植物性タンパク質市場をさらに革新する絶好の機会を提供しています。2021年、カナダ政府は、持続可能で高品質な植物性タンパク質に対する消費者の欲求の高まりに合わせて、同国の豆類・特別栽培作物農業従事者を強化するために430万米ドル以上を拠出することを約束しました。
大豆、小麦、米の生産は、植物性タンパク質原料メーカーの原料として大きく貢献しています。
- グラフは、ドライエンドウ、米、小麦、大豆などの原料の総生産量を示しています。米国は北米における植物性タンパク質原料の主要生産国です。同国は世界の大豆総生産量の約3分の1を生産しており、ブラジルとアルゼンチンが僅差でこれに続きます。2021年には1億1,988万MTの大豆を生産し、世界の大豆生産量の31%を占めました。大豆はカナダで3番目に大きな畑作物です。大豆は、ケベック州やマニトバ州、マリタイムズ州、サスカチュワン州南東部、アルバータ州南部などの都市で重要な換金作物となっています。現在、カナダは200品種の登録大豆を生産しています。これらの登録品種のうち、80%が除草剤耐性の大豆です。
- 米国はこの地域の小麦生産のリーダーでもあり、次いでカナダが続き、両国はこの地域の小麦生産のほぼ100%を占めています。小麦は米国の畑作物の中で、作付面積、生産量、農業従事者総収入において、トウモロコシ、大豆に次いで第3位です。2023~2024年の米国農業従事者による冬小麦、デュラム小麦、その他春小麦の生産量は18億ブッシェルで、収穫面積は3,730万エーカーです。冬小麦の生産量は米国全体の70%近くを占めます。同様に、2023年にはカナダの農業従事者は約3,200万トンの小麦を栽培しました。
- アーカンソー・グランドプレーリー、ミシシッピ・デルタ、ガルフ・コースト、カリフォルニアのサクラメント・バレーは、米国産米のほぼ全量を生産する4つの地域です。各産地は通常、特定タイプの米に特化しており、米国では粒の長さ、すなわち長粒種、中粒種、短粒種で呼ばれています。一般的に、長粒種は米国産米の約75%を占めています。
北米植物性タンパク質原料産業概要
北米の植物性タンパク質原料市場は適度に統合されており、上位5社で50.21%を占めています。この市場の主要企業は、 Archer Daniels Midland Company、Bunge Limited、CHS Inc.、International Flavors & Fragrances、Inc.、Kerry Group PLCなどです。
その他の特典
- エクセル形式の市場予測(ME)シート
- 3ヶ月のアナリストサポート
目次
第1章 エグゼクティブサマリーと主要調査結果
第2章 イントロダクション
- 調査の前提条件と市場定義
- 調査範囲
- 調査手法
第3章 主要産業動向
- エンドユーザー市場規模
- ベビーフードと乳児用調製粉乳
- ベーカリー
- 飲料
- 朝食用シリアル
- 調味料/ソース
- 菓子類
- 乳製品と乳製品代替製品
- 高齢者栄養・医療栄養
- 肉・鶏肉・魚介類と肉代替製品
- RTE/RTC食品
- スナック
- スポーツ/パフォーマンス栄養
- 動物飼料
- パーソナルケアと化粧品
- タンパク質消費動向
- 植物
- 生産動向
- 植物
- 規制の枠組み
- カナダ
- 米国
- バリューチェーンと流通チャネル分析
第4章 市場セグメンテーション
- プロテインタイプ
- ヘンプ・プロテイン
- エンドウ豆プロテイン
- ポテト・プロテイン
- 米プロテイン
- 大豆プロテイン
- 小麦プロテイン
- その他の植物性プロテイン
- エンドユーザー
- 動物飼料
- 飲食品
- サブエンドユーザー別
- ベーカリー
- 飲料
- 朝食用シリアル
- 調味料/ソース
- 菓子類
- 乳製品・乳製品代替品
- 肉・鶏肉・魚介類と肉代替製品
- RTE/RTC食品
- スナック
- パーソナルケアと化粧品
- サプリメント
- サブエンドユーザー別
- ベビーフードと乳児用調製粉乳
- 高齢者栄養と医療栄養
- スポーツ/パフォーマンス栄養
- 国別
- カナダ
- メキシコ
- 米国
- その他の北米地域
第5章 競争情勢
- 主要な戦略動向
- 市場シェア分析
- 企業情勢
- 企業プロファイル
- Archer Daniels Midland Company
- Bunge Limited
- Cargill Incorporated
- CHS Inc.
- Farbest-Tallman Foods Corporation
- Glanbia PLC
- Ingredion Incorporated
- International Flavors & Fragrances, Inc.
- Kerry Group PLC
- MGP
- Roquette Freres
- Sudzucker Group
- The Scoular Company
第6章 CEOへの主要戦略的質問
第7章 付録
- 世界概要
- 概要
- ファイブフォース分析フレームワーク
- 世界のバリューチェーン分析
- 市場力学(DROs)
- 情報源と参考文献
- 図表一覧
- 主要な洞察
- データパック
- 用語集
目次
The North America Plant Protein Ingredients Market size is estimated at 5.62 billion USD in 2025, and is expected to reach 6.9 billion USD by 2030, growing at a CAGR of 4.19% during the forecast period (2025-2030).
- In 2022, the food and beverage segment witnessed the highest demand, followed by animal feed. The F&B segment recorded a CAGR of 4.63% during the study period. The rising utilization of plant proteins in animal feed and cosmetics has driven growth in recent years. The increase in demand for plant proteins in dairy and meat alternatives is expected to drive the segment during the forecast period.
- The increasing demand for protein functionalities, awareness about protein-rich diets, and new technological developments primarily drive the demand for plant proteins in the market. Among all food and beverage segments, meat alternatives lead the demand in the protein market, owing to the proteins' ability to mimic muscle meat texture. They can also be used for protein fortification in meat-alternative products. In 2022, meat alternatives claimed a 41% share of the overall plant proteins consumed in the food and beverage segment. However, the supplement segment is expected to register the highest demand for plant proteins, with a volume CAGR of 6.12% during the forecast period. The demand is high due to increased daily nutritional requirements as a result of changing lifestyles, especially in the sport/performance nutrition category.
- The meat/poultry/fish and meat alternatives segment represented 19.62% of the total protein consumed in the region in 2022. Textured vegetable protein, made from wheat protein or soy protein, has emerged as a major ingredient for plant-based meat manufacturers since it can closely resemble the sensory properties of meat products. As awareness regarding the adverse effects of consuming meat products increases in the country, manufacturers are looking for new ways to replace meat in their products, and TVP is one of the prime choices.
Growing demand for sustainable protein sources, primarily driven by the United States, impacts the market segment
- The United States remained the largest plant protein-consuming country in the region during the study period. Its share was majorly influenced by the growing demand for plant-based food products amid rising veganism, environmental concerns, and the demand for sustainable protein sources. In 2022, the retail sales of plant-based food products in the United States increased by 27% compared to the previous year. Thus, the surging demand at the retail end is further expected to boost volume sales of plant proteins. Around 61% of consumers in the United States consider plants to be a preferred protein source over animal-based proteins, which is expected to boost market growth.
- On the other hand, Canada and Mexico held a minor volume share in 2022, majorly driven by the F&B and animal feed segments. The Canadian market is growing in line with the increasing research studies conducted in the segments, boosting consumer interest. In line with the growing market demand, investments are also increasing. In 2021, Protein Industries Canada invested USD 9.7 million in plant protein projects for brands like Daiya and Merit Functional Foods.
- In terms of growth, Mexico is expected to be the fastest-growing country in the regional market, with a projected CAGR of 6.67% by value during the forecast period, owing to the growing acceptance of plant proteins among Mexicans, particularly as meat alternatives. The demand from the growing vegan population in the country mainly drives the Mexican plant proteins market. As of 2021, 20% of Mexicans identified themselves as vegetarians or vegans. Mexican food has been traditionally plant-based, and this return to plant-based food has provided chefs and restaurants with an opportunity to showcase their heritage creatively.
North America Plant Protein Ingredients Market Trends
Plant protein consumption growth fuels opportunities for key players in the ingredients industry
- From 2017 to 2022, the region saw a 2.42% increase in per capita plant protein consumption, driven by investments and innovations. This surge was primarily fueled by a growing number of consumers shifting toward vegan or vegetarian diets, largely motivated by concerns for animal welfare. Notably, in 2020, approximately 9.6 million more Americans adopted plant-based diets, constituting nearly 3% of the US population. After the COVID-19 pandemic, plant protein consumption surged, partly due to concerns over viral contamination in animal-sourced proteins and a general increase in protein blends, including both animal and plant sources.
- While most Americans are reducing their meat intake, they are not eliminating it, leaning more toward a flexitarian diet than strict veganism or vegetarianism. Plant proteins find significant usage in sports nutrition and as meat alternatives. Soy and whey proteins, in particular, are prevalent in food and beverage, supplements, and sports nutrition. By 2021, 36% of US consumers were familiar with and had consumed soy protein, with a slightly lower share of 31% having tried whey protein.
- Canada boasts the second-largest flexitarian population, showcasing a significant shift toward flexitarianism and veganism among consumers. This trend presents a ripe opportunity for manufacturers to further innovate in the plant protein market. In 2021, the Canadian government pledged over USD 4.3 million to bolster the country's pulse and special crop farmers, aligning with the rising consumer appetite for sustainable, high-quality plant-based proteins.
Soy, wheat, and rice production contribute majorly as raw materials for plant protein ingredient manufacturers
- The graph depicts the total production of raw materials such as dry peas, rice, wheat, and soya beans. The United States is the key producer of some plant protein raw materials in North America. The country produces about one-third of the total soybeans in the world, followed closely by Brazil and Argentina. In 2021, the country produced 119.88 million MT of soybeans, accounting for 31% shares of the global soybean production. Soybeans are the third-largest field crop in Canada. Soybeans have become an important cash crop in cities like Quebec and Manitoba, Maritimes, southeast Saskatchewan, and southern Alberta. Presently, Canada is the producer of 200 registered soybean varieties. Among those registered varieties, 80% of soybeans are herbicide-tolerant.
- The United States is also the wheat-producing leader in the region, followed by Canada, with both countries accounting for almost 100% of the regional wheat production. Wheat ranks third among US field crops, behind corn and soybeans, in planted acreage, production, and gross farm receipts. In the marketing year 2023-2024, US farmers produced 1.8 billion bushels of winter, durum, and other spring wheat from a harvested area of 37.3 million acres. Winter wheat production represents nearly 70% of the total US production. Similarly, in 2023, Canadian farmers grew almost 32 million tons of wheat.
- Arkansas Grand Prairie, Mississippi Delta, Gulf Coast, and Sacramento Valley of California are four regions producing almost the entire US rice crop. Each region typically specializes in a specific type of rice, referred to in the United States by the length of grain, i.e., long, medium, and short. In general, long-grain production accounts for approximately 75% of US rice production.
North America Plant Protein Ingredients Industry Overview
The North America Plant Protein Ingredients Market is moderately consolidated, with the top five companies occupying 50.21%. The major players in this market are Archer Daniels Midland Company, Bunge Limited, CHS Inc., International Flavors & Fragrances, Inc. and Kerry Group PLC (sorted alphabetically).
Additional Benefits:
- The market estimate (ME) sheet in Excel format
- 3 months of analyst support
TABLE OF CONTENTS
1 EXECUTIVE SUMMARY & KEY FINDINGS
2 INTRODUCTION
- 2.1 Study Assumptions & Market Definition
- 2.2 Scope of the Study
- 2.3 Research Methodology
3 KEY INDUSTRY TRENDS
- 3.1 End User Market Volume
- 3.1.1 Baby Food and Infant Formula
- 3.1.2 Bakery
- 3.1.3 Beverages
- 3.1.4 Breakfast Cereals
- 3.1.5 Condiments/Sauces
- 3.1.6 Confectionery
- 3.1.7 Dairy and Dairy Alternative Products
- 3.1.8 Elderly Nutrition and Medical Nutrition
- 3.1.9 Meat/Poultry/Seafood and Meat Alternative Products
- 3.1.10 RTE/RTC Food Products
- 3.1.11 Snacks
- 3.1.12 Sport/Performance Nutrition
- 3.1.13 Animal Feed
- 3.1.14 Personal Care and Cosmetics
- 3.2 Protein Consumption Trends
- 3.2.1 Plant
- 3.3 Production Trends
- 3.3.1 Plant
- 3.4 Regulatory Framework
- 3.4.1 Canada
- 3.4.2 United States
- 3.5 Value Chain & Distribution Channel Analysis
4 MARKET SEGMENTATION (includes market size in Value in USD and Volume, Forecasts up to 2030 and analysis of growth prospects)
- 4.1 Protein Type
- 4.1.1 Hemp Protein
- 4.1.2 Pea Protein
- 4.1.3 Potato Protein
- 4.1.4 Rice Protein
- 4.1.5 Soy Protein
- 4.1.6 Wheat Protein
- 4.1.7 Other Plant Protein
- 4.2 End User
- 4.2.1 Animal Feed
- 4.2.2 Food and Beverages
- 4.2.2.1 By Sub End User
- 4.2.2.1.1 Bakery
- 4.2.2.1.2 Beverages
- 4.2.2.1.3 Breakfast Cereals
- 4.2.2.1.4 Condiments/Sauces
- 4.2.2.1.5 Confectionery
- 4.2.2.1.6 Dairy and Dairy Alternative Products
- 4.2.2.1.7 Meat/Poultry/Seafood and Meat Alternative Products
- 4.2.2.1.8 RTE/RTC Food Products
- 4.2.2.1.9 Snacks
- 4.2.3 Personal Care and Cosmetics
- 4.2.4 Supplements
- 4.2.4.1 By Sub End User
- 4.2.4.1.1 Baby Food and Infant Formula
- 4.2.4.1.2 Elderly Nutrition and Medical Nutrition
- 4.2.4.1.3 Sport/Performance Nutrition
- 4.3 Country
- 4.3.1 Canada
- 4.3.2 Mexico
- 4.3.3 United States
- 4.3.4 Rest of North America
5 COMPETITIVE LANDSCAPE
- 5.1 Key Strategic Moves
- 5.2 Market Share Analysis
- 5.3 Company Landscape
- 5.4 Company Profiles (includes Global Level Overview, Market Level Overview, Core Business Segments, Financials, Headcount, Key Information, Market Rank, Market Share, Products and Services, and Analysis of Recent Developments).
- 5.4.1 Archer Daniels Midland Company
- 5.4.2 Bunge Limited
- 5.4.3 Cargill Incorporated
- 5.4.4 CHS Inc.
- 5.4.5 Farbest-Tallman Foods Corporation
- 5.4.6 Glanbia PLC
- 5.4.7 Ingredion Incorporated
- 5.4.8 International Flavors & Fragrances, Inc.
- 5.4.9 Kerry Group PLC
- 5.4.10 MGP
- 5.4.11 Roquette Freres
- 5.4.12 Sudzucker Group
- 5.4.13 The Scoular Company
6 KEY STRATEGIC QUESTIONS FOR PROTEIN INGREDIENTS INDUSTRY CEOS
7 APPENDIX
- 7.1 Global Overview
- 7.1.1 Overview
- 7.1.2 Porter's Five Forces Framework
- 7.1.3 Global Value Chain Analysis
- 7.1.4 Market Dynamics (DROs)
- 7.2 Sources & References
- 7.3 List of Tables & Figures
- 7.4 Primary Insights
- 7.5 Data Pack
- 7.6 Glossary of Terms
- 発行日
- 発行
- Mordor Intelligence
- ページ情報
- 英文 255 Pages
- 納期
- 2~3営業日

