
欧州の植物性タンパク質成分:市場シェア分析、産業動向・統計、成長予測(2025年~2030年)
Europe Plant Protein Ingredients - Market Share Analysis, Industry Trends & Statistics, Growth Forecasts (2025 - 2030)
- 発行日
- ページ情報
- 英文 262 Pages
- 納期
- 2~3営業日
- 商品コード
- 1690981
- カスタマイズ可能 お客様のご希望に応じて、既存データの加工や未掲載情報(例:国別セグメント)の追加などの対応が可能です。詳細はお問い合わせください。
- 適宜更新あり 本レポートは最新情報反映のため適宜更新し、内容構成変更を行う場合があります。ご検討の際はお問い合わせください。
- 翻訳ツール提供対象 PDF対応AI翻訳ツールの無料貸し出しサービスのご利用が可能です
概要
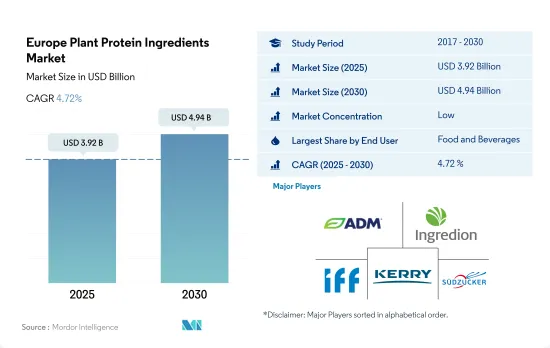
欧州の植物性タンパク質原料市場規模は2025年に39億2,000万米ドルと推定され、2030年には49億4,000万米ドルに達し、予測期間(2025~2030年)のCAGRは4.72%で成長すると予測されます。
食肉摂取に伴う健康リスクに対する意識の高まりと、植物性タンパク質代替品の利用可能性の拡大が、欧州の飲食品産業を牽引しています。
- 欧州の植物性タンパク質のエンドユーザー市場をリードしているのは飲食品セグメントです。飲食品セグメントは、肉/鶏肉/水産物と肉代替製品のサブセグメントが牽引しており、予測期間中の数量ベースのCAGRは3.96%を記録する見込みです。売上の伸びは、食肉摂取に伴う健康リスクに対する意識の高まりと、欧州全域のほとんどの流通センターで植物性タンパク質代替品の入手可能性が拡大していることに関連しています。
- 植物性タンパク質の需要は主に、その機能性に関する知識の高まりと、植物性タンパク質を豊富に含む食事に対する意識の高まりによって牽引されています。2022年には、肉/鶏肉/水産物と肉代替製品サブセグメントが市場の主要量を占め、乳製品と乳製品代替製品サブセグメントがそれに続きました。肉と肉代替品サブセグメントは予測期間中、数量ベースでCAGR 3.87%を記録すると予測されます。
- サプリメントセグメントは、スポーツ・パフォーマンス栄養サブセグメントに牽引され、予測期間中に金額ベースで最速のCAGR 7.12%を記録すると予測されます。ボディービルや筋肉形成の人気の高まりと、植物性タンパク質の健康上の利点に対する意識の高まりが、プロテイン産業を後押ししています。また、ホエイプロテインのフィットネス効果は、植物性プロテインの高用量(40g/日以上)を補うことで再現できると主張されています。タンパク質の摂取を植物性ソースにシフトしたい人々にとって、植物性タンパク質を可能な限り受け入れやすくするために、主要企業が製品の官能的プロファイルに基づいて革新を進めているため、こうした食事パターンをより簡単に飾ることができるようになりました。
高所得層に支えられた植物性タンパク質への需要が、ロシアにおける植物性タンパク質原料市場の拡大をもたらしました。
- ロシアはこの地域で最大の植物性タンパク質消費国であり、その市場は主にF&B志向です。2021年には、ロシア人の約10%がすでに植物性代替食品を食べており、54%が植物性食品を食事に取り入れたいと考えていました。植物性タンパク質に対する需要は、主に所得の高いロシア人からでした。2021年のロシアの一人当たり世帯年収は6,523米ドルでした。環境や倫理的な懸念は、ロシアの消費者の間では依然として最も不人気な話題です。しかし、「植物由来」のラベルに対する好意的な認識が大幅に高まったことが、市場の成長に大きく寄与しています。
- オランダとベルギーは、2022年の数量・金額シェアはわずかでした。オランダとベルギーは、主に飲食品産業と飼料産業から売上を獲得しました。2020年には、オランダには植物性タンパク質に特化した60以上の企業や研究機関がありました。植物性タンパク質は食料品店での人気が高まり、国中のファーストフード店のメニューに登場するようになりました。2023年には、大豆タンパク質が同国の消費量の82.41%を占め、圧倒的なシェアを占めています。
- フランスは最も急成長している国のひとつで、予測期間中のCAGRは5.47%を記録すると予想されています。ADM、Cargill、Roquetteのような多くの企業は、より高い利益率を達成するためにフランスで植物性タンパク質に投資し、商品価格や貿易戦争の影響を緩和するのに役立ちました。動物飼料に使用される植物性タンパク質のほとんどは、米国やブラジルからの大豆を含む輸入品です。2021年、フランスは米国から58億米ドルの大豆を輸入しました。しかし、同国は飼料と人間の栄養のために国内生産を増加させ、農産物主権と持続可能性を高めることを目指しています。
欧州の植物性タンパク質原料市場の動向
植物性タンパク質消費の成長は市場の主要企業に機会を与える
- グラフは欧州各国の一人当たりの植物性タンパク質消費量を示しています。菜食主義への消費者シフトが市場を牽引信頼性の高い植物性タンパク質製品が提供する機能的効率性とコスト競合は、多種多様な加工食品への利用を増加させています。大豆由来の植物性タンパク質は、あらゆる年齢層にとって健康的であり、体の健康維持に役立つと考えられています。代替植物性タンパク質は、飲食品産業で広く利用されています。
- この地域には、食生活を植物性タンパク質源に切り替えようとする消費者の間で未開発の可能性があります。例えば、4年以内に菜食主義者の数は2016年の130万人から2020年には260万人に倍増します。しかし、市場は技術革新の欠如や公共施策の制限といった課題に直面しています。遺伝子組み換え作物の存在の可能性、製品構成に使用される原料の原産地に対する疑念、作物への除草剤の使用の可能性など、イタリアの消費者の移行を妨げている側面がまだいくつかあります。
- 植物性タンパク質は、食品の栄養価や機能性を高め、おいしさを記載しています。同市場では、地域全体で植物性食品の消費が約45~50%増加しています。例えば、Bolthouse Farmsは、コールドプレスジュースやヴィーガンプロテインシェイクを含む「1915 Organic」ブランドラインで飲料製品レンジを拡大しました。また、プロテインメーカーは、この地域における大豆プロテインなどの植物性タンパク源の消費向上に影響を与える戦略的プログラムを開始しようとしています。例えば、Donau Sojaは2023年に欧州のプロテイン戦略を開発し、この地域における大豆の入手可能性に影響を与えました。
欧州は大豆、小麦、エンドウ豆の増産に注力しています。
- グラフは、ドライエンドウ、米、大豆、小麦の生産量を示しています。ドイツのような国の穀物総生産量は、2018~2019年の3,790万トンから増加し、2019~2020年の間に4,570万トンに達しました。2019~2020年の小麦生産量は2,420万トンに達し、2,030万トンから増加しました。しかし、小麦とドライエンドウの主要生産国は英国です。2019年、同国の小麦生産量は1,620万トンに達し、定期的な降雨と温暖な気候により、前年比19.70%増、すなわち数量で270万トン増加しました。
- イタリアは、主に小麦、次いで米、大豆、エンドウ豆など、明確な植物性タンパク質商品の主要生産国です。イタリアはEU最大の大豆生産国であり、最大のコメ生産国でもあります。同国は主にジャポニカ米を生産しています。2019年のジャポニカ種の生産量は110万トン近くに達し、インディカ種の生産量は40万トンに満たなかりました。これは総精米量が約90万トンであることを意味します。主要品種は、カルナローリ、アルボリオ、ローマ、S.アンドレア、バルド、ヴィアローネ・ナノ、バリラなどです。
- 小麦の輸出量は520万トン、輸入量は370万トンです。フランスで栽培されている植物性タンパク質は、小麦、エンドウ豆、米、大豆などです。フランスは2019年に4,060万4,960トンの小麦を生産しました。小麦の生産量の変動は、天候不順や害虫の侵入によって引き起こされます。一方、2020年、フランスの小麦生産は、2019年秋の大雨による作付けの遅れ、アブラムシの蔓延をもたらした暖冬、水分ストレスを引き起こした乾燥した春によって妨げられました。
欧州の植物性タンパク質原料産業概要
欧州の植物性タンパク質原料市場は細分化されており、上位5社で28.94%を占めています。この市場の主要企業は、 Archer Daniels Midland Company、Ingredion Incorporated、International Flavors & Fragrances Inc.、Kerry Group PLC、Sudzucker AGなどです。
その他の特典
- エクセル形式の市場予測(ME)シート
- 3ヶ月のアナリストサポート
目次
第1章 エグゼクティブサマリーと主要調査結果
第2章 イントロダクション
- 調査の前提条件と市場定義
- 調査範囲
- 調査手法
第3章 主要産業動向
- エンドユーザー市場規模
- ベビーフードと乳児用調製粉乳
- ベーカリー
- 飲料
- 朝食用シリアル
- 調味料/ソース
- 菓子類
- 乳製品と乳製品代替製品
- 高齢者栄養・医療栄養
- 肉・鶏肉・魚介類と肉代替製品
- RTE/RTC食品
- スナック
- スポーツ/パフォーマンス栄養
- 動物飼料
- パーソナルケアと化粧品
- タンパク質消費動向
- 植物
- 生産動向
- 植物
- 規制の枠組み
- フランス
- ドイツ
- イタリア
- 英国
- バリューチェーンと流通チャネル分析
第4章 市場セグメンテーション
- プロテインタイプ
- ヘンプ・プロテイン
- エンドウ豆プロテイン
- ポテト・プロテイン
- 米プロテイン
- 大豆プロテイン
- 小麦プロテイン
- その他の植物性プロテイン
- エンドユーザー
- 動物飼料
- 飲食品
- サブエンドユーザー別
- ベーカリー
- 飲料
- 朝食用シリアル
- 調味料/ソース
- 菓子類
- 乳製品・乳製品代替品
- 肉・鶏肉・魚介類と肉代替製品
- RTE/RTC食品
- スナック
- パーソナルケアと化粧品
- サプリメント
- サブエンドユーザー別
- ベビーフードと乳児用調製粉乳
- 高齢者栄養と医療栄養
- スポーツ/パフォーマンス栄養
- 国別
- ベルギー
- フランス
- ドイツ
- イタリア
- オランダ
- ロシア
- スペイン
- トルコ
- 英国
- その他の欧州
第5章 競合情勢
- 主要な戦略動向
- 市場シェア分析
- 企業情勢
- 企業プロファイル
- A. Costantino & C. SpA
- Archer Daniels Midland Company
- Cargill Incorporated
- Emsland Group
- Ingredion Incorporated
- International Flavors & Fragrances Inc.
- Kerry Group PLC
- Lantmannen
- Roquette Frere
- Sudzucker AG
第6章 CEOへの主要戦略的質問
第7章 付録
- 世界概要
- 概要
- ファイブフォース分析フレームワーク
- 世界のバリューチェーン分析
- 市場力学(DROs)
- 情報源と参考文献
- 図表一覧
- 主要な洞察
- データパック
- 用語集
目次
The Europe Plant Protein Ingredients Market size is estimated at 3.92 billion USD in 2025, and is expected to reach 4.94 billion USD by 2030, growing at a CAGR of 4.72% during the forecast period (2025-2030).
Rising awareness of health risks associated with consuming meat and the expanding availability of plant-based protein substitutes are driving the food and beverage industry in Europe
- The food and beverage segment is leading the end-user market for plant protein in Europe. The food and beverage segment is driven by the meat/poultry/seafood and meat alternative products sub-segment, which is expected to record a CAGR of 3.96% in terms of volume during the forecast period. The growth in sales is linked to the rising awareness of health risks associated with consuming meat and the expanding availability of plant-based protein substitutes in most distribution centers across Europe.
- The demand for plant protein is primarily driven by the rising knowledge about its functionalities and growing awareness about diets that are rich in plant protein. In 2022, the meat/poultry/seafood and meat alternative products sub-segment occupied the major volume of the market, followed by the dairy and dairy alternative products sub-segment. The meat and meat substitutes sub-segment is projected to register a CAGR of 3.87% in terms of volume during the forecast period.
- The supplements segment, led by the sports and performance nutrition sub-segment, is projected to record the fastest CAGR of 7.12% in terms of value during the forecast period. The growing popularity of body-building and muscle-shaping and the rising awareness of the health advantages of plant protein have boosted the protein industry. It has also been claimed that the fitness benefits of whey protein can be replicated by supplementing it with higher dosages of plant protein (40 g/day or more). For people who want to shift their protein consumption to plant-based sources, it is now simpler to adorn these dietary patterns as key players are innovating on the basis of the sensory profiles of their products to make plant proteins as acceptable as possible.
The demand for plant-based proteins, supported by high-income population, has resulted in an increased market of plant protein ingredients in Russia
- Russia is the largest plant protein-consuming country in the region, as its market is majorly F&B-oriented. In 2021, around 10% of Russians were already eating plant-based alternatives, and 54% were willing to include plant-based food in their diet. The demand for plant-based protein was mainly from Russians with high incomes. Russia's annual household income per capita was USD 6,523 in 2021. Environmental and ethical concerns are still the most unpopular topics among Russian consumers. However, the difference in the significantly increased positive perception of the "plant-based" label has largely been attributed to the market's growth.
- The Netherlands and Belgium registered minor volume and value shares in 2022. They managed to gain sales mainly from the food and beverages and animal feed industries. In 2020, the Netherlands had more than 60 companies and research institutions focused on plant-based protein. Plant-based protein has become more popular in grocery stores and appears on menus at fast-food restaurants across the country. In 2023, soy protein dominated consumption in the country with a value share of 82.41%.
- France is anticipated to be one of the fastest-growing countries, registering a CAGR of 5.47% during the forecast period. Many firms, like ADM, Cargill, and Roquette, invested in plant-based proteins in France to achieve higher profit margins, which helped them cushion the impact of commodity prices and trade wars. Most plant protein used in animal feed is imported, including soy from the United States and Brazil. In 2021, France imported soy valued at USD 5.8 billion from the United States. However, the country aims to increase domestic production for feed and human nutrition, thus boosting agri-food sovereignty and sustainability.
Europe Plant Protein Ingredients Market Trends
The growth in plant protein consumption provides opportunities for key players in the market
- The graph given depicts the per capita consumption of plant protein in all the countries of Europe. The consumer shift toward vegan diets majorly drives the market. The functional efficiency and cost competitiveness offered by reliable plant protein products are increasing their utilization in a wide variety of processed foods. Plant protein from soy is considered healthy for all age groups and helps keep the body fit. Plant-based protein alternatives are being widely used in the food and beverage industry.
- The region has untapped potential among consumers willing to switch their diets to plant-based protein sources. For instance, within four years, the number of vegans doubled from 1.3 million in 2016 to 2.6 million in 2020. However, the market faces challenges, such as a lack of innovation and restrictions on public policy. There are still a few aspects holding back Italian consumers from making the shift, such as the possible presence of GMOs, doubts over the origin of raw materials used in the product's composition, and the possible use of herbicides on crops.
- Plant protein enhances food items' nutritional and functional values and provides good taste. The market observed an increase of around 45-50% in the consumption of plant-based food across the region. For instance, Bolthouse Farms expanded its beverage range with the "1915 Organic" brand line, which includes cold-pressed juices and vegan protein shakes. Also, protein manufacturers are trying to initiate strategic programs that will impact the improvement of consumption of plant protein sources such as soy protein in the region. For instance, Donau Soja developed a Protein Strategy for Europe in 2023, impacting the availability of soybeans in the region.
Europe is focusing on increasing the production of soy, wheat, and pea
- The graph given depicts the production of dry peas, rice, soybeans, and wheat, raw materials considered for the market. Total grain production in countries like Germany reached 45.7 million ton during 2019-2020, up from 37.9 million ton during 2018-2019. Wheat production for 2019-2020 reached 24.2 million ton, up from 20.3 million ton. However, the United Kingdom is the key producer of wheat and dry peas. In 2019, the country's wheat production amounted to 16.2 million tons, rising by 19.70%, i.e., 2.7 million tons by volume, over the previous year, owing to regular rainfall and a temperate climate.
- Italy is a key producer of distinct plant protein commodities, mainly wheat, followed by rice, soybean, and peas. Italy is the EU's biggest producer of soy and the biggest producer of rice. The country mainly produces Japonica rice. In 2019, Japonica production reached nearly 1.1 million ton, while less than 400,000 ton of Indica varieties were produced. This implied a total milled rice volume of approximately 900,000 ton. Carnaroli, Arborio, Roma, S.Andrea, Baldo, Vialone Nano, and Balilla are among the main varieties.
- Wheat exports amounted to 5.2 million ton, with imports at 3.7 million ton. Plant protein commodities grown in France include wheat, peas, rice, and soybeans. France produced 40,604,960 ton of wheat in 2019. Volume fluctuations in wheat production are caused by bad weather and pest infestation. In contrast, in 2020, France's wheat production was hampered by heavy rains in the fall of 2019, which delayed planting, a mild winter that resulted in an aphid infestation, and a dry spring that caused moisture stress.
Europe Plant Protein Ingredients Industry Overview
The Europe Plant Protein Ingredients Market is fragmented, with the top five companies occupying 28.94%. The major players in this market are Archer Daniels Midland Company, Ingredion Incorporated, International Flavors & Fragrances Inc., Kerry Group PLC and Sudzucker AG (sorted alphabetically).
Additional Benefits:
- The market estimate (ME) sheet in Excel format
- 3 months of analyst support
TABLE OF CONTENTS
1 EXECUTIVE SUMMARY & KEY FINDINGS
2 INTRODUCTION
- 2.1 Study Assumptions & Market Definition
- 2.2 Scope of the Study
- 2.3 Research Methodology
3 KEY INDUSTRY TRENDS
- 3.1 End User Market Volume
- 3.1.1 Baby Food and Infant Formula
- 3.1.2 Bakery
- 3.1.3 Beverages
- 3.1.4 Breakfast Cereals
- 3.1.5 Condiments/Sauces
- 3.1.6 Confectionery
- 3.1.7 Dairy and Dairy Alternative Products
- 3.1.8 Elderly Nutrition and Medical Nutrition
- 3.1.9 Meat/Poultry/Seafood and Meat Alternative Products
- 3.1.10 RTE/RTC Food Products
- 3.1.11 Snacks
- 3.1.12 Sport/Performance Nutrition
- 3.1.13 Animal Feed
- 3.1.14 Personal Care and Cosmetics
- 3.2 Protein Consumption Trends
- 3.2.1 Plant
- 3.3 Production Trends
- 3.3.1 Plant
- 3.4 Regulatory Framework
- 3.4.1 France
- 3.4.2 Germany
- 3.4.3 Italy
- 3.4.4 United Kingdom
- 3.5 Value Chain & Distribution Channel Analysis
4 MARKET SEGMENTATION (includes market size in Value in USD and Volume, Forecasts up to 2030 and analysis of growth prospects)
- 4.1 Protein Type
- 4.1.1 Hemp Protein
- 4.1.2 Pea Protein
- 4.1.3 Potato Protein
- 4.1.4 Rice Protein
- 4.1.5 Soy Protein
- 4.1.6 Wheat Protein
- 4.1.7 Other Plant Protein
- 4.2 End User
- 4.2.1 Animal Feed
- 4.2.2 Food and Beverages
- 4.2.2.1 By Sub End User
- 4.2.2.1.1 Bakery
- 4.2.2.1.2 Beverages
- 4.2.2.1.3 Breakfast Cereals
- 4.2.2.1.4 Condiments/Sauces
- 4.2.2.1.5 Confectionery
- 4.2.2.1.6 Dairy and Dairy Alternative Products
- 4.2.2.1.7 Meat/Poultry/Seafood and Meat Alternative Products
- 4.2.2.1.8 RTE/RTC Food Products
- 4.2.2.1.9 Snacks
- 4.2.3 Personal Care and Cosmetics
- 4.2.4 Supplements
- 4.2.4.1 By Sub End User
- 4.2.4.1.1 Baby Food and Infant Formula
- 4.2.4.1.2 Elderly Nutrition and Medical Nutrition
- 4.2.4.1.3 Sport/Performance Nutrition
- 4.3 Country
- 4.3.1 Belgium
- 4.3.2 France
- 4.3.3 Germany
- 4.3.4 Italy
- 4.3.5 Netherlands
- 4.3.6 Russia
- 4.3.7 Spain
- 4.3.8 Turkey
- 4.3.9 United Kingdom
- 4.3.10 Rest of Europe
5 COMPETITIVE LANDSCAPE
- 5.1 Key Strategic Moves
- 5.2 Market Share Analysis
- 5.3 Company Landscape
- 5.4 Company Profiles (includes Global Level Overview, Market Level Overview, Core Business Segments, Financials, Headcount, Key Information, Market Rank, Market Share, Products and Services, and Analysis of Recent Developments).
- 5.4.1 A. Costantino & C. SpA
- 5.4.2 Archer Daniels Midland Company
- 5.4.3 Cargill Incorporated
- 5.4.4 Emsland Group
- 5.4.5 Ingredion Incorporated
- 5.4.6 International Flavors & Fragrances Inc.
- 5.4.7 Kerry Group PLC
- 5.4.8 Lantmannen
- 5.4.9 Roquette Frere
- 5.4.10 Sudzucker AG
6 KEY STRATEGIC QUESTIONS FOR PROTEIN INGREDIENTS INDUSTRY CEOS
7 APPENDIX
- 7.1 Global Overview
- 7.1.1 Overview
- 7.1.2 Porter's Five Forces Framework
- 7.1.3 Global Value Chain Analysis
- 7.1.4 Market Dynamics (DROs)
- 7.2 Sources & References
- 7.3 List of Tables & Figures
- 7.4 Primary Insights
- 7.5 Data Pack
- 7.6 Glossary of Terms
- 発行日
- 発行
- Mordor Intelligence
- ページ情報
- 英文 262 Pages
- 納期
- 2~3営業日

