
|
市場調査レポート
商品コード
1690968
米国のゼラチン:市場シェア分析、産業動向・統計、成長予測(2025年~2030年)United States Gelatin - Market Share Analysis, Industry Trends & Statistics, Growth Forecasts (2025 - 2030) |
||||||
カスタマイズ可能
適宜更新あり
|
|||||||
| 米国のゼラチン:市場シェア分析、産業動向・統計、成長予測(2025年~2030年) |
|
出版日: 2025年03月18日
発行: Mordor Intelligence
ページ情報: 英文 166 Pages
納期: 2~3営業日
|

全表示
- 概要
- 目次
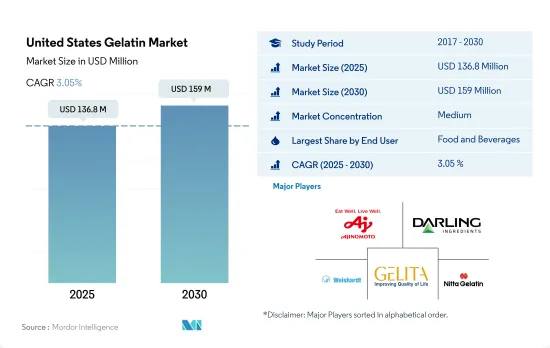
米国のゼラチン市場規模は2025年に1億3,680万米ドルと推定され、2030年には1億5,900万米ドルに達すると予測され、予測期間中(2025-2030年)のCAGRは3.05%で成長する見込みです。
タンパク質を添加した飲食品への消費嗜好の変化がゼラチンの使用に影響を与えています。
- ゼラチン市場では、飲食品分野が最も多くの用途を占めています。これは、ゼラチンが機能的に適しているためです。飲食品セグメントは2016年から2022年にかけて26.3%の全体的な数量成長を観察しました。2022年には、飲食品サブセグメントが飲食品セグメントの中で約60%の最大市場シェアを占めました。これは主に、従来の炭酸飲料や焼き菓子から、よりタンパク質ベースのソリューションへと嗜好がシフトしているためです。2021年には、米国の世帯の35%が、高タンパク、パレオ、低炭水化物、オーガニックなど、特定のタンパク質中心の食生活を実践していました。
- 同市場は2020年に数量ベースで前年比10.54%の最高成長率を観測し、これは2019年の成長率のほぼ3倍でした。コンビニエンス食品の家庭内消費量は、COVID-19の流行により2020年には26%に増加しました。しかし、ライフスタイルの選択としての健康の重要性が消費者に影響を及ぼし、ゼラチンの利点に関する意識の高まりと相まって、飲食品分野におけるゼラチン需要を誘発しました。
- すべてのセグメントの中で、パーソナルケアと化粧品セグメントが最も急成長している産業です。予測期間中のCAGRは6.49%と予測されています。これは、ゼラチンの平均タンパク質含有量が、乳清タンパク質や乳タンパク質のような他の乳タンパク質よりも5%高いことに起因しています。また、ゼラチンをベースとしたパーソナル・ケア製品や化粧品も好まれています。また、ゼラチンは染毛剤やティントの色素をより均一に取り込むことができます。
米国のゼラチン市場動向
ベーカリー業界の成長は大手企業が牽引
- 米国のベーカリー業界を特徴づけているのは、複数の小規模・大規模プレーヤーです。2020年の米国の小売ベーカリー数は23,158店以上。カリフォルニア州、ニューヨーク州、テキサス州、フロリダ州、イリノイ州は、ベーカリーのトップ市場です。2020年には、カリフォルニア州だけで約3,400のベーカリーが出店しています。大手企業による積極的な出店動向は、成長機会の多さを反映しています。需要の高まりが続く中、市場は予測期間中に成長すると予想されます。
- ベーカリー製品の中でも、パン、ロールパン、ケーキは最も消費量の多い製品です。2022年、パン業界はロシア・ウクライナ戦争による価格インフレを記録し、小麦価格が40%上昇しました。世界の穀倉地帯」として知られる米国では、戦争により小麦、オート麦、食用油の生産が妨げられました。2020年には、COVID-19の大流行により、同国の小麦生産量は5.5%減少しました。
- 2020年には、封鎖期間中の備蓄がベーカリー製品の需要を押し上げました。販売額と販売量はこの年にピークに達しました。包装パン、モーニング、クッキーの需要増により、2020年の販売数量は前年比約7.52%増となりました。サワードウ製品、ケーキ、クッキーは、閑散期以降、販売量を伸ばしました。チョコレート・チップ・クッキーと糖蜜クッキーは、消費者の間で広く関心を持たれ、高い需要が見られました。アメリカ人の約5人に1人が毎日3枚以上のクッキーを食べています。クッキーの中毒性という点では、ユタ州がトップで、アイダホ州とオレゴン州が僅差で続きます。メイン州、アラスカ州、サウスダコタ州、アイオワ州、カンザス州の人々は、チョコレートチップクッキーのトップ消費者です。
食肉生産は、植物性タンパク質原料メーカーの原料として大きく貢献しています。
- ゼラチンは主に食肉産業、特に牛、鶏、豚の骨付き肉からの供給で成り立っています。食肉消費者としては、コラーゲン生産者が60%以上を占め、ゼラチンがそれに続きます。需要の主因は、国内の飲食品部門全体、特に食品添加物としてのタンパク質や高タンパク質製品への強い傾斜です。特に骨の構造とその機能に関する最近の医学研究の進歩は、骨の健康を最適化するための栄養学的アプローチに革命をもたらしました。
- ゼラチンベースの製品に対する消費者の意識の高まりは、ゼラチンの生産量の増加につながり、いくつかの産業分野での用途の拡大とともに、市場を押し上げると予想されます。米国のゼラチン市場は、消費者のライフスタイルの変化により、予測期間中に2.1%の大幅な成長が見込まれています。開発メーカーは、新しい種類のゼラチン強化製品を開発するために研究開発費を増やしており、その結果、顧客層を拡大し、競争上の優位性を獲得するのに役立っています。
- COVID-19の大流行により、動物産業の生産量は減少し、生産工場は全国的に閉鎖されました。ゼラチン製品は、加水分解された形態が栄養食品のタンパク質強化に使用されるため、主に特別食用途に使用されます。乾燥した加水分解ゼラチンは92%以上のタンパク質を含みます。通常、アミノ酸の栄養バランスをとるために、他の加水分解タンパク質とブレンドされます。市場は、機能性食品業界におけるゼラチンの使用量の増加が主な要因となっています。
米国のゼラチン産業概要
米国のゼラチン市場は適度に統合されており、上位5社で64.71%を占めています。この市場の主要企業は以下の通りです。 Ajinomoto Co. Inc., Darling Ingredients Inc., Gelatines Weishardt SAS, GELITA AG and Nitta Gelatin Inc.(sorted alphabetically).
その他の特典
- エクセル形式の市場予測(ME)シート
- 3ヶ月のアナリストサポート
目次
第1章 エグゼクティブサマリーと主な調査結果
第2章 イントロダクション
- 調査の前提条件と市場定義
- 調査範囲
- 調査手法
第3章 主要産業動向
- エンドユーザー市場規模
- ベビーフードおよび乳児用調製粉乳
- ベーカリー
- 飲料
- 朝食用シリアル
- 調味料/ソース
- 菓子類
- 乳製品および乳製品代替製品
- 高齢者栄養・医療栄養
- 肉・鶏肉・魚介類および肉代替製品
- RTE/RTC食品
- スナック
- スポーツ/パフォーマンス栄養
- 動物飼料
- パーソナルケアと化粧品
- タンパク質消費動向
- 動物
- 生産動向
- 動物
- 規制の枠組み
- 米国
- バリューチェーンと流通チャネル分析
第4章 市場セグメンテーション
- 形態
- 動物性
- 海洋性
- エンドユーザー
- 飲食品
- サブエンドユーザー別
- ベーカリー
- 飲料
- 調味料/ソース
- 菓子類
- 乳製品・乳製品代替品
- RTE/RTC食品
- スナック
- パーソナルケアと化粧品
- サプリメント
- サブエンドユーザー別
- 飲食品
第5章 競合情勢
- 主要な戦略動向
- 市場シェア分析
- 企業情勢
- 企業プロファイル.
- Ajinomoto Co. Inc.
- Baotou Dongbao Bio Tech Co. Ltd
- Darling Ingredients Inc.
- Gelatines Weishardt SAS
- GELITA AG
- Hangzhou Qunli Gelatin Chemical Co. Ltd
- Italgelatine SpA
- Lapi Gelatine SpA
- Nitta Gelatin Inc.
第6章 CEOへの主な戦略的質問
第7章 付録
- 世界概要
- 概要
- ファイブフォース分析フレームワーク
- 世界のバリューチェーン分析
- 市場力学(DROs)
- 情報源と参考文献
- 図表一覧
- 主要洞察
- データパック
- 用語集
The United States Gelatin Market size is estimated at 136.8 million USD in 2025, and is expected to reach 159 million USD by 2030, growing at a CAGR of 3.05% during the forecast period (2025-2030).
Shifting consumption preferences towards protein infused food and beverages is influencing the use of gelatin
- The food and beverage segment accounts for the highest number of applications in the gelatin market. This is because of the functional suitability of gelatin. The food and beverage segment observed an overall voluminal growth of 26.3% from 2016 to 2022. In 2022, the bakery and beverages sub-segment accounted for the largest market share of around 60% within the food and beverage segment. This was primarily due to the shifting preference from conventionally carbonated beverages and baked goods to more protein-based solutions. In 2021, 35% of US households followed a specific protein-focused diet, such as high-protein, paleo, low-carb, and organic.
- The market observed the highest Y-o-Y growth rate of 10.54% in terms of volume in 2020, which was almost thrice the growth rate of 2019. The in-home consumption volume of convenience food products increased to 26% in 2020 due to the COVID-19 pandemic. However, the importance of health as a lifestyle choice has influenced consumers, which, coupled with rising awareness about the benefits of gelatin, has triggered the demand for gelatin in the food and beverage sector.
- Among all segments, the personal care and cosmetics segment is the fastest-growing industry. It is projected to register a CAGR value of 6.49% during the forecast period. This is attributed to the average protein content of gelatin, which is 5% higher than other dairy proteins like whey and milk proteins. People also prefer gelatin-based personal care and cosmetic products due to their film-forming properties that help cure hair and skin. Gelatin also ensures a more even uptake of pigments in hair dyes and tints.
United States Gelatin Market Trends
The growth of the bakery industry is led by large commercial players
- Several small-scale and large-scale players characterize the US bakery industry. There were more than 23,158 retail bakeries in the United States in 2020. California, New York, Texas, Florida, and Illinois are among the top markets for bakeries in the country. In 2020, California alone accounted for about 3,400 bakeries. The aggressive store opening trend set by major players reflects plenty of growth opportunities. As the demand continues to rise, the market is expected to grow over the forecast period.
- Among all bakery products, bread, rolls, and cakes are the most highly consumed products. In 2022, the bread industry recorded price inflation due to the Russia-Ukraine War, which resulted in a 40% rise in wheat prices. The United States, known as the "breadbasket of the world," witnessed hampered wheat, oats, and cooking oil production due to the war. In 2020, wheat production in the country declined by 5.5% due to the COVID-19 pandemic.
- In 2020, stockpiling during the lockdowns boosted the demand for bakery products. The sales value and volume peaked during that year. Increased demand for packaged bread, morning goods, and cookies resulted in a Y-o-Y growth volume of around 7.52% in 2020. After the lockdown period, the sales of sourdough products, cakes, and cookies increased. Chocolate-chip cookies and molasses cookies witnessed high demand due to widespread interest among consumers. About one in five Americans consumes more than three cookies daily. In terms of cookie addiction, Utah tops the list, closely followed by Idaho and Oregon. People from Maine, Alaska, South Dakota, Iowa, and Kansas are the top consumers of chocolate chip cookies.
Meat production majorly contributes as a raw material for plant protein ingredient manufacturers
- Gelatin is mainly driven by supply from the meat industry, especially from meat of cattle, chickens. As meat consumers, collagen producers account for more than 60%, followed by gelatin. The demand is mainly driven by a strong inclination toward protein and high-protein products across the entire food and beverage sector, especially as a food additive, in the country. Recent advancements in medical research, especially on bone structure and its function, have revolutionized the nutritional approach to optimizing bone health.
- The increasing consumer awareness about gelatin-based products leads to higher production of gelatin, which, along with expanding its application in several industrial segments, is expected to boost the market. The US gelatin market is expected to witness considerable growth of 2.1% during the forecast period due to consumers' lifestyle changes. Manufacturers are increasing their R&D expenditure to develop new kinds of gelatin-enriched products, which, in turn, helps them broaden their customer base and gain a competitive advantage.
- The animal industry's production declined due to the COVID-19 pandemic as production plants shut down across the nation. Gelatin products are mainly used in special dietary applications because their hydrolyzed form is used to protein-fortify dietary foods. Dried, hydrolyzed gelatin contains over 92% protein. Typically, it is blended with other hydrolyzed proteins to balance the nutritional aspects of amino acids. The market is majorly driven by the rise in the usage of gelatin in the functional food industry.
United States Gelatin Industry Overview
The United States Gelatin Market is moderately consolidated, with the top five companies occupying 64.71%. The major players in this market are Ajinomoto Co. Inc., Darling Ingredients Inc., Gelatines Weishardt SAS, GELITA AG and Nitta Gelatin Inc. (sorted alphabetically).
Additional Benefits:
- The market estimate (ME) sheet in Excel format
- 3 months of analyst support
TABLE OF CONTENTS
1 EXECUTIVE SUMMARY & KEY FINDINGS
2 INTRODUCTION
- 2.1 Study Assumptions & Market Definition
- 2.2 Scope of the Study
- 2.3 Research Methodology
3 KEY INDUSTRY TRENDS
- 3.1 End User Market Volume
- 3.1.1 Baby Food and Infant Formula
- 3.1.2 Bakery
- 3.1.3 Beverages
- 3.1.4 Breakfast Cereals
- 3.1.5 Condiments/Sauces
- 3.1.6 Confectionery
- 3.1.7 Dairy and Dairy Alternative Products
- 3.1.8 Elderly Nutrition and Medical Nutrition
- 3.1.9 Meat/Poultry/Seafood and Meat Alternative Products
- 3.1.10 RTE/RTC Food Products
- 3.1.11 Snacks
- 3.1.12 Sport/Performance Nutrition
- 3.1.13 Animal Feed
- 3.1.14 Personal Care and Cosmetics
- 3.2 Protein Consumption Trends
- 3.2.1 Animal
- 3.3 Production Trends
- 3.3.1 Animal
- 3.4 Regulatory Framework
- 3.4.1 United States
- 3.5 Value Chain & Distribution Channel Analysis
4 MARKET SEGMENTATION (includes market size in Value in USD and Volume, Forecasts up to 2030 and analysis of growth prospects)
- 4.1 Form
- 4.1.1 Animal Based
- 4.1.2 Marine Based
- 4.2 End User
- 4.2.1 Food and Beverages
- 4.2.1.1 By Sub End User
- 4.2.1.1.1 Bakery
- 4.2.1.1.2 Beverages
- 4.2.1.1.3 Condiments/Sauces
- 4.2.1.1.4 Confectionery
- 4.2.1.1.5 Dairy and Dairy Alternative Products
- 4.2.1.1.6 RTE/RTC Food Products
- 4.2.1.1.7 Snacks
- 4.2.2 Personal Care and Cosmetics
- 4.2.3 Supplements
- 4.2.3.1 By Sub End User
- 4.2.1 Food and Beverages
5 COMPETITIVE LANDSCAPE
- 5.1 Key Strategic Moves
- 5.2 Market Share Analysis
- 5.3 Company Landscape
- 5.4 Company Profiles (includes Global Level Overview, Market Level Overview, Core Business Segments, Financials, Headcount, Key Information, Market Rank, Market Share, Products and Services, and Analysis of Recent Developments).
- 5.4.1 Ajinomoto Co. Inc.
- 5.4.2 Baotou Dongbao Bio Tech Co. Ltd
- 5.4.3 Darling Ingredients Inc.
- 5.4.4 Gelatines Weishardt SAS
- 5.4.5 GELITA AG
- 5.4.6 Hangzhou Qunli Gelatin Chemical Co. Ltd
- 5.4.7 Italgelatine SpA
- 5.4.8 Lapi Gelatine SpA
- 5.4.9 Nitta Gelatin Inc.
6 KEY STRATEGIC QUESTIONS FOR PROTEIN INGREDIENTS INDUSTRY CEOS
7 APPENDIX
- 7.1 Global Overview
- 7.1.1 Overview
- 7.1.2 Porter's Five Forces Framework
- 7.1.3 Global Value Chain Analysis
- 7.1.4 Market Dynamics (DROs)
- 7.2 Sources & References
- 7.3 List of Tables & Figures
- 7.4 Primary Insights
- 7.5 Data Pack
- 7.6 Glossary of Terms
