
|
市場調査レポート
商品コード
1690080
米国のデータセンター- 市場シェア分析、産業動向と統計、成長予測(2025年~2030年)United States Data Center - Market Share Analysis, Industry Trends & Statistics, Growth Forecasts (2025 - 2030) |
||||||
カスタマイズ可能
適宜更新あり
|
|||||||
| 米国のデータセンター- 市場シェア分析、産業動向と統計、成長予測(2025年~2030年) |
|
出版日: 2025年03月18日
発行: Mordor Intelligence
ページ情報: 英文 236 Pages
納期: 2~3営業日
|

全表示
- 概要
- 目次
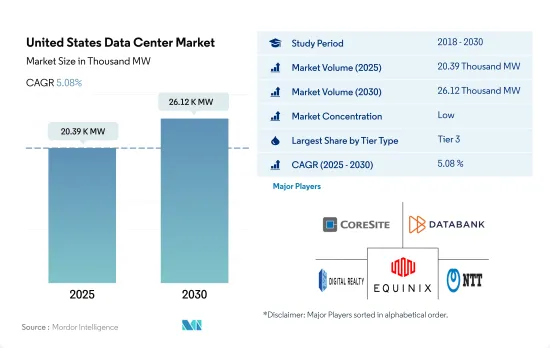
米国のデータセンター市場規模は、2025年に2万390kWと推定され、2030年には2万6,120kWに達し、CAGR 5.08%で成長すると予測されます。
また、2025年のコロケーション収益は240億3,640万米ドル、2030年には386億7,530万米ドルに達すると予測され、予測期間(2025年~2030年)のCAGRは9.98%で成長します。
2023年にはティア3データセンターが数量ベースで大半のシェアを占める
- ティア3データセンターは国内で最も好まれています。2022年のIT負荷容量は5,319.6MWでした。ティア3データセンターは、冗長化されたデュアル電源のサーバー、ストレージ、ネットワークリンク、その他のITコンポーネントを備えています。2022年現在、国内には399のティア3データセンターがあります。約73のデータセンターがティア3基準で建設中です。
- 中小企業は一般的に、ティア3ランクの施設を好みます。中小企業は活動中の企業の99.9%を占めており、米国経済の重要な構成要素となっています。BFSIや電気通信などのエンドユーザーは、ハイパースケールのコロケーションサービスに注目しています。
- ティア4データセンターは、99.995%のアップタイムを提供するため、主に大企業に次いで好まれています。しかし、コストが高いことが、これらの施設の導入が少ない主な要因となっています。データトラフィックの増加に伴い、今後のデータセンターはティア4基準に従うことが予想されます。米国では、IPトラフィックが2016年の年間376.2エクサバイトから、2021年には955.7エクサバイトに達し、より冗長化された効率的な施設に対する需要の高まりを示唆しています。その結果、2029年の市場シェアはティア4データセンターが48.9%と最も高く、ティア3施設が45.4%でこれに続くと予想されます。
- ティア1とティア2のデータセンターは、ティア1の期待稼働時間が99.671%(年間ダウンタイム28.8時間)であるのに対し、ティア2の期待稼働時間は99.741%(年間ダウンタイム22時間)であるため、最も好まれないです。これらのデータセンターは、データ・ストレージのニーズに対してコスト効率の高いオプションを求める中小企業によく利用されています。しかし、機能性が低いため、中小企業でもティア3認証のホールセールコロケーションサービスの採用に力を入れています。そのため、ティア1とティア2のDCの成長率は最も低いと予想されます。
米国のデータセンター市場動向
ビデオ通話、店舗内ショッピング体験の拡張、遠隔医療サービス、モバイルゲームの改善などの利用が増加し、市場成長を牽引
- 5Gや、FWAなどの技術をサポートする広範なファイバー接続など、より高速な代替ネットワークの導入により、スマートフォンによるデータ消費量は2018年の1.8GBから2022年にはCAGR 24.7%で約8.5GBに増加しました。この消費量はさらに増加し、2029年にはCAGR 33.6%で64GBを超えると予想されます。5Gがスマートフォンの普及とアップグレードを促進するにつれ、市場ではデータ生成ポイントが増加し、より高速な無線ネットワークを活用したデータ消費の増加につながります。
- インターネットの高速化と、それに続くアクセス可能なデバイスの普及は、地域におけるデータ消費の決定と推定に重要な役割を果たします。米国における5Gモバイル接続数は、2021年の15%から2025年には約68%に増加するというデータがあり、これは同国における5Gモバイルの普及率が高いことを示しています。ユーザーは、5Gネットワークを通じたアクティビティのいくつかとして、強化されたビデオ通話、拡張された店舗でのショッピング体験、遠隔医療サービス、改善されたモバイルゲームを非常に魅力的、または非常に魅力的だと感じており、これがデータ利用に寄与しています。
- YouTubeが約74%、Gmailが61%、Facebookが59%、Google検索アプリが58%と続きます。視聴者の間でAndroidとiOSが分かれているにもかかわらず、このようなスマートフォンアプリが広くリーチしていることは、米国でアプリが深く浸透し、利用されていることを示しています。このことは、このようなメディアが実行し、ユーザーデータを保存するために必要なメモリ・プラットフォームを提供するデータ・ストレージの必要性を浮き彫りにし、データ処理設備に対するより大きな需要を生み出しています。
スマートフォンの普及と5G接続の増加が市場成長を牽引
- 米国は、北米と世界のスマートフォン・ポートフォリオの両方において重要な市場です。スマートフォンの普及率は2021年の83%から2025年には85%に成長すると予想されており、加入者普及率の伸びに大きく寄与し、2021年の85%から2025年には86%に増加します。この成長により、スマートフォンの販売台数が増加し、国内のスマートフォン全体の台数も増加します。米国のスマートフォン業界では、買い替え率の長期化と魅力的な機能の不足が2018年の販売台数の減少につながったもの、競争の激しいスマートフォン市場で5Gの展開と通信事業者による採用が進み、市場は大きく活性化しました。
- さらに、2022年1月に発表されたデータでは、スマートフォンの販売額が17億米ドル増加し、2021年の約730億米ドルに対し、2022年には総額約747億米ドルに達することが示されました。COVID-19の間に市場が減速したにもかかわらず、5Gは米国におけるスマートフォンの採用と普及の重要な促進要因となっています。このパンデミックにより、2025年の5G接続数の予想が2億500万台から約2億1,800万台に増加し、5Gがいかにこの地域のスマートフォン販売を向上させるかを示しています。
- スマートフォン数の増加は、国内のモバイルワイヤレス加入者接続数の増加を通じて観察され、2019年の約4億4,250万から2021年には約4億9,891万に増加しました。この動向は、販売に貢献する高い普及率を示しています。予測期間中、5Gはデータポイントの増加を通じてデータ生成に大きく貢献し、データを保存・処理するためにより多くのデータセンターへの需要を生み出すと思われます。
米国のデータセンター産業の概要
米国のデータセンター市場は細分化されており、上位5社で16.24%を占めています。この市場の主要企業は以下の通り。 CoreSite(America Tower Corporation), Databank Holdings Ltd, Digital Realty Trust, Inc., Equinix, Inc. and NTT Ltd.(sorted alphabetically).
その他の特典
- エクセル形式の市場予測(ME)シート
- 3ヶ月間のアナリストサポート
目次
第1章 エグゼクティブサマリーと主な調査結果
第2章 レポートのオファー
第3章 イントロダクション
- 調査の前提条件と市場定義
- 調査範囲
- 調査手法
第4章 市場展望
- 耐荷重
- 床面積
- コロケーション収入
- 設置ラック数
- ラックスペース利用率
- 海底ケーブル
第5章 主要業界動向
- スマートフォンユーザー数
- スマートフォン1台当たりのデータトラフィック
- モバイルデータ速度
- ブロードバンドデータ速度
- 光ファイバー接続ネットワーク
- 規制の枠組み
- 米国
- バリューチェーンと流通チャネル分析
第6章 市場セグメンテーション
- ホットスポット
- アトランタ
- オースティン
- ボストン
- シカゴ
- ダラス
- ヒューストン
- ロサンゼルス
- ニュージャージー
- ニューヨーク
- 北カリフォルニア
- バージニア北部
- 北西部
- フェニックス
- ソルトレイクシティ
- 米国のその他の地域
- データセンターの規模
- 大規模
- 超大規模
- 中規模
- メガ
- 小規模
- ティアタイプ
- ティア1と2
- ティア3
- ティア4
- 吸収量
- 非利用
- 利用
- コロケーションタイプ別
- ハイパースケール
- リテール
- ホールセール
- エンドユーザー別
- BFSI
- クラウド
- eコマース
- 政府機関
- 製造業
- メディア&エンターテイメント
- テレコム
- その他エンドユーザー
第7章 競合情勢
- 市場シェア分析
- 企業情勢
- 企業プロファイル.
- CoreSite(America Tower Corporation)
- CyrusOne Inc.
- Cyxtera Technologies
- Databank Holdings Ltd
- Digital Realty Trust, Inc.
- Equinix, Inc.
- Flexential Corp.
- H5 Data Centers LLC
- NTT Ltd.
- Quality Technology Services
- Switch
- Vantage Data Centers, LLC
- LIST OF COMPANIES STUDIED
第8章 CEOへの主な戦略的質問
第9章 付録
- 世界の概要
- 概要
- ファイブフォース分析フレームワーク
- 世界のバリューチェーン分析
- 世界市場規模とDRO
- 情報源と参考文献
- 図表リスト
- 主要洞察
- データパック
- 用語集
The United States Data Center Market size is estimated at 20.39 thousand MW in 2025, and is expected to reach 26.12 thousand MW by 2030, growing at a CAGR of 5.08%. Further, the market is expected to generate colocation revenue of USD 24,036.4 Million in 2025 and is projected to reach USD 38,675.3 Million by 2030, growing at a CAGR of 9.98% during the forecast period (2025-2030).
Tier 3 data center accounted for majority share in terms of volume in 2023
- Tier 3 data centers are the most preferred in the country. They operated at an IT load capacity of 5,319.6 MW in 2022. Tier 3 data centers have redundant and dual-powered servers, storage, network links, and other IT components. As of 2022, the country had 399 tier 3 data centers. Around 73 data centers are under construction with Tier 3 standards.
- SMEs generally prefer a Tier 3-rated facility. SMEs are a vital component of the US economy, as they comprise 99.9% of active enterprises. End users such as BFSI and telecom are focusing on hyperscale colocation services.
- Tier 4 data centers are the next most preferred, mainly by large enterprises, as they provide 99.995% uptime. However, high cost is the major factor for the low adoption of these facilities. With the data traffic generation, upcoming data centers are expected to follow Tier 4 standards. In the United States, IP traffic reached an annual run rate of 955.7 exabytes in 2021, up from an annual run rate of 376.2 exabytes in 2016, suggesting the growing demand for more redundant and efficient facilities. As a result, tier 4 data centers are expected to hold the highest market share of 48.9% in 2029, followed by tier 3 facilities with a share of 45.4%.
- Tier 1 & 2 data centers are the least preferred as tier 1 has an expected uptime of 99.671% (28.8 hours of downtime annually), while tier 2 has an expected uptime of 99.741% (22 hours of downtime annually). These data centers are commonly utilized by small businesses looking for a cost-effective option for their data storage needs. However, due to lower functionality, even SMEs are focusing on adopting wholesale colocation services with a Tier 3 certification. Therefore, tier 1 & 2 DCs are expected to showcase the lowest growth.
United States Data Center Market Trends
Increase use of video calling, augmented in-store shopping experiences, remote health services, and improved mobile gaming to drive market growth
- With the introduction of faster network alternatives, such as 5G and extensive fiber connectivity supporting technologies like FWA, data consumption through smartphones increased from 1.8 GB in 2018 to about 8.5 GB in 2022 at a CAGR of 24.7%. This consumption is expected to further increase to more than 64 GB by 2029, at a CAGR of 33.6%. As 5G drives smartphone adoption and upgrades, the market will witness more data generating points, leading to increased data consumption that leverages higher wireless network speeds.
- Faster internet and the subsequent penetration of devices capable of accessing it play a crucial role in determining and estimating data consumption in a region. Data suggests that the number of 5G mobile connections in the United States will increase from 15% in 2021 to about 68% by 2025, signifying high 5G mobile penetration in the country. Users find enhanced video calling, augmented in-store shopping experiences, remote health services, and improved mobile gaming as some of the activities through 5G networks to be very or extremely appealing, which contributes to data usage.
- Several apps account for considerable smartphone reach across audiences, with YouTube accounting for about 74% audience reach, followed by 61% for Gmail, 59% for Facebook, and 58% for the Google Search app. The extensive reach of such smartphone apps, despite the Android and iOS division among the audience, signifies deep app penetration and usage in the United States. This highlights the need for data storage to provide the required memory platforms for such media to perform and store user data, thereby creating a greater demand for data processing facilities.
Smartphone adoption and increasing 5G connections to drive market growth
- The United States is a significant market in both North America and the global smartphone portfolio. With smartphone adoption expected to grow from 83% in 2021 to 85% by 2025, it will substantially contribute to the growth of subscriber penetration rates, increasing from 85% in 2021 to 86% by 2025. This growth will result in a rise in smartphone sales and the overall number of smartphones in the country. Although longer replacement rates and a lack of compelling features in the US smartphone industry led to a decrease in sales in 2018, the market received a major boost with the 5G rollout and adoption by operators in the highly competitive smartphone market.
- Additionally, data released in January 2022 indicated a USD 1.7 billion increase in smartphone sales value, totaling approximately USD 74.7 billion in 2022, compared to about USD 73 billion in 2021. Despite the market slowdown during COVID-19, 5G has been a key driver of smartphone adoption and penetration in the United States. The pandemic increased the anticipated number of 5G connections in 2025 from 205 million to about 218 million, signifying how 5G would drive better smartphone sales in the region.
- The increase in the number of smartphones was observed through the growth of mobile wireless subscriber connections in the country, rising from about 442.5 million in 2019 to approximately 498.91 million by 2021. This trend indicates the high penetration rates contributing to sales. Over the forecast period, 5G will heavily contribute to data generation through increased data points, generating demand for more data centers to store and process the data.
United States Data Center Industry Overview
The United States Data Center Market is fragmented, with the top five companies occupying 16.24%. The major players in this market are CoreSite (America Tower Corporation), Databank Holdings Ltd, Digital Realty Trust, Inc., Equinix, Inc. and NTT Ltd. (sorted alphabetically).
Additional Benefits:
- The market estimate (ME) sheet in Excel format
- 3 months of analyst support
TABLE OF CONTENTS
1 EXECUTIVE SUMMARY & KEY FINDINGS
2 REPORT OFFERS
3 INTRODUCTION
- 3.1 Study Assumptions & Market Definition
- 3.2 Scope of the Study
- 3.3 Research Methodology
4 MARKET OUTLOOK
- 4.1 It Load Capacity
- 4.2 Raised Floor Space
- 4.3 Colocation Revenue
- 4.4 Installed Racks
- 4.5 Rack Space Utilization
- 4.6 Submarine Cable
5 Key Industry Trends
- 5.1 Smartphone Users
- 5.2 Data Traffic Per Smartphone
- 5.3 Mobile Data Speed
- 5.4 Broadband Data Speed
- 5.5 Fiber Connectivity Network
- 5.6 Regulatory Framework
- 5.6.1 United States
- 5.7 Value Chain & Distribution Channel Analysis
6 MARKET SEGMENTATION (INCLUDES MARKET SIZE IN VOLUME, FORECASTS UP TO 2030 AND ANALYSIS OF GROWTH PROSPECTS)
- 6.1 Hotspot
- 6.1.1 Atlanta
- 6.1.2 Austin
- 6.1.3 Boston
- 6.1.4 Chicago
- 6.1.5 Dallas
- 6.1.6 Houston
- 6.1.7 Los Angeles
- 6.1.8 New Jersey
- 6.1.9 New York
- 6.1.10 Northern California
- 6.1.11 Northern Virginia
- 6.1.12 Northwest
- 6.1.13 Phoenix
- 6.1.14 Salt Lake City
- 6.1.15 Rest of United States
- 6.2 Data Center Size
- 6.2.1 Large
- 6.2.2 Massive
- 6.2.3 Medium
- 6.2.4 Mega
- 6.2.5 Small
- 6.3 Tier Type
- 6.3.1 Tier 1 and 2
- 6.3.2 Tier 3
- 6.3.3 Tier 4
- 6.4 Absorption
- 6.4.1 Non-Utilized
- 6.4.2 Utilized
- 6.4.2.1 By Colocation Type
- 6.4.2.1.1 Hyperscale
- 6.4.2.1.2 Retail
- 6.4.2.1.3 Wholesale
- 6.4.2.2 By End User
- 6.4.2.2.1 BFSI
- 6.4.2.2.2 Cloud
- 6.4.2.2.3 E-Commerce
- 6.4.2.2.4 Government
- 6.4.2.2.5 Manufacturing
- 6.4.2.2.6 Media & Entertainment
- 6.4.2.2.7 Telecom
- 6.4.2.2.8 Other End User
7 COMPETITIVE LANDSCAPE
- 7.1 Market Share Analysis
- 7.2 Company Landscape
- 7.3 Company Profiles (includes Global Level Overview, Market Level Overview, Core Business Segments, Financials, Headcount, Key Information, Market Rank, Market Share, Products and Services, and Analysis of Recent Developments).
- 7.3.1 CoreSite (America Tower Corporation)
- 7.3.2 CyrusOne Inc.
- 7.3.3 Cyxtera Technologies
- 7.3.4 Databank Holdings Ltd
- 7.3.5 Digital Realty Trust, Inc.
- 7.3.6 Equinix, Inc.
- 7.3.7 Flexential Corp.
- 7.3.8 H5 Data Centers LLC
- 7.3.9 NTT Ltd.
- 7.3.10 Quality Technology Services
- 7.3.11 Switch
- 7.3.12 Vantage Data Centers, LLC
- 7.4 LIST OF COMPANIES STUDIED
8 KEY STRATEGIC QUESTIONS FOR DATA CENTER CEOS
9 APPENDIX
- 9.1 Global Overview
- 9.1.1 Overview
- 9.1.2 Porter's Five Forces Framework
- 9.1.3 Global Value Chain Analysis
- 9.1.4 Global Market Size and DROs
- 9.2 Sources & References
- 9.3 List of Tables & Figures
- 9.4 Primary Insights
- 9.5 Data Pack
- 9.6 Glossary of Terms

