
|
市場調査レポート
商品コード
1940603
米国のアイスクリーム:市場シェア分析、業界動向と統計、成長予測(2026年~2031年)United States Ice Cream - Market Share Analysis, Industry Trends & Statistics, Growth Forecasts (2026 - 2031) |
||||||
カスタマイズ可能
適宜更新あり
|
|||||||
| 米国のアイスクリーム:市場シェア分析、業界動向と統計、成長予測(2026年~2031年) |
|
出版日: 2026年02月09日
発行: Mordor Intelligence
ページ情報: 英文 152 Pages
納期: 2~3営業日
|

概要
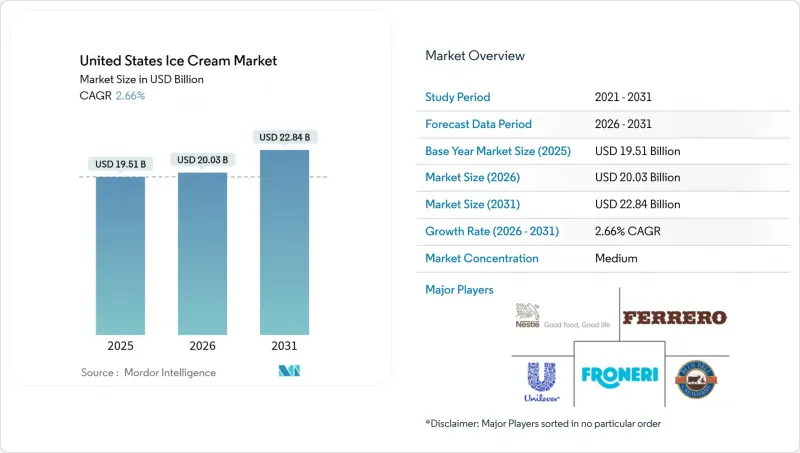
米国のアイスクリーム市場は、2025年に195億1,000万米ドルと評価され、2026年の200億3,000万米ドルから2031年までに228億4,000万米ドルに達すると予測されています。
予測期間(2026年~2031年)におけるCAGRは2.66%と見込まれています。
この成長は、成熟しつつも回復力のある市場を浮き彫りにしており、全体的な販売数量が安定しているにもかかわらず、プレミアム化が引き続き価値成長を牽引しています。市場は、確立された消費習慣の恩恵を受けており、国内の充実したコールドチェーンインフラと豊富な国内乳製品供給に支えられ、これら全体が安定した基盤需要を確保しています。さらに、プレミアムな職人製アイスクリームの人気の高まり、変化する消費者嗜好に対応した植物由来製品の拡大、技術を活用した流通チャネルの導入が新たな収益機会を創出しています。これらの要因が相まって市場の勢いを維持し、長期的な成長可能性に寄与しています。一方、21 CFR 135.110に基づく規制監視や、乳製品・砂糖の継続的な原料コスト変動は、バリューチェーン全体における戦略的意思決定に影響を与え続けています。
米国のアイスクリーム市場の動向と洞察
プレミアムおよび職人のアイスクリームに対する需要の拡大
プレミアムおよび職人技のアイスクリームに対する需要の高まりは、米国の高い消費水準に支えられ、米国のアイスクリーム市場の重要な推進力となっております。国際乳製品協会(IDFA)によれば、2024年に米国のアイスクリーム生産量は驚異的な13億1,000万ガロンに達し、平均的なアメリカ人は年間約19ポンド(約4ガロン)のアイスクリームを消費しております。この持続的なアイスクリームへの熱意は、高品質で贅沢な味わい、そしてユニークな風味体験を求める消費者の嗜好によってますます形作られています。買い物客は、天然素材を使用し、最小限の加工を施し、職人技と本物志向を重視した革新的なレシピで作られた製品に対して、プレミアム価格を支払う意思があります。地元産の乳製品、小ロット生産、創造的なフレーバーを特徴とする職人的ブランドが人気を集める一方、主要メーカーはこの高まる需要を捉えるため、プレミアム製品のラインアップを拡大しています。
エキゾチックでユニークなフレーバーの革新
エキゾチックでユニークなフレーバーの革新は、米国のアイスクリーム市場の主要な推進力です。消費者はデザート選びにおいて斬新さとパーソナライズをますます求める一方で、定番フレーバーへの強い忠誠心も示しています。国際乳製品協会(IDFA)の調査によると、バニラ、チョコレート、ストロベリー、バターペカンは依然として国内で最も好まれるフレーバーの上位を占めています。同時に、調査では多様なトッピングの嗜好が明らかになっており、消費者の35%がホットファッジ、29%がホイップクリーム、24%がキャラメルソースを好んでいます。この伝統と革新のバランスが市場成長を促進しており、各ブランドは抹茶、味噌キャラメル、紫芋、甘辛組み合わせなど、世界各国の味にインスピレーションを得たフレーバーを実験的に展開し、冒険的な味覚を持つ消費者層の満足を図っています。メーカー各社はまた、消費者エンゲージメントとブランドロイヤルティを高める限定商品や季節商品の開発に研究開発投資を行っています。創造的な味覚体験への取り組みは、競争の激しい市場で製品を差別化するだけでなく、小売・外食産業の両チャネルにおけるプレミアムポジショニングとリピート購入を支えています。
糖分と飽和脂肪含有量に関する健康懸念
砂糖や飽和脂肪酸含有量に関する健康上の懸念は、米国のアイスクリーム市場の主要な抑制要因となっています。消費者が従来型アイスクリームの栄養的影響をますます認識する中で、この健康課題の規模は甚大です。国際糖尿病連合の報告によれば、2024年時点で米国の成人の13.7%が糖尿病の影響を受けており、これは約3,853万6,400件に相当します。肥満、糖尿病、心血管疾患の増加傾向により、多くのアメリカ人が高カロリー・高糖分・高脂肪食品の摂取削減を志向しており、従来型アイスクリームの消費を制限または代替する動きも生じています。栄養表示への規制強化や公衆衛生キャンペーンがこうした行動変容をさらに後押しし、メーカーにはより健康的な原材料を用いた製品改良が求められています。嗜好性は依然として主要な購買動機ではありますが、アイスクリームを日常的なデザートではなく時折の楽しみと捉える傾向が市場成長の課題となり続けており、特に健康志向の層における食事管理の改善を求める動きが顕著です。
セグメント分析
衝動買い向けアイスクリームは、2025年においても米国市場で圧倒的な42.12%のシェアを占め、引き続き主導的な地位を維持しております。その好調な業績は、スーパーマーケットからコンビニエンスストアに至る小売チャネルでの広範な流通網により、消費者の高い入手可能性が確保されていることに起因します。また、計画的な購入と衝動買いの両方を捉える、外出先での消費習慣との適合性も、このセグメントの成功を支える要因となっております。主要ブランドは、プロモーション提携や季節限定フレーバーの投入により、消費者の関心を維持する戦略的な商品展開を行っています。さらに、単品包装形式や小規模小売店における冷凍庫設置の拡大が、市場浸透を強化しています。この広範な流通網と利便性を重視した訴求力が、入手しやすさ、手頃な価格、品揃えの多様性を効果的に組み合わせる能力を反映し、衝動買い向けアイスクリームの市場リーダーとしての地位を確固たるものにしています。
一方、職人の技を活かしたアイスクリーム分野は、市場全体を大きく上回る3.34%という驚異的なCAGRを記録し、最も成長が著しいカテゴリーとなっています。この成長は、職人技と本物の素材を重視したプレミアムな少量生産製品への消費者の嗜好の高まりに支えられています。職人の技を活かしたブランドは、地元産の乳製品、手作りの製法、独自のフレーバー開発といったストーリー性を活用し、大量生産品との差別化を図っています。「意識的な贅沢」という動向-豊かな味わいとクリーンラベル・天然素材のバランスを重視する傾向-が、ニッチながらも急速に拡大する消費者層をさらに惹きつけています。この分野におけるプレミアム価格設定は需要を阻害せず、むしろ消費者が品質と希少性に対してより高い価格を支払う意思があることを裏付けています。その結果、職人的セグメントは競合情勢を再構築し続け、米国のアイスクリーム市場における多様化と価値認識の向上を牽引しています。
その他の特典:
- エクセル形式の市場予測(ME)シート
- アナリストによる3ヶ月間のサポート
よくあるご質問
目次
第1章 イントロダクション
- 調査の前提条件と市場の定義
- 調査範囲
第2章 調査手法
第3章 エグゼクティブサマリー
第4章 市場情勢
- 市場概要
- 市場促進要因
- プレミアムおよび職人技によるアイスクリームへの需要の増加
- エキゾチックでユニークなフレーバーにおけるイノベーション
- より健康的な、低糖質、乳製品不使用の選択肢の拡大
- デジタルチャネル及びインフルエンサーを活用した効果的なマーケティング
- 植物由来およびビーガン向けアイスクリーム代替品の急増
- 環境に配慮した持続可能な包装への関心の高まり
- 市場抑制要因
- 糖分および飽和脂肪含有量に関する健康上の懸念
- 代替冷凍デザートおよびスナックとの競合
- 乳製品や砂糖などの主要原材料の価格変動性
- 季節的な需要変動が販売の安定性に影響を与える
- 価値/サプライチェーン分析
- 規制情勢
- テクノロジーの展望
- ポーターのファイブフォース
- 買い手・消費者の交渉力
- 供給企業の交渉力
- 新規参入業者の脅威
- 代替品の脅威
- 競争企業間の敵対関係
第5章 市場規模と成長予測(金額ベースおよび数量ベース)
- 製品タイプ別
- アルチザンアイスクリーム
- インパルスアイスクリーム
- 持ち帰り用アイスクリーム
- カテゴリー別
- 乳製品
- 非乳製品(植物由来)
- 流通チャネル
- オントレード
- オフトレード
- スーパーマーケット/ハイパーマーケット
- 専門店
- コンビニエンスストア
- オンライン小売店
- その他流通チャネル
第6章 競合情勢
- 市場集中度
- 戦略的動向
- 市場シェア分析
- 企業プロファイル
- Unilever PLC
- Ferrero International SpA
- Froneri International Ltd.
- Nestle S.A
- Blue Bell Creameries LP
- Turkey Hill Dairy
- Tillamook County Creamery Association
- Dairy Farmers of America Inc.
- Focus Brands LLC
- Van Leeuwen Ice Cream
- Gifford's Dairy Inc.
- Jeni's Splendid Ice Creams
- Van Leeuwen Ice Cream
- Giffords Dairy Inc.
- Alden's Organic Ice Cream
- Clover Sonoma
- Straus Family Creamery
- Stewart's Shops
- Braum's Ice Cream
- Perry's Ice Cream
