
北米の非乳製品アイスクリーム:市場シェア分析、産業動向、成長予測(2025年~2030年)
North America Non-dairy Ice Cream - Market Share Analysis, Industry Trends & Statistics, Growth Forecasts (2025 - 2030)- 発行日
- ページ情報
- 英文 161 Pages
- 納期
- 2~3営業日
- 商品コード
- 1683837
- カスタマイズ可能 お客様のご希望に応じて、既存データの加工や未掲載情報(例:国別セグメント)の追加などの対応が可能です。詳細はお問い合わせください。
- 適宜更新あり 本レポートは最新情報反映のため適宜更新し、内容構成変更を行う場合があります。ご検討の際はお問い合わせください。
- 翻訳ツール提供対象 PDF対応AI翻訳ツールの無料貸し出しサービスのご利用が可能です
概要
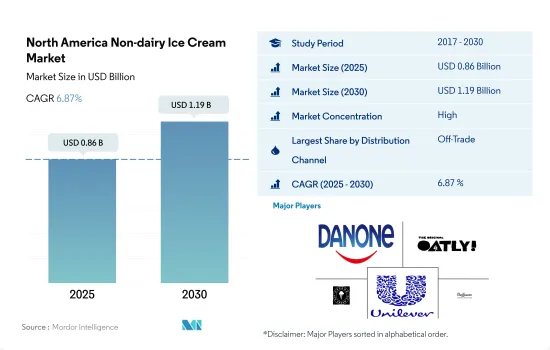
北米の非乳製品アイスクリーム市場規模は2025年に8億6,000万米ドルと推定・予測され、2030年には11億9,000万米ドルに達し、予測期間(2025年~2030年)のCAGRは6.87%で成長すると予測されます。
外食・小売部門を通じた非乳製品アイスクリームの着実な売上増加が成長を後押ししています。
- 2020年、消費者は小売食料品店(off-trade)を通じてより多くの植物性アイスクリームを購入し、17%増加しました。非乳製品アイスクリーム市場は2020年以降、着実な成長を示しています。これは、近年の持続的な増加を示しており、店舗やオンライン・プラットフォームにおけるブランドにとって非常に大きなチャンスがあることを示しています。
- しかし、この地域はオン・トレード・チャネルが未発達であり、かなりの市場規模を有していないです。消費者は自宅で植物性乳製品を食べ、レストランやフードサービス店で食べることはあまりないです。代用乳を含む食事やスナックの約93%は家庭で消費され、7%はレストランや食品サービス店で消費されます。植物性食品は、広範なラインの流通業者が業務用および非業務用の食品サービス店向けに出荷する全食品の1%未満です。
- オンライン・チャネルは、オフ・トレード・セグメントで最も急成長する流通チャネルになると予想されます。2023~2025年には金額ベースで前年比28%の成長を記録すると予測されます。より多くの食料品をオンラインで購入するようになった買い物客の61.1%にとって、利便性が主な動機となっています。この成長は、2020年から2021年の間に1,100万人増加したスマートフォンユーザーの増加によるものです。人口の約45%がモバイル機器を通じてオンラインサイトを閲覧しています。
北米人口の低脂肪製品への傾斜
- 2022年、北米の非乳製品アイスクリーム市場は6.46%の成長を記録しました。この成長は、北米人口の健康意識の高まりによるものです。消費者が非乳製品アイスクリームを好むのは、脂肪率が動物性ミルクベースのアイスクリームよりも比較的低いからです。ココナッツミルクの脂肪率は、動物性ミルクよりもかなり低いです。動物性ミルクは60キロカロリーであるのに対し、無糖ココナッツミルクは1カップで約39キロカロリーです。ココナッツミルクは脂肪分が少ないので、肥満のリスクを軽減するのに役立ちます。北米における非乳製品アイスクリームの消費量は、2025年に17.43%成長すると推定されます。
- ビーガン製品メーカー上位19社のうち、上位6社は米国に設立されています。その結果、米国が北米の非乳製品アイスクリーム市場を独占し、2022年には94.4%のシェアを占め、次いでカナダが4.77%のシェアを占めています。
- 2022年には、スーパーマーケットとハイパーマーケットがこの地域の小売業を支配しており、これらの小売業者が82.2%のシェアを占めています。コンビニエンスストアは同年の市場シェア10.6%で2位でした。これらの小売業者には、Walmart、Target、Kroger、Amazon、Costco Wholesale Corporation、Albertsons Companies Inc.、Ahold Delhaize USA、Publix Super Markets Inc.などがあります。
- 小売部門では、植物乳ベースのアイスクリームをさまざまな価格帯(低価格、中価格、高価格)で提供し、消費者の関心を集めています。非乳製品アイスクリームの基本販売価格は4.84米ドルから100米ドルです。様々な価格で非乳製品アイスクリームを入手できることも、消費者の購買力を加速させています。
北米の非乳製品アイスクリーム市場動向
肥満の影響に関する意識の高まりが、北米の非乳製品アイスクリーム市場を大きく牽引しています。
- フレキシタリアン、乳糖不耐症、厳格菜食主義者の増加により、非乳製品アイスクリームは消費者の間で人気を集めています。2022年、米国の非乳製品アイスクリーム市場は2021年と比較して14.2%の成長を示しました。この成長は、肥満の結果に対する意識の高まりによるものです。したがって、無脂肪または低脂肪食品の嗜好と消費が大幅に増加しました。同地域では2020年にも肥満率の増加が観察されました。カナダでは、2020年の成人の肥満率は女性よりも男性の方が高かった(それぞれ28.0%対24.7%)。
- 植物性乳の脂肪率は動物性乳より比較的低いです。植物性ミルクのひとつであるココナッツミルクは、動物性ミルクよりも脂肪分がかなり少なく、無糖のココナッツミルク1カップ(8オンス、240mL)で39キロカロリーです。無糖のヘンプミルク(水と麻の実から作られる)は、1カップで約60キロカロリーです。
- この地域では、乳糖不耐症の人口も増加しています。2022年、米国では成人白人の15%、アフリカ系アメリカ人の85%が乳糖不耐症でした。消費者は、対応する病気の結果を避けるためにベジタリアン食に変更することさえあります。2022年1月には、18歳以上のアメリカ人の10%が自分自身を乳糖不耐症だと考えていました。
- 北米地域では、非乳製品アイスクリームはさまざまな価格で販売されており、消費者の値ごろ感を促進しています。米国では、植物性アイスクリームは2.14米ドルから70.5米ドル以上で販売されています。非乳製品アイスクリームには、バニラやチョコレートなどのさまざまなフレーバーもあります。
北米の非乳製品アイスクリーム産業概要
北米の非乳製品アイスクリーム市場はかなり統合されており、上位5社で86.87%を占めています。この市場の主要企業は以下の通り。 Danone SA, Oatly Group AB, Oregon Ice Cream Company, Unilever Plc and Van Leeuwen Ice Cream(sorted alphabetically).
その他の特典
- エクセル形式の市場予測(ME)シート
- 3ヶ月のアナリストサポート
目次
第1章 エグゼクティブサマリーと主な調査結果
第2章 レポートのオファー
第3章 イントロダクション
- 調査の前提条件と市場定義
- 調査範囲
- 調査手法
第4章 主要産業動向
- 一人当たり消費量
- 原材料/商品生産
- 代替乳製品-原材料生産
- 規制の枠組み
- カナダ
- メキシコ
- 米国
- バリューチェーンと流通チャネル分析
第5章 市場セグメンテーション
- 流通チャネル
- オフトレード
- サブ流通チャネル別
- コンビニエンスストア
- オンライン小売
- 専門店
- スーパーマーケットとハイパーマーケット
- その他(倉庫クラブ、ガソリンスタンドなど)
- オフトレード
- 国名
- カナダ
- メキシコ
- 米国
第6章 競合情勢
- 主要な戦略動向
- 市場シェア分析
- 企業情勢
- 企業プロファイル(世界レベルの概要、市場レベルの概要、主要事業セグメント、財務、従業員数、主要情報、市場ランク、市場シェア、製品・サービス、最近の動向分析を含む)
- Arctic Zero Cssc Inc.
- Bliss Unlimited LLC-Cosmic Bliss
- Danone SA
- NadaMoo
- Noona's Ice Cream LLC
- Oatly Group AB
- Oregon Ice Cream Company
- The Booja Booja Company Limited
- Tofutti Brands Inc.
- Unilever Plc
- Van Leeuwen Ice Cream
第7章 CEOへの主な戦略的質問
第8章 付録
- 世界の概要
- 概要
- ファイブフォース分析フレームワーク
- 世界・バリューチェーン分析
- 市場力学(DROs)
- 情報源と参考文献
- 図表一覧
- 主要洞察
- データパック
- 用語集
目次
The North America Non-dairy Ice Cream Market size is estimated at 0.86 billion USD in 2025, and is expected to reach 1.19 billion USD by 2030, growing at a CAGR of 6.87% during the forecast period (2025-2030).
The steady increase in sales of non-dairy ice cream through food service and retail sector is fueling the growth
- In 2020, consumers purchased more plant-based ice creams through retail groceries (off-trade), with an increase of 17%. The non-dairy ice cream market has been showing steady growth since 2020. This illustrates a sustained increase over recent years and demonstrates the incredible opportunities available for brands in stores and online platforms.
- However, the region does not have a considerable market for the on-trade channel, which is underdeveloped. Consumers eat plant-based dairy at home and are less likely to eat from a restaurant or foodservice outlet. Around 93% of meals or snacks that include milk alternatives are consumed at home, and 7% are consumed at a restaurant or foodservice outlet. Plant-based foods represent less than 1% of all foods shipped by broad-line distributors to commercial and non-commercial foodservice outlets.
- The online channel is expected to be the fastest-growing distribution channel in the off-trade segment. It is projected to register a Y-o-Y growth of 28%, by value, during 2023-2025. Convenience is the primary motivation for 61.1% of shoppers who have transitioned to shopping for more groceries online. This growth is due to the increasing number of smartphone users, which increased by 11 million between 2020 and 2021. Around 45% of the population browses online websites through mobile devices.
Inclination towards low fat products among the North America population
- In 2022, the North American non-dairy ice cream market witnessed a growth of 6.46%. The growth was attributed to the rising health consciousness among the North American population. Consumers prefer non-dairy ice creams since their fat percentage is comparatively lower than that of animal-milk-based ice creams. The fat percentage in coconut milk is significantly lesser than in animal-based milk. Animal milk provides 60 calories, whereas unsweetened coconut milk provides about 39 calories in a one-cup serving. Since coconut milk has less fat content, it helps mitigate the risk of obesity rate. The consumption volume of non-dairy ice creams in North America is estimated to grow by 17.43% in 2025.
- Out of the top 19 vegan product producers, the top six manufacturers are established in the United States. As a result, the United States dominates the North American non-dairy ice cream market, and it held a share of 94.4% in 2022, followed by Canada, which held a share of 4.77%.
- In 2022, supermarkets and hypermarkets dominated the retailing landscape in the region, as these retailers held a volume of 82.2%. Convenience stores came in second with 10.6% of the market share the same year. Some of these retailers are Walmart, Target, Kroger, Amazon, Costco Wholesale Corporation, Albertsons Companies Inc., Ahold Delhaize USA, and Publix Super Markets Inc.
- The retailing segment offers plant-milk-based ice creams at varied price ranges (low, medium, and high) to captivate consumers' attention. The base selling price of non-dairy ice cream is USD 4.84 to as high as USD 100. The availability of non-dairy ice creams at various prices also accelerates the buying power of consumers.
North America Non-dairy Ice Cream Market Trends
The rising awareness regarding the consequences of obesity is largely driving the North American non-dairy ice cream market.
- Non-dairy ice creams are gaining popularity among consumers because of the rise in the flexitarian, lactose intolerant, or strict vegan populations. In 2022, the US non-dairy ice cream market witnessed a growth of 14.2% compared to 2021. The growth was attributed to the rising awareness about the consequences of obesity. Hence, their preference and consumption of non-fat or less-fat food products significantly increased. The region also observed a growth in its obesity percentage in 2020. In Canada, obesity rates in Canadian adults were higher in men than women (28.0% versus 24.7%, respectively) in 2020.
- The fat percentage in plant-based milk is comparatively lower than in animal-based milk. One plant-based milk, coconut milk, has fat content significantly lesser than animal-based milk, as one cup (8 oz or 240 mL) of unsweetened coconut milk provides 39 calories. Unsweetened hemp milk (made from water and hulled hemp seed) provides about 60 calories in a one-cup serving.
- The region has also witnessed a growth in the volume of lactose-intolerant population. In 2022, in the United States, 15% of adult Caucasians and 85% of African Americans were lactose intolerant. Consumers are even changing to a vegetarian diet to avoid the consequences of the corresponding disease. In January 2022, 10% of Americans over the age of 18 considered themselves to be lactose intolerant.
- In the North American region, non-dairy ice creams are available at different prices, promoting the affordability factor for consumers. In the United States, plant-based ice creams are available from USD 2.14 to over USD 70.5. Non-dairy ice creams are also available in different flavors, including vanilla and chocolate.
North America Non-dairy Ice Cream Industry Overview
The North America Non-dairy Ice Cream Market is fairly consolidated, with the top five companies occupying 86.87%. The major players in this market are Danone SA, Oatly Group AB, Oregon Ice Cream Company, Unilever Plc and Van Leeuwen Ice Cream (sorted alphabetically).
Additional Benefits:
- The market estimate (ME) sheet in Excel format
- 3 months of analyst support
TABLE OF CONTENTS
1 EXECUTIVE SUMMARY & KEY FINDINGS
2 REPORT OFFERS
3 INTRODUCTION
- 3.1 Study Assumptions & Market Definition
- 3.2 Scope of the Study
- 3.3 Research Methodology
4 KEY INDUSTRY TRENDS
- 4.1 Per Capita Consumption
- 4.2 Raw Material/commodity Production
- 4.2.1 Dairy Alternative - Raw Material Production
- 4.3 Regulatory Framework
- 4.3.1 Canada
- 4.3.2 Mexico
- 4.3.3 United States
- 4.4 Value Chain & Distribution Channel Analysis
5 MARKET SEGMENTATION (includes market size in Value in USD and Volume, Forecasts up to 2030 and analysis of growth prospects)
- 5.1 Distribution Channel
- 5.1.1 Off-Trade
- 5.1.1.1 By Sub Distribution Channels
- 5.1.1.1.1 Convenience Stores
- 5.1.1.1.2 Online Retail
- 5.1.1.1.3 Specialist Retailers
- 5.1.1.1.4 Supermarkets and Hypermarkets
- 5.1.1.1.5 Others (Warehouse clubs, gas stations, etc.)
- 5.1.1 Off-Trade
- 5.2 Country
- 5.2.1 Canada
- 5.2.2 Mexico
- 5.2.3 United States
6 COMPETITIVE LANDSCAPE
- 6.1 Key Strategic Moves
- 6.2 Market Share Analysis
- 6.3 Company Landscape
- 6.4 Company Profiles (includes Global Level Overview, Market Level Overview, Core Business Segments, Financials, Headcount, Key Information, Market Rank, Market Share, Products and Services, and Analysis of Recent Developments).
- 6.4.1 Arctic Zero Cssc Inc.
- 6.4.2 Bliss Unlimited LLC - Cosmic Bliss
- 6.4.3 Danone SA
- 6.4.4 NadaMoo
- 6.4.5 Noona's Ice Cream LLC
- 6.4.6 Oatly Group AB
- 6.4.7 Oregon Ice Cream Company
- 6.4.8 The Booja Booja Company Limited
- 6.4.9 Tofutti Brands Inc.
- 6.4.10 Unilever Plc
- 6.4.11 Van Leeuwen Ice Cream
7 KEY STRATEGIC QUESTIONS FOR DAIRY AND DAIRY ALTERNATIVE CEOS
8 APPENDIX
- 8.1 Global Overview
- 8.1.1 Overview
- 8.1.2 Porter's Five Forces Framework
- 8.1.3 Global Value Chain Analysis
- 8.1.4 Market Dynamics (DROs)
- 8.2 Sources & References
- 8.3 List of Tables & Figures
- 8.4 Primary Insights
- 8.5 Data Pack
- 8.6 Glossary of Terms
- 発行日
- 発行
- Mordor Intelligence
- ページ情報
- 英文 161 Pages
- 納期
- 2~3営業日