
|
市場調査レポート
商品コード
1687737
北米のプロテインバー:市場シェア分析、産業動向、成長予測(2025~2030年)North America Protein Bar - Market Share Analysis, Industry Trends & Statistics, Growth Forecasts (2025 - 2030) |
||||||
カスタマイズ可能
適宜更新あり
|
|||||||
| 北米のプロテインバー:市場シェア分析、産業動向、成長予測(2025~2030年) |
|
出版日: 2025年03月18日
発行: Mordor Intelligence
ページ情報: 英文 166 Pages
納期: 2~3営業日
|

全表示
- 概要
- 目次
概要
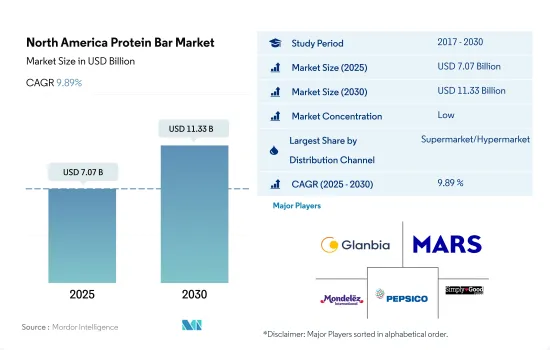
北米のプロテインバー市場規模は2025年に70億7,000万米ドルと推定・予測され、2030年には113億3,000万米ドルに達し、予測期間(2025~2030年)のCAGRは9.89%で成長すると予測されます。
スーパーマーケット/ハイパーマーケットは、さまざまなブランドを幅広く利用できることから市場をリードし、2023~2024年には前年比7.50%の成長が見込まれます。
- スーパーマーケットとハイパーマーケットは、この地域におけるプロテインバーの主要流通チャネルです。スーパーマーケットとハイパーマーケットを通じた販売は、2023~2030年にかけてCAGR 6.86%を記録すると予測されています。消費者は主にスーパーマーケットやハイパーマーケットでプロテインバーを購入することを好みます。
- コンビニエンスストアは、スーパーマーケット、ハイパーマーケットに次いで、この地域でプロテインバーの購入に広く好まれている流通チャネルです。2023年、コンビニエンスストアの販売額は前年の2022年と比べて7.32%増加しました。コンビニエンスストアは、他の小売チャネルよりも消費者に選ばれています。
- クリフのような主要ブランドは様々なタイプのプロテインバーを提供しており、コンビニエンスストアチャネルを通じた代替スナックの販売においてカテゴリーリーダーであり、ACV(全商品数量)は80.7%、2022年の売上高は前年比で13%近く増加しました。また、2021年には、コンビニエンスストアチェーンのクイックトリップが米国11州の850以上の店舗でベアベルズのプロテインバーを追加しました。
- オンラインチャネルは、プロテインバーの販売で最も急成長している小売チャネルになると予想されます。このセグメントによるプロテインバーの販売額は、2022年と比較して2025年には26.51%成長すると予測されています。プロテインバー購入におけるオンラインチャネルの役割の進化は、インターネットユーザーの増加に影響されています。2022年には、この地域の人口の93.4%がインターネットにアクセスしています。この地域の国々の中で、インターネット利用者のシェアが最も高かったのはカナダ(96.5%)と米国(92%)でした。
米国の消費者の3人に2人は、よりカロリーコントロールされ、免疫に優しい成分を含むプロテインバーを求めており、同国は95%のシェアで北米市場をリードしています。
- 北米のプロテインバー市場は、2023年には2022年と比較して金額ベースで7.9%の成長が見られました。この成長は主に、より良い健康に対する消費者の意識の高まりによるものです。プロテインバーは、かなりの量のタンパク質(10~20グラム)、ビタミンB、150~200カロリーを提供するため、北米の人々の間でフィットネス愛好家に非常に好まれています。
- 北米諸国の中で、米国はプロテインバーの消費量において最大の国であると考えられており、この国の消費者は健康を維持するために運動、アウトドアゲーム、その他のアドベンチャースポーツを主に取り入れています。2023年、米国では6,419万人がジムやヘルスクラブの会員でした。健康に対する意識が高まるにつれ、消費者は低脂肪製品やオイルフリー製品などを好むようになっています。この側面が、北米地域のプロテインバー市場に消費者密度を大きくシフトさせています。
- 2023年には、カナダのプロテインバー市場がCAGR 3.21%で最も急成長するセグメントと予測されました。これは、スナックバー市場に対する消費者の行動の変化によるものです。カナダでは、消費者は主にプロテインバーをレディトゥイートミールとして利用していました。加えて、プロテインバーの製造業者はさまざまな価格帯(低価格、中価格、高価格)で製品を提供しており、これが売上をさらに押し上げています。2023年のスナックバーの平均販売価格は1.33米ドルでした。
- 予測期間(2024~2030年)には、消費者の健康増進に対する需要の高まりにより、この産業は6.61%成長すると想定されます。また、プロテインバーの生産者は、革新的なフレーバーやユニークな包装を導入し、消費者ベースを拡大すると予想されます。
北米のプロテインバー市場動向
フィットネス愛好者の増加は、米国における市場成長の主要因の一つです。
- 北米では、プロテインバーは油を使ったスナック菓子の代替品としてZ世代の消費者に非常に好まれています。2023年、米国人はスナックバーを手づかみで食べられる便利な食品として消費しています。米国人口の約59%は、これらを健康的な製品とみなしています。
- プロテインバーセグメントでは、ブランドロイヤルティが製品属性の第1位を占めています。北米では、43%の消費者が好きなブランドのプロテインバーを選んでいます。Crunch Plus、Nature Valley、One、ProBar、MxBarなどが市場で高いシェアを持つブランドです。
- 2023年には、プロテインバーの売上が増加しました。売上の伸びは消費者の健康的な食習慣と関連しています。COVID-19パンデミックのような経済危機は、スナックバーの利点を強調し、油っこいスナックを健康的なスナックバーに置き換えることによって、スナックバーの販売を促進しました。2023年には、スナックバー製品は前年比2.34米ドルの成長を記録しました。
- 米国では、プロテインバーの消費は一般的に健康の観点から見られています。様々なフレーバーのプロテインバーが入手可能なため、様々な年齢層で健康的なスナックとして楽しまれています。米国では、プロテインバーの消費に関して、健康の観点から考慮すべき追加要因がいくつかあります。
北米のプロテインバー産業概要
北米のプロテインバー市場は細分化されており、上位5社で33.01%を占めています。この市場の主要企業は、Glanbia PLC、Mars Incorporated、Mondelez International Inc.、PepsiCo Inc.、Simply Good Foods Co.などです。
その他の特典
- エクセル形式の市場予測(ME)シート
- 3ヶ月のアナリストサポート
目次
第1章 エグゼクティブサマリーと主要調査結果
第2章 レポートのオファー
第3章 イントロダクション
- 調査の前提条件と市場定義
- 調査範囲
- 調査手法
第4章 主要産業動向
- 規制の枠組み
- 消費者の購買行動
- 成分分析
- バリューチェーンと流通チャネル分析
第5章 市場セグメンテーション
- 流通チャネル
- コンビニエンスストア
- オンラインストア
- スーパーマーケット/ハイパーマーケット
- その他
- 国名
- カナダ
- メキシコ
- 米国
- その他の北米地域
第6章 競争情勢
- 主要な戦略動向
- 市場シェア分析
- 企業情勢
- 企業プロファイル
- 1440 Foods Company
- General Mills Inc.
- Glanbia PLC
- Go Macro LLC
- Jamieson Wellness Inc.
- Kellogg Company
- Mars Incorporated
- Mondelez International Inc.
- No Cow LLC
- PepsiCo Inc.
- Pervine Foods LLC
- Power Crunch Pty Ltd
- Simply Good Foods Co.
- The Hershey Company
- Vorlo Inc.
第7章 CEOへの主要戦略的質問
第8章 付録
- 世界概要
- 概要
- ファイブフォース分析フレームワーク
- 世界のバリューチェーン分析
- 市場力学(DROs)
- 情報源と参考文献
- 図表一覧
- 主要洞察
- データパック
- 用語集
目次
Product Code: 64781
The North America Protein Bar Market size is estimated at 7.07 billion USD in 2025, and is expected to reach 11.33 billion USD by 2030, growing at a CAGR of 9.89% during the forecast period (2025-2030).
Supermarkets/hypermarkets led the market due to the wide availability of different brands, expected to register a Y-o-Y growth of 7.50% over 2023-2024
- Supermarkets and hypermarkets are the leading distribution channels for protein bars in the region. Sales through supermarkets and hypermarkets are anticipated to record a CAGR of 6.86% from 2023 to 2030. Consumers prefer buying protein bars, mainly from supermarkets and hypermarkets, as they get discount coupons for bulk shopping in supermarkets.
- Convenience stores are the second most widely preferred distribution channel after supermarkets and hypermarkets for purchasing protein bars in the region. In 2023, the sales value of convenience stores increased by 7.32% compared to the previous year, 2022. The broader reach and easy access to private-label brands drive consumer preference for convenience stores over other retail channels.
- Major brands like Clif provide various types of protein bars and are a category leader in the sales of alternative snacks through the convenience stores channel, with an ACV (all commodity volume) of 80.7% and a nearly 13% increase in sales in 2022 compared to the previous year. Also, in 2021, the QuikTrip convenience store chain added Barebells protein bars in its more than 850 stores in 11 states across the United States.
- The online channel is expected to be the fastest-growing retail channel for protein bar sales. The sales value of protein bars through this segment is anticipated to grow by 26.51% in 2025 compared to 2022. The evolving role of online channels in protein bar purchases is influenced by the increasing number of internet users. In 2022, 93.4% of the population in the region accessed the internet. Among regional countries, the highest shares of internet users were recorded in Canada (96.5%) and the United States (92%).
With two in three US consumers seeking protein bars that are more calorie-controlled and have immune-friendly ingredients, the country leads the North American market with a 95% share
- The protein bar market in North America witnessed a growth of 7.9% by value in 2023 compared to 2022. The growth is mainly attributed to the rising awareness of consumers regarding better health. Since protein bars provide a significant volume of protein (10-20 grams), vitamin B, and 150-200 calories, they are highly preferred by fitness enthusiasts among the North American population.
- Among North American countries, the United States is considered the largest country in terms of the consumption of protein bars, as consumers here are majorly adopting exercise, outdoor games, and other adventure sports to maintain good health. In 2023, 64.19 million people in the United States were members of a gym or health club. With the growing awareness about good health, consumers are increasingly preferring the consumption of low-fat products, oil-free products, etc. This aspect has majorly shifted consumer density toward the protein bar market in the North American region.
- In 2023, the Canadian protein bar market was projected to be the fastest-growing segment, with a CAGR of 3.21%. This was due to the changing behavior of consumers toward the snack bar market. In Canada, consumers were mainly using protein bars as a ready-to-go meal. In addition, protein bar producers are offering their products in varied price ranges (low, medium, and high), which is further driving sales. The average selling price of a snack bar was USD 1.33 in 2023.
- During the forecast period (2024-2030), it is assumed that this industry is expected to grow by 6.61% due to the rising demand for better health among consumers. It is also expected that the producers of protein bars will introduce innovative flavors and unique packaging to expand their consumer base.
North America Protein Bar Market Trends
The increasing number of fitness enthusiasts remains one of the major factors for the market's growth in the United States
- In North America, protein bars are highly preferred among Gen Z consumers as a replacement for oil-based snacks. In 2023, Americans consumed snack bars as a grab-and-go convenience food product. About 59% of the US population considers these to be healthy products.
- In the protein bar segment, brand loyalty acquires the first position under product attributes. In North America, it was observed that 43% of consumers choose protein bars of their favorite brands. Crunch Plus, Nature Valley, One, ProBar, and MxBar are some brands that hold higher shares in the market.
- In 2023, protein bars witnessed a hike in their sales. The sales growth was linked to the healthy eating habits of consumers. Economic crises such as the COVID-19 pandemic promoted the sales of snack bars by highlighting their benefits and replacing oily snacks with healthy snack bars. In 2023, snack bar products recorded a Y-o-Y growth of USD 2.34.
- In the United States, the consumption of protein bars is generally viewed from a health perspective. With the availability of protein bars in different flavors, they are enjoyed as a healthy snack among different age groups. In the United States, there are a few additional factors to consider from a health perspective in the context of protein bar consumption.
North America Protein Bar Industry Overview
The North America Protein Bar Market is fragmented, with the top five companies occupying 33.01%. The major players in this market are Glanbia PLC, Mars Incorporated, Mondelez International Inc., PepsiCo Inc. and Simply Good Foods Co. (sorted alphabetically).
Additional Benefits:
- The market estimate (ME) sheet in Excel format
- 3 months of analyst support
TABLE OF CONTENTS
1 EXECUTIVE SUMMARY & KEY FINDINGS
2 REPORT OFFERS
3 INTRODUCTION
- 3.1 Study Assumptions & Market Definition
- 3.2 Scope of the Study
- 3.3 Research Methodology
4 KEY INDUSTRY TRENDS
- 4.1 Regulatory Framework
- 4.2 Consumer Buying Behavior
- 4.3 Ingredient Analysis
- 4.4 Value Chain & Distribution Channel Analysis
5 MARKET SEGMENTATION (includes market size in Value in USD and Volume, Forecasts up to 2030 and analysis of growth prospects)
- 5.1 Distribution Channel
- 5.1.1 Convenience Store
- 5.1.2 Online Retail Store
- 5.1.3 Supermarket/Hypermarket
- 5.1.4 Others
- 5.2 Country
- 5.2.1 Canada
- 5.2.2 Mexico
- 5.2.3 United States
- 5.2.4 Rest of North America
6 COMPETITIVE LANDSCAPE
- 6.1 Key Strategic Moves
- 6.2 Market Share Analysis
- 6.3 Company Landscape
- 6.4 Company Profiles
- 6.4.1 1440 Foods Company
- 6.4.2 General Mills Inc.
- 6.4.3 Glanbia PLC
- 6.4.4 Go Macro LLC
- 6.4.5 Jamieson Wellness Inc.
- 6.4.6 Kellogg Company
- 6.4.7 Mars Incorporated
- 6.4.8 Mondelez International Inc.
- 6.4.9 No Cow LLC
- 6.4.10 PepsiCo Inc.
- 6.4.11 Pervine Foods LLC
- 6.4.12 Power Crunch Pty Ltd
- 6.4.13 Simply Good Foods Co.
- 6.4.14 The Hershey Company
- 6.4.15 Vorlo Inc.
7 KEY STRATEGIC QUESTIONS FOR CONFECTIONERY CEOS
8 APPENDIX
- 8.1 Global Overview
- 8.1.1 Overview
- 8.1.2 Porter's Five Forces Framework
- 8.1.3 Global Value Chain Analysis
- 8.1.4 Market Dynamics (DROs)
- 8.2 Sources & References
- 8.3 List of Tables & Figures
- 8.4 Primary Insights
- 8.5 Data Pack
- 8.6 Glossary of Terms
