
|
市場調査レポート
商品コード
1907001
プロテインバー:市場シェア分析、業界動向と統計、成長予測(2026年~2031年)Protein Bar - Market Share Analysis, Industry Trends & Statistics, Growth Forecasts (2026 - 2031) |
||||||
カスタマイズ可能
適宜更新あり
|
|||||||
| プロテインバー:市場シェア分析、業界動向と統計、成長予測(2026年~2031年) |
|
出版日: 2026年01月12日
発行: Mordor Intelligence
ページ情報: 英文 303 Pages
納期: 2~3営業日
|

概要
プロテインバー市場は2025年に97億3,000万米ドルと評価され、2026年の106億9,000万米ドルから2031年までに171億7,000万米ドルに達すると予測されています。
予測期間(2026-2031年)におけるCAGRは9.92%と見込まれます。
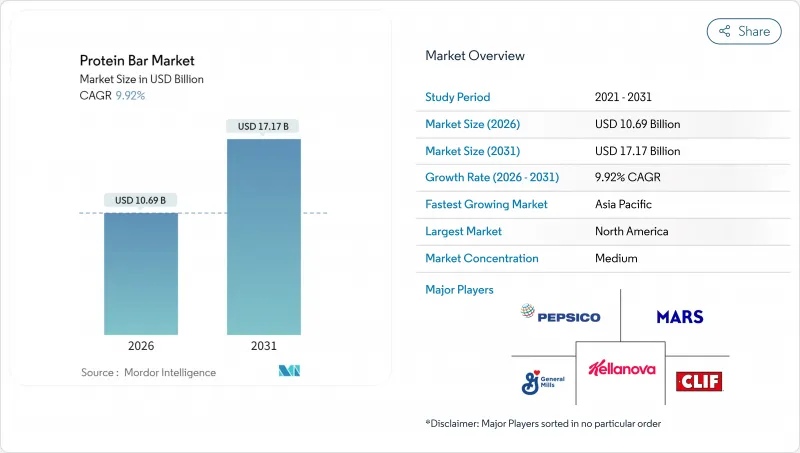
かつてはボディビルダーの分野に限られていたプロテインバーは、現在では常備食品、職場での軽食、携帯に便利な食事代替品として広く消費されています。この成長は、クリーンラベルレシピへの需要の高まり、植物性タンパク質技術の進歩、デジタル小売プラットフォームの利便性によって牽引されています。確立された菓子類メーカーは、原材料の透明性と豊かな味わいに焦点を当てた消費者直販ブランドとの競合激化に直面しています。市場規模では北米が首位を占めておりますが、アジア太平洋地域は可処分所得の増加と世界のフィットネスの動向により急速に成長しております。簡素化された原材料と革新的なタンパク質源を採用したプレミアム製品ラインが支持を集めており、価格比較を抑制する定期購入モデルがこれを後押ししております。しかしながら、規制の不統一、電子商取引における偽造リスク、糖分含有量への監視強化といった課題が成長に影響を及ぼす可能性があります。
世界のプロテインバー市場の動向と洞察
抗菌性・健康志向の配合への需要増加
2024年、ProGo社は肌の弾力性向上と関節健康サポートを目的としたコラーゲン配合プロテインバーを発売し、日常製品における機能性効果への消費者需要の高まりに対応しました。同様に、NoFuss社は植物性食生活における一般的な微量栄養素不足を補うため、ビタミンD3、B12、亜鉛を強化したバーを導入しました。この変化は、複数の健康効果を提供するプロテインバーへの嗜好の高まりを浮き彫りにしており、消費者はこうした革新的なソリューションに対してプレミアム価格を支払う意思を強めています。アクティブニュートリション分野は2024年に着実な成長を遂げ、これらの製品がフィットネスやワークアウトを超えた様々な日常用途で人気を集めました。メーカー各社は製品差別化のため、腸内環境と総合的な健康をサポートするポストバイオティクス菌株やプレバイオティクス繊維といった先進素材を活用しています。しかしながら、構造機能表示に関する規制枠組みが市場ごとに不統一であることが、業界にとって継続的な課題となっています。総合的な健康増進と機能性の信頼性に焦点を当てることで、ブランド各社は健康志向の消費者の進化する期待に応えられないことが多い従来の食事代替バーから、着実に市場シェアを獲得しています。
味・食感の改善を伴う植物性タンパク質システムの台頭
植物性タンパク質技術の近年の進歩により、製品品質が大幅に向上し、ホエイと同等の官能特性を実現。これにより植物性製品の普及における主要な障壁が解消されました。2024年にはイングレディオン社が、中性の風味と滑らかな食感が特徴のエンドウ豆タンパク質分離物「Vitessence Pea 100 HD」を発表。この革新により、ココアやピーナッツバターなどのマスキング剤の使用が不要となり、配合が簡素化されました。また、Vivici社は2024年に精密発酵技術で開発したBLGプロテインを発表しました。このプロテインは必須アミノ酸を全て含みながら、一般的なマメ科アレルゲンを回避できるため、より幅広い消費者層に適しています。さらに、CSIROは2024年に肉タンパク質粉末を開発し、元の栄養価の95%を維持することに成功しました。これにより、プロテインバーなどの動物性・植物性ハイブリッドタンパク質製品に新たな可能性が開かれました。2025年4月には、Barebells社がヴィーガン向けファッジブラウニーおよびキャラメルチョコチップバーを発売。各商品1食分あたり16グラムの植物性タンパク質を提供しています。この展開は、欧州ブランドが味と革新性を活用し、米国市場の確立されたリーダー企業と効果的に競争する姿勢を示しています。
規制の複雑さとコンプライアンス負担
多国籍ブランドは、FDA(米国食品医薬品局)、EFSA(欧州食品安全機関)、FSSAI(インド食品安全基準局)によって施行される表示基準の差異に直面しています。これらの違いにより、企業は別々のSKU(商品識別単位)と生産ロットを作成する必要があり、単一市場で事業を展開するブランドと比較してコストが12~18%増加します。2024年にはFDAが栄養成分表示パネルの改訂を実施し、200カロリー超のバーには二重列表示が義務付けられます。この変更はパッケージデザインを複雑化し、店頭での視認性を低下させます。同様に、EFSAの健康強調表示承認プロセスでは、1件あたり50万~100万米ドルの臨床試験が要求されるため、中小ブランドが機能性訴求を採用することは困難です。インドでは、FSSAI(食品基準安全局)の2024年包装前面表示規制により、糖分・塩分・脂肪含有量を赤・黄・緑のカラーコードで表示するシステムが導入されます。1食分あたり5グラム以上の糖分を含む製品は、消費者のネガティブな印象を受ける可能性があります。こうした規制要件は、専任の規制対応チームを持たない中小・新興ブランドに大きな負担を強いる一方、強力な法務・コンプライアンス体制を有する既存企業は市場で競争優位性を獲得します。
セグメント分析
2025年、ナッツベースのバーは市場の42.53%を占めました。これはアーモンド、カシューナッツ、ピーナッツを好む消費者の傾向に後押しされたものです。これらのナッツは、サクサクとした食感、高タンパク質含有量、満腹感を長持ちさせる脂質が人気です。例えばアーモンドは1オンスあたり6グラムのタンパク質を含み、ビタミンEやマグネシウムが豊富であるため、栄養価の高い選択肢として、クリーンラベル製品への需要の高まりに合致しています。同年、クアランタ社はヘーゼルナッツとアーモンドにホエイアイソレートを組み合わせたナッツプロテインバーを発売し、地中海風素材を好む欧州消費者をターゲットとしました。同様に、アーラ社は2024年に「エッセンシャルズバー」を導入。人工甘味料不使用のシンプルな10原料レシピでカシューナッツとピーナッツを特徴とし、健康志向の購買層に訴求しています。
デーツベースのバーは、天然の結合剤と甘味料という二重の役割により、2026年から2031年にかけてCAGR7.74%で成長が見込まれています。これらのバーは添加糖やシロップを不要とするため、より健康的な選択肢となります。デーツは100グラムあたり66グラムの糖分を含みますが、グリセミック指数(GI)は42と低く、サトウキビ糖やアガベシロップよりも血糖値の調節に優れています。2024年にはVeganz社がデーツシロップのみで甘味をつけたバーを発売し、1食あたり12グラムのタンパク質を提供しながら、一切の添加糖分を含みません。L-Nutra社も丸ごとのデーツを使用したバーを発売し、タンパク質に加え食物繊維とカリウムを提供。基本的な栄養素を超えた機能性栄養を求める消費者のニーズに応えています。さらにOobli社はデーツとウーブリフルーツ由来の甘味タンパク質を組み合わせ、エリスリトール特有の冷たい後味を残さず糖質を70%削減。低糖質を求める方々に好まれる選択肢となっています。
地域別分析
2025年時点で、北米は市場シェアの37.85%を占めております。これは、強いフィットネス文化、6,400万人を超えるジム会員数、そしてプロテインバー専用の小売棚スペースが大幅に確保されていることが背景にございます。この需要を牽引するのは米国であり、消費者はプロテインバーを単なるスポーツ栄養製品ではなく、食事代替品として利用する傾向が強まっています。アクティブな栄養補助食品ユーザーの約57%が、ワークアウト以外の様々な場面でこれらのバーを摂取しています。さらに、2024年には560万人の米国人がセマグルチドなどのGLP-1受容体作動薬を使用しており、減量中に筋肉量を維持しようとするユーザーが増えたことで、間接的にタンパク質摂取量が増加しています。カナダとメキシコも成長に寄与していますが、カナダ保健省の厳格な健康表示基準やメキシコのパッケージ前面警告表示といった規制上の課題が、地域での製品展開を複雑にしています。米国消費者における糖分摂取削減志向の高まりを受け、エリスリトール、ステビア、モンクフルーツなどの代替甘味料を用いた再配合が進んでいます。
アジア太平洋地域は最も成長が速い地域であり、2026年から2031年にかけてCAGR9.05%が見込まれています。中国、インド、日本、オーストラリアなどの国々における可処分所得の増加、都市化、フィットネスセンター普及率の上昇がこの成長を牽引しています。中国国家統計局によりますと、2024年の中国世帯の一人当たり年間平均可処分所得は約4万1,300元(2023年は3万9,218元)に達しました。4億人を超える中国の中産階級はフィットネス習慣を取り入れ、ジム会員数が着実に増加し、ワークアウト後の栄養補給需要を後押ししています。日本では高齢化が進み、60歳以上の方の筋肉減少防止を目的としたロイシンやHMBを強化したプロテインバーの需要が高まっています。オーストラリアでは、ハイキングやサイクリングなどのアウトドア活動における手軽なエネルギー源としてプロテインバーが広く利用されています。地域全体での電子商取引の急速な成長により、ブランドは分散した小売ネットワークを迂回し、地方都市や第2・第3級都市を含む消費者層へのリーチが可能となっています。
欧州と南米では、経済的課題や伝統的なスナックを好む消費者の嗜好により、緩やかな成長が見られます。欧州ではドイツ、英国、フランスが需要を牽引し、消費者は有機認証やシンプルな原材料表示を重視しています。ArlaやTrekといったブランドがこうした嗜好に応える一方、Barebellsは2025年に米国ブランドとの競争を視野に、ヴィーガン対応を含む5つの新フレーバーを導入しました。南米では、高関税と通貨変動によりプロテインバーの価格が北米比40~60%上昇し、市場は富裕層の都市部消費者に限定されています。中東・アフリカでは市場がまだ発展途上であり、UAEや南アフリカでは駐在員やフィットネス愛好家の間で初期導入が進んでいます。規制面では、2024年にインドで施行されたFSSAI(食品基準・安全局)のパッケージ前面表示規則や、サウジアラビアにおける同様の取り組みなどにより、糖分含有量や健康効果に関する表示において、各ブランドの商品ポジショニングに影響が生じております。
その他の特典:
- エクセル形式の市場予測(ME)シート
- アナリストによる3ヶ月間のサポート
よくあるご質問
目次
第1章 イントロダクション
- 調査の前提条件と市場の定義
- 調査範囲
第2章 調査手法
第3章 エグゼクティブサマリー
第4章 市場情勢
- 市場概要
- 市場促進要因
- 抗菌性および健康志向の配合に対する需要の増加
- 味・食感の改善された植物性タンパク質システムの台頭
- フィットネスセンターおよびジムの成長
- 小売業の近代化と電子商取引の導入
- 分量管理された携帯用スナックと適度なご褒美
- バーにおけるクリーンラベルおよび短成分リスト表示の拡大
- 市場抑制要因
- 規制の複雑さとコンプライアンス負担
- 偽造品および低品質製品
- 健康志向の消費者における高糖分バーへの否定的な認識
- アレルゲン管理と交差汚染リスク
- サプライチェーン分析
- 規制情勢
- テクノロジーの展望
- ポーターのファイブフォース分析
- 新規参入業者の脅威
- 買い手の交渉力
- 供給企業の交渉力
- 代替品の脅威
- 競争企業間の敵対関係
第5章 市場規模と成長予測
- 原料ベース別
- ナッツベースバー
- グラノーラ/オート麦ベース
- デーツベースバー
- ハイブリッドブレンド
- その他
- 価格帯別
- マス
- プレミアム
- 流通チャネル別
- スーパーマーケット/ハイパーマーケット
- オンライン小売店
- コンビニエンスストア
- その他流通チャネル
- 地域別
- 北米
- 米国
- カナダ
- メキシコ
- その他北米地域
- 欧州
- ドイツ
- 英国
- イタリア
- フランス
- スペイン
- オランダ
- ポーランド
- ベルギー
- スウェーデン
- その他欧州地域
- アジア太平洋地域
- 中国
- インド
- 日本
- オーストラリア
- インドネシア
- 韓国
- タイ
- シンガポール
- その他アジア太平洋地域
- 南米
- ブラジル
- アルゼンチン
- コロンビア
- チリ
- ペルー
- その他南米
- 中東・アフリカ
- 南アフリカ
- サウジアラビア
- アラブ首長国連邦
- ナイジェリア
- エジプト
- モロッコ
- トルコ
- その他中東・アフリカ地域
- 北米
第6章 競合情勢
- 市場集中度
- 戦略的動向
- 市場シェア分析
- 企業プロファイル
- Associated British Foods PLC
- Barebells Functional Foods AB
- Caveman Foods LLC
- Clif Bar & Company
- Fitshit Health Solutions Pvt. Ltd
- General Mills Inc.
- Glanbia PLC
- GNC Holdings LLC
- The Kellogg Company
- Lotus Bakeries
- Mars Incorporated
- Mondelez International Inc.
- MusclePharm Corporation
- Naturell India Pvt. Ltd
- PepsiCo Inc.
- Premier Nutrition Company LLC
- Quest Nutrition LLC
- RXBAR LLC
- Simply Good Foods Co.
- Stayfit Enterprize Private Limited
- The Hershey Company

