
|
市場調査レポート
商品コード
1687724
根粒菌:市場シェア分析、産業動向・統計、成長予測(2025年~2030年)Rhizobium - Market Share Analysis, Industry Trends & Statistics, Growth Forecasts (2025 - 2030) |
||||||
カスタマイズ可能
適宜更新あり
|
|||||||
| 根粒菌:市場シェア分析、産業動向・統計、成長予測(2025年~2030年) |
|
出版日: 2025年03月18日
発行: Mordor Intelligence
ページ情報: 英文 280 Pages
納期: 2~3営業日
|

全表示
- 概要
- 目次
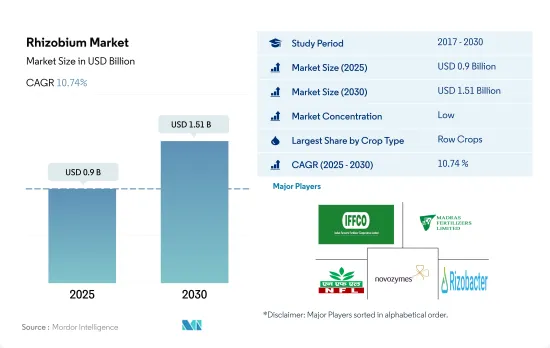
根粒菌の市場規模は2025年に9億米ドルと推定・予測され、2030年には15億1,000万米ドルに達し、予測期間中(2025-2030年)のCAGRは10.74%で成長すると予測されています。
- 根粒菌とマメ科植物の根との特異的な相互作用により、高度に制御されたモジュレーションと呼ばれるプロセスが形成され、大気中の窒素が同化可能な植物栄養素に変換されます。この能力は、畑作物生産における細菌接種剤の使用の基礎となります。2022年の菌根菌市場は連作作物が支配的で、市場金額の約69.7%を占めました。世界的に最も重要な連作作物は、大麦、トウモロコシ、小麦、菜種、ライ麦、ヒマワリ、大豆、米です。
- 園芸作物における根粒菌ベースのバイオ肥料市場は、2022年に4,900トンが使用され、1億3,720万米ドルになると予想されています。根粒菌株はトマトやピーマンの根に着生し、生産の様々な段階で成長を促し、苗や果実の収量や品質を向上させる。また、トマトやトウガラシなどの温室栽培や、その他の園芸果実栽培にも利用されています。
- コーヒー、紅茶、ココア、綿花、サトウキビ、菜種、ヒマワリ、タバコは、世界的に栽培されている主要な換金作物です。2022年の根粒菌ベースのバイオ肥料の市場価値は、換金作物が6,870万米ドルを占めました。北米が換金作物市場を独占し、2022年には約5,220万米ドルを占めました。
- 根粒菌の接種は、無機窒素肥料の需要を減少させながら、植物に必要な窒素を供給することができます。効果的な根粒菌接種は、収量を高めるために必要な全窒素の最大50~70%を供給することができます。根粒菌はまた、ビタミン、アミノ酸、シデロフォア、オーキシン、窒素固定を生成します。
- 上記の特性と根粒菌をベースとする肥料の用途の増加により、市場は2023年から2029年の間に成長すると予想されています。
- 根粒菌は植物と共生関係にあり、マメ科植物の根粒に生息する最も重要な窒素固定細菌です。根粒菌はバイオ肥料の中で世界で2番目に消費量が多く、2022年には25.4%のシェアを占める。
- 根粒菌の微生物活動により、さまざまなマメ科作物で年間1ヘクタールあたり40~250kgの窒素が固定されると推定されています。欧州連合(EU)は、マメ科作物の栽培面積の拡大を通じて、持続可能な植物性タンパク質生産への移行を計画しています。
- 北米が世界の根粒菌市場を独占し、2022年の市場シェアは52.7%でした。北米の根粒菌バイオ肥料市場は連作作物が支配的で、2022年の市場金額の約62.4%を占めています。連作作物が優勢なのは、根粒菌が連作作物に含まれるマメ科作物と共生しているためです。この地域では連作作物の栽培が盛んであるため、その市場価値は増加し、2023年から2029年にかけてCAGR 13.0%を記録すると予想されます。
- 非レギューム作物では、作物の収量ポテンシャルを高めるために窒素の追加施用が必要とされます。生物学的窒素固定細菌の使用は、穀物、果物、野菜のような非反芻作物の生産を増加させることができます。根粒菌バイオ肥料市場は耕作作物が支配的で、畑作物の栽培面積が広いため、2022年の市場金額の約69.8%を占めています。根粒菌バイオ肥料を果物や野菜作物に適用することで、栄養の利用性が高まり、必要な植物ホルモンが生成されることが知られています。
世界の根粒菌市場動向
北米と欧州では、意識の高まりと政府の取り組みにより、有機農業の生産量が過去最高を記録しています。
- 有機農業は持続可能な食糧システムに大きく貢献するものとして台頭し、世界187カ国で実践されています。2021年現在、世界の有機農地は7,230万haで、2018年から2021年にかけて全地域で平均2.9%増加しています。有機耕地は1,440万haで、有機農地全体の19.9%を占めています。
- 有機農業の最も強力な市場は北米と欧州で、世界の有機耕地の41.0%を占めています。2022年には、欧州には650万haの有機耕地があり、これは有機耕地全体の44.1%に相当します。北米と欧州で有機栽培されている最も重要な作物は、リンゴ、イチゴ、穀物、オリーブです。
- アジア太平洋の新興諸国も有機農業運動に参加し、国内需要を満たす新鮮な有機農産物の生産と供給で自給自足しつつあります。有機農業の動向はアジア太平洋で勢いを増しており、同地域では2017年から2022年にかけて有機耕地面積が18.8%増加します。この地域の政府による主要な取り組みも、有機農業の拡大傾向に重要な役割を果たしています。例えば、日本の食料・農業・農村基本計画は、2030年までに有機農家と有機農地の数を3倍に増やすことを目標としています。
- 有機農業の成長の原動力となっているのは、土壌の健康を促進し、環境への影響を低減し、より健康的な食品を生産するといった、有機農業の利点に対する意識の高まりです。
有機食品の1人当たり支出は主に米国とドイツで観察されるが、これはより健康的で持続可能な食品に対する消費者の需要に起因します。
- オーガニック食品市場は過去数年間に著しい成長を遂げ、世界の売上高は2012年の708億米ドルから2020年には1,206億米ドルに達します。有機食品への動向は、より健康的で持続可能な食品の選択肢を求める消費者需要の高まりや、従来型農業が環境に与える影響に対する意識の高まりなど、いくつかの要因に後押しされています。世界の有機食品市場は、今後数年間も成長傾向が続くと予想されます。
- オーガニック・トレード協会が2021年に実施した調査によると、同年のオーガニック果物・野菜の売上高は約4.5%増加し、オーガニック売上高全体の15%を占めました。オーガニック製品への平均支出額では北米が市場を独占しており、米国の1人当たり支出額は2021年に186.7米ドルに達し、北米諸国の中で最も高いです。欧州も有機食品市場で大きな成長が見込まれており、2021年の1人当たり支出額が最も高いのはドイツで75.6米ドルです。
- 有機食品市場は、消費者の可処分所得の高い先進諸国が依然として支配的であるが、新興諸国でも成長が見込まれます。例えば、アジア太平洋地域では労働者階級が増加しており、有機食品を入手しやすく手頃な価格で購入できるようになっているため、市場の拡大に寄与する可能性があります。
根粒菌産業の概要
根粒菌市場は断片化されており、上位5社で28.14%を占めています。この市場の主要企業は以下の通りです。Indian Farmers Fertiliser Cooperative Limited, Madras Fertilizers Limited, National Fertilizers Limited, Novozymes and Rizobacter(sorted alphabetically).
その他の特典
- エクセル形式の市場予測(ME)シート
- 3ヶ月のアナリストサポート
目次
第1章 エグゼクティブサマリーと主な調査結果
第2章 レポートのオファー
第3章 イントロダクション
- 調査の前提条件と市場定義
- 調査範囲
- 調査手法
第4章 主要産業動向
- 有機栽培面積
- 一人当たりのオーガニック製品への支出
- 規制の枠組み
- アルゼンチン
- オーストラリア
- ブラジル
- カナダ
- 中国
- エジプト
- フランス
- ドイツ
- インド
- インドネシア
- イタリア
- 日本
- メキシコ
- オランダ
- ナイジェリア
- フィリピン
- ロシア
- 南アフリカ
- スペイン
- タイ
- トルコ
- 英国
- 米国
- ベトナム
- バリューチェーンと流通チャネル分析
第5章 市場セグメンテーション
- 作物タイプ
- 換金作物
- 園芸作物
- 耕作作物
- 地域
- アフリカ
- 国別
- エジプト
- ナイジェリア
- 南アフリカ
- その他のアフリカ
- アジア太平洋
- 国別
- オーストラリア
- 中国
- インド
- インドネシア
- 日本
- フィリピン
- タイ
- ベトナム
- その他アジア太平洋地域
- 欧州
- 国別
- フランス
- ドイツ
- イタリア
- オランダ
- ロシア
- スペイン
- トルコ
- 英国
- その他欧州
- 中東
- 国別
- イラン
- サウジアラビア
- その他中東
- 北米
- 国別
- カナダ
- メキシコ
- 米国
- その他北米地域
- 南米
- 国別
- アルゼンチン
- ブラジル
- その他南米
- アフリカ
第6章 競合情勢
- 主要な戦略動向
- 市場シェア分析
- 企業情勢
- 企業プロファイル.
- Indian Farmers Fertiliser Cooperative Limited
- Indogulf BioAg LLC(Biotech Division of Indogulf Company)
- IPL Biologicals Limited
- Lallemand Inc.
- Madras Fertilizers Limited
- National Fertilizers Limited
- Novozymes
- Rizobacter
- T Stanes and Company Limited
- Vittia Group
第7章 CEOへの主な戦略的質問
第8章 付録
- 世界概要
- 概要
- ファイブフォース分析フレームワーク
- 世界のバリューチェーン分析
- 市場力学(DROs)
- 情報源と参考文献
- 図表一覧
- 主要洞察
- データパック
- 用語集
The Rhizobium Market size is estimated at 0.9 billion USD in 2025, and is expected to reach 1.51 billion USD by 2030, growing at a CAGR of 10.74% during the forecast period (2025-2030).
- The specific interaction between rhizobia and legume roots results in the formation of a highly regulated process termed modulation, which converts atmospheric nitrogen into an assimilable plant nutrient. This ability provides the basis for the use of bacterial inoculants in field crop production. Row crops dominated the mycorrhiza market in 2022, accounting for around 69.7% of market value. Globally, the most important row crops are barley, maize, wheat, rapeseed, rye, sunflower, soybean, and rice.
- The market for rhizobium-based biofertilizers in horticultural crops is expected to be worth USD 137.2 million, with 4.9 thousand metric tons used in 2022. Rhizobium strains colonize the roots of tomato and pepper plants to encourage growth at various stages of production, increasing seedling and fruit yield and quality. It is also utilized in greenhouse culture, such as tomato and capsicum farming, as well as other horticultural fruit growing.
- Coffee, tea, cocoa, cotton, sugarcane, rapeseed, sunflower, and tobacco are some of the major cash crops grown globally. Cash crops accounted for USD 68.7 million in the market value of rhizobium-based biofertilizers in 2022. North America dominated the market for cash crops and accounted for about USD 52.2 million in 2022.
- Rhizobium inoculation can provide plant nitrogen requirements while decreasing the demand for inorganic nitrogen fertilizer. Effective rhizobium inoculation can deliver up to 50-70% of the total nitrogen required to boost yields. Rhizobium also generates vitamins, amino acids, siderophores, auxins, and nitrogen fixation.
- Owing to the above-mentioned characteristics and the increase in the application of rhizobium-based fertilizers, the market is anticipated to grow between 2023 and 2029.
- Rhizobium is the most important nitrogen-fixing bacterium that exists in a symbiotic relationship with plants and lives in the root nodules of leguminous plants. Rhizobium is the second most consumed among biofertilizers globally and accounted for a share of 25.4% in the year 2022.
- It has been estimated that 40-250 kg of nitrogen per hectare per year is fixed by different legume crops by the microbial activities of rhizobium. The European Union is planning to make the transition toward sustainable plant protein production through the expansion of the area under leguminous crop cultivation.
- North America dominated the global rhizobium market with a market share of 52.7% in 2022. Row crops dominate the rhizobium biofertilizer market in North America, and they accounted for about 62.4% of the market value in 2022. The dominance of row crops is due to rhizobium's symbiotic association with leguminous crops, which come under row crops. Due to the large cultivation of row crops in the region, their market value is anticipated to increase, registering a CAGR of 13.0% between 2023 and 2029.
- The requirement for additional application of nitrogen in non-leguminous crops is high in order to enhance the yield potential of the crops. The usage of biological nitrogen-fixing bacteria can increase the production of non-leguminous crops like cereals, fruits, and vegetables. Row crops dominate the rhizobium biofertilizer market and accounted for about 69.8% of the market value in 2022, owing to the large area under the cultivation of field crops. The application of rhizobium biofertilizers in fruit and vegetable crops is known to increase nutrient availability and produce required plant hormones.
Global Rhizobium Market Trends
Organic production is at an all-time high in North America and Europe, due to the increasing awareness and Government initiatives.
- Organic agriculture has emerged as a significant contributor to sustainable food systems, with 187 countries practicing it globally. As of 2021, there was 72.3 million ha of organic agricultural land worldwide, with an average increase of 2.9% across all regions from 2018 to 2021. Organic arable land accounted for 14.4 million ha, representing 19.9% of the total organic agricultural land.
- The strongest markets for organic farming are North America and Europe, accounting for 41.0% of the global organic arable land. In 2022, Europe had 6.5 million ha of organic arable land, equivalent to 44.1% of the overall organic arable agricultural area. The most significant crops grown organically in North America and Europe are apples, strawberries, cereals, and olives.
- Developing countries in Asia-Pacific are also joining the organic agriculture movement and becoming self-sufficient in producing and providing fresh organic produce to meet their domestic demand. The trend of organic farming is gaining momentum in Asia-Pacific, with the region recording an 18.8% increase in organic arable land from 2017 to 2022. The major initiatives by governments in the region also play a vital role in the growing trend of organic farming. For example, Japan's Basic Plan for Food, Agriculture, and Rural Areas aims to triple the number of organic farmers and lands by 2030.
- The growth of organic agriculture is driven by the rising awareness of the benefits of organic farming, such as promoting soil health, reducing environmental impacts, and producing healthier food.
Per capita spending of organic food majorly observed in United States and Germany, attributed to the consumer demand for healthier and sustainable food
- The organic food market experienced significant growth in the past few years, with global sales reaching USD 120.6 billion in 2020, up from USD 70.8 billion in 2012. The trend toward organic food is being driven by several factors, such as increasing consumer demand for healthier, more sustainable food options and a growing awareness of the environmental impact of conventional agriculture. The global organic food market is expected to continue its growth trend over the coming years.
- According to a survey conducted by the Organic Trade Association in 2021, sales of organic fruits and vegetables increased by around 4.5% in the same year, accounting for 15% of the overall organic sales. North America dominates the market in terms of average spending on organic products, with per capita spending in the United States reaching USD 186.7 in 2021, the highest among all North American countries. Europe is also expected to experience significant growth in the organic food market, with Germany accounting for the highest per capita spending of USD 75.6 in 2021.
- While the organic food market is still dominated by developed countries with high consumer disposable incomes, it is also expected to grow in developing nations. For example, the increasing number of working-class people in the Asia-Pacific region may contribute to the market's expansion due to the growing availability and affordability of organic food products.
Rhizobium Industry Overview
The Rhizobium Market is fragmented, with the top five companies occupying 28.14%. The major players in this market are Indian Farmers Fertiliser Cooperative Limited, Madras Fertilizers Limited, National Fertilizers Limited, Novozymes and Rizobacter (sorted alphabetically).
Additional Benefits:
- The market estimate (ME) sheet in Excel format
- 3 months of analyst support
TABLE OF CONTENTS
1 EXECUTIVE SUMMARY & KEY FINDINGS
2 REPORT OFFERS
3 INTRODUCTION
- 3.1 Study Assumptions & Market Definition
- 3.2 Scope of the Study
- 3.3 Research Methodology
4 KEY INDUSTRY TRENDS
- 4.1 Area Under Organic Cultivation
- 4.2 Per Capita Spending On Organic Products
- 4.3 Regulatory Framework
- 4.3.1 Argentina
- 4.3.2 Australia
- 4.3.3 Brazil
- 4.3.4 Canada
- 4.3.5 China
- 4.3.6 Egypt
- 4.3.7 France
- 4.3.8 Germany
- 4.3.9 India
- 4.3.10 Indonesia
- 4.3.11 Italy
- 4.3.12 Japan
- 4.3.13 Mexico
- 4.3.14 Netherlands
- 4.3.15 Nigeria
- 4.3.16 Philippines
- 4.3.17 Russia
- 4.3.18 South Africa
- 4.3.19 Spain
- 4.3.20 Thailand
- 4.3.21 Turkey
- 4.3.22 United Kingdom
- 4.3.23 United States
- 4.3.24 Vietnam
- 4.4 Value Chain & Distribution Channel Analysis
5 MARKET SEGMENTATION (includes market size in Value in USD and Volume, Forecasts up to 2030 and analysis of growth prospects)
- 5.1 Crop Type
- 5.1.1 Cash Crops
- 5.1.2 Horticultural Crops
- 5.1.3 Row Crops
- 5.2 Region
- 5.2.1 Africa
- 5.2.1.1 By Country
- 5.2.1.1.1 Egypt
- 5.2.1.1.2 Nigeria
- 5.2.1.1.3 South Africa
- 5.2.1.1.4 Rest of Africa
- 5.2.2 Asia-Pacific
- 5.2.2.1 By Country
- 5.2.2.1.1 Australia
- 5.2.2.1.2 China
- 5.2.2.1.3 India
- 5.2.2.1.4 Indonesia
- 5.2.2.1.5 Japan
- 5.2.2.1.6 Philippines
- 5.2.2.1.7 Thailand
- 5.2.2.1.8 Vietnam
- 5.2.2.1.9 Rest of Asia-Pacific
- 5.2.3 Europe
- 5.2.3.1 By Country
- 5.2.3.1.1 France
- 5.2.3.1.2 Germany
- 5.2.3.1.3 Italy
- 5.2.3.1.4 Netherlands
- 5.2.3.1.5 Russia
- 5.2.3.1.6 Spain
- 5.2.3.1.7 Turkey
- 5.2.3.1.8 United Kingdom
- 5.2.3.1.9 Rest of Europe
- 5.2.4 Middle East
- 5.2.4.1 By Country
- 5.2.4.1.1 Iran
- 5.2.4.1.2 Saudi Arabia
- 5.2.4.1.3 Rest of Middle East
- 5.2.5 North America
- 5.2.5.1 By Country
- 5.2.5.1.1 Canada
- 5.2.5.1.2 Mexico
- 5.2.5.1.3 United States
- 5.2.5.1.4 Rest of North America
- 5.2.6 South America
- 5.2.6.1 By Country
- 5.2.6.1.1 Argentina
- 5.2.6.1.2 Brazil
- 5.2.6.1.3 Rest of South America
- 5.2.1 Africa
6 COMPETITIVE LANDSCAPE
- 6.1 Key Strategic Moves
- 6.2 Market Share Analysis
- 6.3 Company Landscape
- 6.4 Company Profiles (includes Global Level Overview, Market Level Overview, Core Business Segments, Financials, Headcount, Key Information, Market Rank, Market Share, Products and Services, and Analysis of Recent Developments).
- 6.4.1 Indian Farmers Fertiliser Cooperative Limited
- 6.4.2 Indogulf BioAg LLC (Biotech Division of Indogulf Company)
- 6.4.3 IPL Biologicals Limited
- 6.4.4 Lallemand Inc.
- 6.4.5 Madras Fertilizers Limited
- 6.4.6 National Fertilizers Limited
- 6.4.7 Novozymes
- 6.4.8 Rizobacter
- 6.4.9 T Stanes and Company Limited
- 6.4.10 Vittia Group
7 KEY STRATEGIC QUESTIONS FOR AGRICULTURAL BIOLOGICALS CEOS
8 APPENDIX
- 8.1 Global Overview
- 8.1.1 Overview
- 8.1.2 Porter's Five Forces Framework
- 8.1.3 Global Value Chain Analysis
- 8.1.4 Market Dynamics (DROs)
- 8.2 Sources & References
- 8.3 List of Tables & Figures
- 8.4 Primary Insights
- 8.5 Data Pack
- 8.6 Glossary of Terms
