
北米のデータセンター:市場シェア分析、産業動向、成長予測(2025年~2030年)
North America Data Center - Market Share Analysis, Industry Trends & Statistics, Growth Forecasts (2025 - 2030)- 発行日
- ページ情報
- 英文 219 Pages
- 納期
- 2~3営業日
- 商品コード
- 1687220
- カスタマイズ可能 お客様のご希望に応じて、既存データの加工や未掲載情報(例:国別セグメント)の追加などの対応が可能です。詳細はお問い合わせください。
- 適宜更新あり 本レポートは最新情報反映のため適宜更新し、内容構成変更を行う場合があります。ご検討の際はお問い合わせください。
- 翻訳ツール提供対象 PDF対応AI翻訳ツールの無料貸し出しサービスのご利用が可能です
概要
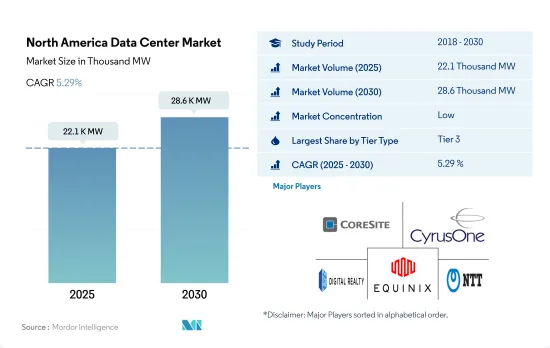
北米のデータセンター市場規模は、2025年に2万2,100MWと推定され、2030年には2万8,600MWに達し、CAGR 5.29%で成長すると予測されます。
また、2025年のコロケーション収益は259億3,260万米ドル、2030年には422億2,770万米ドルに達すると予測され、予測期間(2025~2030年)のCAGRは10.24%です。
2023年はティア3データセンターが数量ベースで大半のシェアを占める;ティア4が急成長セグメント
- ティア4データセンターは2023年に5,881.0MWに達し、さらにCAGR 13.46%を示して2029年には1万2,547.2MWを超えると予測されます。
- 今後数年間、ティア1とティア2の設備需要は着実に減少していくが、長引く予測不能な停電により成長は続くと考えられます。こうしたティア1とティア2のロケーションには、すでに十分な量のリテール向けコロケーションが供給されているが、低レイテンシーと効率性の向上に対する需要が高まるなか、ハイパースケールクラウドの要件を満たすための大規模プロジェクトも需要を牽引しています。
- データ処理、ストレージ、分析に対する需要の高まりから、大半の顧客は最終的にティア3やティア4の施設に移ると考えられます。ティア3タイプは、その機能の大きなメリットにより、2022年には市場の大半を占めていました。この地域のティア3データセンターの大半は北米にあり、電力と冷却のための多数のチャネルを提供するだけでなく、高レベルの冗長性も備えています。これらのデータセンターの稼働率は約99.982%で、これは年間1.6時間のダウンタイムに相当します。さらに、エッジ接続やクラウド接続の利用増加に伴い、ティア3データセンターの拡大は今後も続くと予想されます。
- ティア4タイプはCAGR 15.51%で増加すると予想されています。総合的なフォールトトレランスとコンポーネントの冗長性から利益を得るため、複数の先進国がティア4認証の採用に取り組んでいます。2022年、北米には81のティア4データセンターが存在しました。クラウドベースのサービスを提供する企業が増えたことで、他の企業も最高の技術を備えたコロケーション・スペースを提供する施設を建設するようになり、ティア4データセンターは今後数年で飛躍的に成長すると考えられます。
米国がこの地域市場の大半のシェアを占めており、予測期間中もその優位性は続くと予想されます。
- 過去数年間、この地域ではクラウドの普及とデータ世代の増加により、データセンターの需要が急増しています。北米におけるデータセンター市場拡大の主要因は、IoTの人気上昇、5Gネットワークの開発拡大、新興国市場の大流行、オンラインエンターテイメントコンテンツの高速ストリーミング需要の増加です。
- 北米におけるハイパースケールコロケーションデータセンターの総IT負荷容量は4,481.2メガワット(MW)であり、CAGR 14.63%を記録した後、2029年には1万2,047.5MWに達する見込みです。2023年までに1万3,000MW以上の容量が開発され、2029年までに2万5,000MW以上に増加する見込みです。この新規容量の半分以上が米国でメガデータセンターによって追加され、次いで大規模データセンターが続きます。データセンターに対するユーザーの要求の規模と量は拡大を続けています。
- 複数の大企業が合計60MW以上、中には100MW以上のリース契約を結んでいます。ほとんどの大手ハイパースケーラーが70%以上の純吸収率を担っており、2029年までに5%以上増加する見込みです。米国のハイパースケールデータセンター市場は、今後数年間、北米で最も急速に成長すると予測されています。近年の経済優遇措置や税制優遇措置が米国データセンター市場構築の主要因となっています。
- カナダはデータセンター市場の成長国です。支援的な規制環境と冷涼な気候がデータセンター市場を支え、運営に理想的です。モノのインターネット(IoT)、クラウドコンピューティング、ビッグデータにより、カナダではデータストレージと処理能力に対する需要が高まっています。その結果、新しい施設が建設され、古い施設は拡大されています。
北米のデータセンター市場の動向
ネットワークカバレッジの拡大、4Gと5G拡大の継続的な高採用が市場成長を牽引する可能性
- 無制限のデータ通信料金、5Gネットワークのカバレッジ拡大、ネットワーク容量の増加により、2021年には5Gの新規加入者がますます増加しました。ゲーム、XR、動画ベースのアプリの採用が増加すると予想される中、1分あたりの使用で作成されるデータ量は大幅に増加すると予想されました。ユーザーを満足させるためには、より高いビデオ解像度、より多くのアップリンクトラフィック、クラウドコンピューティングリソースにオフロードされたデバイスからのデータが必要となります。北米は2028年までに5Gの契約普及率が最も高くなり、他の全地域と比べて90%に達すると予測されました。
- 5Gを早期に展開した人気都市が、2021年の予測期間中にトラフィック増加のペースを握りました。5Gは今後数年間、モバイルデータトラフィックの10%以上を占めると予想されました。カバレッジの拡大と、スマートフォン契約数とスマートフォン1台当たりの平均データ使用量の増加に関連する4Gの継続的な高い普及率が、トラフィックの増加を牽引していました。例えば、2021年時点で、米国のスマートフォン所有者数は約3億2,800万人であり、2027年には北米のスマートフォン契約数は3億5,800万件に達します。
- 広帯域サービスの利用は、LTEの利用可能範囲の拡大によって可能になりました。モバイルサービスを利用する人の約75%が週単位でインターネットを利用し、その半数以上がモバイル機器からインターネットを利用していました。2番目に多かったのはソーシャルネットワーキングで、モバイルユーザーの60%以上が毎週少なくとも1回はソーシャルネットワーキング・サイトを訪れていました。この利用は、2021年には1日15分から30分のビデオストリーミングに相当します。また、SNSやその他のアプリによるトラフィックの増加も予想されました。2021年の月間モバイルデータトラフィックは6GBに達し、2029年には30GB以上に増加すると予想されました。
5Gネットワークの拡大と5Gスマートフォンの販売増加が市場の成長を後押し
- スマートフォンの普及には拡大の余地があります。2021年末までに、北米のモバイル接続の83%をスマートフォンが占めます。2025年までにさらに3,000万台のスマートフォン接続が見込まれることから、レガシーネットワーク(2Gと3G)からの移行が今後もスマートフォンの普及を支えると考えられます。2027年までに3倍以上になると予想される北米のモバイルデータトラフィックの拡大は、スマートフォンの普及率の上昇に大きく依存し続けると考えられます。Appleが2007年に最初のiPhoneを発表して以来、スマートフォンの人気は急上昇しました。2016年には、アメリカ人全体の43.5%がiPhoneを所有すると予想されていました。
- 米国では、2021年にはモバイル接続の約4件に1件が5Gとなり、5Gの普及が始まっていました。パンデミック後の景気回復、5Gスマートフォンの販売増、一般的なマーケティング施策などが機運の高まりにつながりました。5Gへのアップグレードに対する消費者の関心は高まっており、現在5Gを利用している顧客は、ストリーミングビデオ、音楽、ゲーム、ライブスポーツ、クラウドストレージなどのコンテンツやサービスに5Gプランを拡大することに関心を示していました。これにより、より多くの人々がスマートフォンを購入し、スマートフォンユーザーが増加すると予想されました。
- 北米では約90%の人がインターネットを利用しています。米国とカナダでは、Facebookの月間アクティブユーザー数(MAU)は合わせて2億6,600万人でした。このことは、同地域でスマートフォンが広く普及していることを示しています。スマートフォンは大量のデータをリアルタイムで処理する必要があるため、データセンターをストレージとして利用する必要があります。同地域では、スマートフォンの好調な成長により、予想される期間中にデータセンターの増加が見込まれます。
北米のデータセンター産業概要
北米のデータセンター市場は細分化されており、上位5社で19.67%を占めています。同市場の主要企業は、CoreSite(America Tower Corporation)、CyrusOne Inc.、Digital Realty Trust Inc.、Equinix Inc.、NTT Ltdなどです。
その他の特典
- エクセル形式の市場予測(ME)シート
- 3ヶ月間のアナリストサポート
目次
第1章 エグゼクティブサマリーと主要調査結果
第2章 レポートのオファー
第3章 イントロダクション
- 調査の前提条件と市場定義
- 調査範囲
- 調査手法
第4章 市場展望
- 耐荷重
- 床面積
- コロケーション収入
- 設置ラック数
- ラックスペース利用率
- 海底ケーブル
第5章 主要産業動向
- スマートフォンユーザー数
- スマートフォン1台当たりのデータトラフィック
- モバイルデータ速度
- ブロードバンドデータ速度
- 光ファイバー接続ネットワーク
- 規制の枠組み
- カナダ
- メキシコ
- 米国
- バリューチェーンと流通チャネル分析
第6章 市場セグメンテーション
- データセンター規模
- 大規模
- 超大規模
- 中規模
- メガ規模
- 小規模
- ティアタイプ
- ティア1と2
- ティア3
- ティア4
- 吸収量
- 非利用
- 利用
- コロケーションタイプ別
- ハイパースケール
- リテール
- ホールセール
- エンドユーザー別
- BFSI
- クラウド
- eコマース
- 政府機関
- 製造業
- メディア&エンターテイメント
- テレコム
- その他
- 国名
- カナダ
- メキシコ
- 米国
- その他の北米地域
第7章 競合情勢
- 市場シェア分析
- 企業情勢
- 企業プロファイル.
- Cologix Inc.
- CoreSite(America Tower Corporation)
- CyrusOne Inc.
- Cyxtera Technologies
- Digital Realty Trust Inc.
- Edgecore(Partners Group)
- Equinix Inc.
- Flexential Corp.
- NTT Ltd
- Quality Technology Services
- Switch
- Vantage Data Centers LLC
第8章 CEOへの主要戦略的質問
第9章 付録
- 世界概要
- 概要
- ファイブフォース分析フレームワーク
- 世界のバリューチェーン分析
- 世界市場規模とDRO
- 情報源と参考文献
- 図表リスト
- 主要洞察
- データパック
- 用語集
目次
The North America Data Center Market size is estimated at 22.1 thousand MW in 2025, and is expected to reach 28.6 thousand MW by 2030, growing at a CAGR of 5.29%. Further, the market is expected to generate colocation revenue of USD 25,932.6 Million in 2025 and is projected to reach USD 42,227.7 Million by 2030, growing at a CAGR of 10.24% during the forecast period (2025-2030).
Tier 3 data centers accounted for majority share in terms of volume in 2023; Tier 4 is the fastest-growing segment
- The tier 4 data center reached 5881.0 MW in 2023 and is further projected to exhibit a CAGR of 13.46%, surpassing 12547.2 MW by 2029.
- Over the coming years, demand for facilities in tiers 1 and 2 will steadily decrease, but growth will continue due to protracted and unpredictable outages. While there is already an adequate supply of retail colocation in these tier 1 and tier 2 locations, large-scale projects are also driving demand to fulfill growing hyperscale cloud requirements as the demand for lower latency and greater efficiency develops.
- The majority of clients will eventually move to tier 3 and tier 4 facilities due to the increasing demand for data processing, storage, and analysis. The tier 3 type held the majority of the market in 2022 due to the significant benefits of its features. Most tier 3 data centers in the area are located in North America, providing numerous channels for power and cooling as well as a high level of redundancy. These data centers have an uptime of about 99.982%, which equals 1.6 hours of downtime annually. Additionally, it is anticipated that the expansion in tier 3 data centers will continue to increase with the increased usage of edge and cloud connectivity.
- The tier 4 type is anticipated to increase at a CAGR of 15.51%. To benefit from total fault tolerance and component redundancy, several industrialized nations are working on adopting the Tier 4 certification. In 2022, there were 81 tier 4 data centers in North America. Tier 4 data centers will grow dramatically in the coming years as more companies are offering cloud-based services, which has prompted other companies to build facilities to offer colocation space with the greatest technology.
The United States holds the majority share of the regional market, with its dominance expected to continue during the forecast period
- Over the past few years, there has been a sharp increase in the demand for data centers in the region due to growing cloud adoption and rising data generation. The major drivers of the expansion of the data center market in North America have been the rising popularity of IoT, the increased development of 5G networks, the COVID-19 pandemic, and the increasing demand for high-speed streaming of online entertainment content.
- The total IT load capacity of hyper-scale colocation data centers in North America is 4,481.2 megawatts (MW), and by 2029, it is expected to reach 1,2047.5 MW after registering a CAGR of 14.63%. By 2023, more than 13,000 MW of capacity were to be under development, and by 2029, this is expected to increase to more than 25,000 MW. More than half this new capacity is being added in the United States by mega data centers, followed by massive-size data centers. The size and quantity of user requirements for data centers kept expanding.
- Several sizable businesses have inked leases totaling more than 60 MW, some even over 100 MW. Most big hyperscalers are responsible for a net absorption percentage of more than 70%, which is to rise by more than 5% by 2029. The hyperscale data center market in the United States is predicted to grow the fastest in North America over the coming years. Recent economic incentives and tax benefits have been key factors in constructing the US data center market.
- Canada is a growing nation in the data center market. A supportive regulatory environment and cool climate support the data center market and are ideal for operations. The Internet of Things (IoT), cloud computing, and big data drive Canada's demand for data storage and processing capabilities. As a result, new facilities are being built, and old ones are being expanded.
North America Data Center Market Trends
The expansion of network coverage and the continued high adoption of 4G and 5G expansion may drive market growth
- The unlimited data rates, enhanced 5G network coverage, and increased network capacity drew more and more new 5G subscribers in 2021. With the adoption of gaming, XR, and video-based apps anticipated to rise, the amount of data created per minute of use was expected to increase considerably. To satisfy users, these experiences required greater video resolutions, more uplink traffic, and data from devices offloaded to cloud computing resources. North America was projected to have the highest 5G subscription penetration, reaching 90%, by 2028 compared to all other areas.
- Popular cities with early 5G rollouts set the pace for traffic growth during the forecast period in 2021. 5G was expected to account for more than 10% of mobile data traffic in the upcoming years. The expansion of coverage and the continued high adoption of 4G, which was related to an increase in smartphone subscriptions and average data usage per smartphone, were driving traffic growth. For instance, as of 2021, there were about 328 million smartphone owners in the United States, and by 2027, there will be 358 million smartphone subscriptions in North America.
- The use of high bandwidth services was made possible by the expansion of LTE availability. About 75% of people who used mobile services visited the internet on a weekly basis, with more than half of them doing so from their mobile devices. The second-largest category was social networking, with more than 60% of mobile users visiting a social networking site at least once each week. The usage equated to 15 to 30 minutes of daily video streaming in 2021. Increased traffic was also expected to result from social networking and other apps. In 2021, monthly mobile data traffic was anticipated to reach 6 GB and increase to more than 30 GB by 2029.
5G network expansion and increased sales of 5G smartphones will boost the market's growth
- Smartphone adoption has some room to expand. By the end of 2021, smartphones accounted for 83% of mobile connections in North America. With 30 million additional smartphone connections anticipated by 2025, the migration away from legacy networks (2G and 3G) will continue to support smartphone adoption in the coming years. The expansion of mobile data traffic in North America, which was anticipated to more than triple by 2027, will continue to depend heavily on rising smartphone penetration. Since Apple unveiled the first iPhone in 2007, the popularity of smartphones has skyrocketed. By 2016, it was expected that 43.5% of all Americans would own an iPhone.
- In the United States, where 5G made up approximately one out of every four mobile connections in 2021, 5G was starting to become widely used. The economic recovery following the pandemic, increased sales of 5G smartphones, and general marketing initiatives have all helped increase momentum. Consumer interest in upgrading to 5G was increasing, and current 5G customers were showing an increased interest in expanding their 5G plans to include content and services like streaming video, music, gaming, live sports, and cloud storage. This was expected to encourage more people to purchase smartphones, increasing the number of smartphone users.
- Almost 90% of people in North America use the internet. In the United States and Canada, Facebook had a combined 266 million monthly active users (MAU). This demonstrated the widespread use of smartphones in the region, which essentially necessitates the use of data centers for storage since they demand real-time processing of sizable data chunks. A rise in data centers was expected to be seen in the region during the anticipated period as a result of good smartphone growth.
North America Data Center Industry Overview
The North America Data Center Market is fragmented, with the top five companies occupying 19.67%. The major players in this market are CoreSite (America Tower Corporation), CyrusOne Inc., Digital Realty Trust Inc., Equinix Inc. and NTT Ltd (sorted alphabetically).
Additional Benefits:
- The market estimate (ME) sheet in Excel format
- 3 months of analyst support
TABLE OF CONTENTS
1 EXECUTIVE SUMMARY & KEY FINDINGS
2 REPORT OFFERS
3 INTRODUCTION
- 3.1 Study Assumptions & Market Definition
- 3.2 Scope of the Study
- 3.3 Research Methodology
4 MARKET OUTLOOK
- 4.1 It Load Capacity
- 4.2 Raised Floor Space
- 4.3 Colocation Revenue
- 4.4 Installed Racks
- 4.5 Rack Space Utilization
- 4.6 Submarine Cable
5 Key Industry Trends
- 5.1 Smartphone Users
- 5.2 Data Traffic Per Smartphone
- 5.3 Mobile Data Speed
- 5.4 Broadband Data Speed
- 5.5 Fiber Connectivity Network
- 5.6 Regulatory Framework
- 5.6.1 Canada
- 5.6.2 Mexico
- 5.6.3 United States
- 5.7 Value Chain & Distribution Channel Analysis
6 MARKET SEGMENTATION (INCLUDES MARKET SIZE IN VOLUME, FORECASTS UP TO 2030 AND ANALYSIS OF GROWTH PROSPECTS)
- 6.1 Data Center Size
- 6.1.1 Large
- 6.1.2 Massive
- 6.1.3 Medium
- 6.1.4 Mega
- 6.1.5 Small
- 6.2 Tier Type
- 6.2.1 Tier 1 and 2
- 6.2.2 Tier 3
- 6.2.3 Tier 4
- 6.3 Absorption
- 6.3.1 Non-Utilized
- 6.3.2 Utilized
- 6.3.2.1 By Colocation Type
- 6.3.2.1.1 Hyperscale
- 6.3.2.1.2 Retail
- 6.3.2.1.3 Wholesale
- 6.3.2.2 By End User
- 6.3.2.2.1 BFSI
- 6.3.2.2.2 Cloud
- 6.3.2.2.3 E-Commerce
- 6.3.2.2.4 Government
- 6.3.2.2.5 Manufacturing
- 6.3.2.2.6 Media & Entertainment
- 6.3.2.2.7 Telecom
- 6.3.2.2.8 Other End User
- 6.4 Country
- 6.4.1 Canada
- 6.4.2 Mexico
- 6.4.3 United States
- 6.4.4 Rest of North America
7 COMPETITIVE LANDSCAPE
- 7.1 Market Share Analysis
- 7.2 Company Landscape
- 7.3 Company Profiles (includes Global Level Overview, Market Level Overview, Core Business Segments, Financials, Headcount, Key Information, Market Rank, Market Share, Products and Services, and Analysis of Recent Developments).
- 7.3.1 Cologix Inc.
- 7.3.2 CoreSite (America Tower Corporation)
- 7.3.3 CyrusOne Inc.
- 7.3.4 Cyxtera Technologies
- 7.3.5 Digital Realty Trust Inc.
- 7.3.6 Edgecore (Partners Group)
- 7.3.7 Equinix Inc.
- 7.3.8 Flexential Corp.
- 7.3.9 NTT Ltd
- 7.3.10 Quality Technology Services
- 7.3.11 Switch
- 7.3.12 Vantage Data Centers LLC
- 7.4 LIST OF COMPANIES STUDIED
8 KEY STRATEGIC QUESTIONS FOR DATA CENTER CEOS
9 APPENDIX
- 9.1 Global Overview
- 9.1.1 Overview
- 9.1.2 Porter's Five Forces Framework
- 9.1.3 Global Value Chain Analysis
- 9.1.4 Global Market Size and DROs
- 9.2 Sources & References
- 9.3 List of Tables & Figures
- 9.4 Primary Insights
- 9.5 Data Pack
- 9.6 Glossary of Terms
- 発行日
- 発行
- Mordor Intelligence
- ページ情報
- 英文 219 Pages
- 納期
- 2~3営業日

