
|
市場調査レポート
商品コード
1687212
ドライミックスモルタル:市場シェア分析、産業動向と統計、成長予測(2025~2030年)Dry Mix Mortar - Market Share Analysis, Industry Trends & Statistics, Growth Forecasts (2025 - 2030) |
||||||
カスタマイズ可能
適宜更新あり
|
|||||||
| ドライミックスモルタル:市場シェア分析、産業動向と統計、成長予測(2025~2030年) |
|
出版日: 2025年03月18日
発行: Mordor Intelligence
ページ情報: 英文 361 Pages
納期: 2~3営業日
|

全表示
- 概要
- 目次
概要
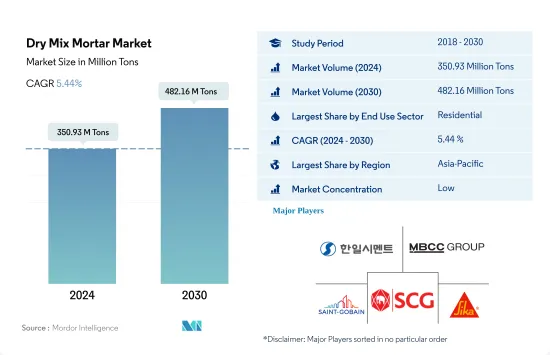
ドライミックスモルタルの市場規模は2024年に3億5,093万トンと推定され、2030年には4億8,216万トンに達すると予測され、予測期間中(2024~2030年)のCAGRは5.44%で成長します。
インドのグレードAオフィスなど、新興国での商業施設の建設が増加しており、2030年には12億平方フィートに達すると予想され、市場の成長を促進します。
- 2022年、ドライミックスモルタルの世界消費量は0.64%という緩やかな成長率を示したが、これはインフラと商業建設部門からの需要の高まりによるものです。特に、2022年のインフラ部門と商業部門の成長率は、2021年と比較してそれぞれ3.42%と1.0%でした。ドライミックスモルタルの世界市場は、2023年に約4.29%成長すると予測されました。
- 2022年のシェアは62.34%で、住宅部門がドライミックスモルタルの最大の消費者となっています。都市化、政府の取り組み、国内外からの投資といった要因が住宅需要を煽り、住宅建設の急増につながっています。例えば、ドイツでは2024年までに最低でも4,000戸の住宅を新たに建設することになっており、マレーシア政府は2025年までに約50万戸の手頃な価格の住宅を建設することを目指しています。その結果、住宅セクターのドライミックスモルタル市場は、2023~2030年のCAGRが5.43%になると予測されています。
- 商業セクターはドライミックスモルタルの消費者として最も急成長しており、CAGRは6.52%と予測されます。この急増は、ショッピングモール、オフィススペース、その他の商業構造物に対する需要の高まりによるものです。この動向を浮き彫りにするように、インドの上位7都市におけるグレードAオフィス市場は、2026年までに約10億平方フィートに拡大し、さらに2030年までに12億平方フィートに拡大すると予想されています。また、世界の商業施設の新設床面積は、2023年と比較して2030年には25億平方フィートと大幅に増加すると予測されています。その結果、世界の業務用ドライミックスモルタル消費量は2023~2030年にかけて1億4,900万トン増加すると推定されます。
アジア太平洋と南米における急速な建設活動がドライミックスモルタルの需要を押し上げると予測される
- ドライミックスモルタルは商業建築と住宅建築の両方で重要な役割を果たしており、スタッコ、グラウト、タイル接着剤、目地充填剤などに用途を見出しています。2022年、世界のドライミックスモルタル市場は数量ベースで0.64%の控えめな成長を記録したが、これはインフレ、原料費の高騰、差し迫った景気後退といった要因による減速でした。これらの課題は建設投資の落ち込みとプロジェクトの遅延を招き、ドライミックスモルタルの需要を減衰させました。しかし、2022~2023年にかけての数量成長率は4.95%と予測され、北米市場がリードする構えで、回復が予測されます。
- アジア太平洋は2022年のドライミックスモルタル市場で圧倒的な地位を占め、世界シェアの1億3,000万トンを大きく占めました。特筆すべきは、中国、日本、インドといった国々がこの需要の形成に極めて重要な役割を果たしたことです。2022年、中国の交通インフラに対する公共支出は、2021年の1,576億米ドルから1,656億米ドルに増加しました。日本は製造施設の建設が急増し、インドは交通網の強化と手頃な価格の住宅の提供を目指し、建設セクターの拡大に拍車をかけた。
- アジア太平洋は、ドライミックスモルタルの数量でCAGR 6.09%を記録し、最も高い成長率を記録する展望です。南米が僅差で続き、予測期間中のCAGRは5.54%です。政府と外国投資が主要プロジェクトを支援する中、住宅、インフラ、商業建設セクターの繁栄が見込まれ、ドライミックスモルタルの需要を牽引しています。
世界のドライミックスモルタル市場動向
アジア太平洋における大規模オフィスビル建設プロジェクトの急増により、世界の商業建築専用床面積が増加する見込み
- 2022年、世界の商業建築用新設床面積は前年比0.15%増と小幅な成長にとどまりました。欧州は12.70%の大幅な伸びで際立っており、これは2030年の二酸化炭素排出目標に合わせてエネルギー効率の高いオフィスビルを推進する動きが原動力となっています。従業員のオフィス復帰に伴い、欧州企業はリース契約を再開し、2022年には450万平方フィートの新規オフィス建設に拍車をかけた。この勢いは2023年も続き、世界の成長率は4.26%と予測されています。
- COVID-19の流行は労働力と資材の不足を引き起こし、商業施設の建設プロジェクトのキャンセルと遅延を招いた。しかし、閉鎖が緩和され、建設活動が再開されるにつれて、2021年の世界の商業施設の新設床面積は11.11%急増し、アジア太平洋が20.98%の成長率でリードしました。
- 今後、世界の商業施設の新設床面積のCAGRは4.56%となります。アジア太平洋のCAGRは5.16%と予測され、他地域を凌駕すると予想されます。この成長の原動力となっているのは、中国、インド、韓国、日本における商業施設建設プロジェクトの活発化です。特に、北京、上海、香港、台北といった中国の主要都市では、Aグレードのオフィススペース建設が加速しています。さらに、インドでは2023~2025年にかけて、上位7都市で約2,325万平方フィートに及ぶ約60のショッピングモールがオープンする予定です。アジア太平洋全域のこうした取り組みを合計すると、2030年までに商業施設の新規床面積は2022年比で15億6,000万平方フィート増加すると予想されます。
世界の住宅セクターを後押しする手頃な価格の住宅計画への政府投資の増加により、南米の住宅建設が最も急成長すると推定されます。
- 2022年、世界の住宅建築の新規床面積は2021年比で約2億8,900万平方フィート減少しました。これは、土地不足、労働力不足、建設資材価格の持続不可能な高騰が原因で発生した住宅危機に起因します。この危機はアジア太平洋に深刻な影響を与え、2022年の新設床面積は2021年比で5.39%減少しました。しかし2023年には、2030年までに30億人を収容できる手頃な価格の住宅を新たに建設するための資金を提供できる政府投資により、世界の新設床面積は2022年比で3.31%増加すると予測され、より明るい展望が期待されます。
- COVID-19の流行は景気減速を引き起こし、そのため多くの住宅建設プロジェクトが中止または延期され、2020年の世界の新設床面積は2019年に比べて4.79%減少しました。2021年に規制が解除され、住宅プロジェクトに対する鬱積した需要が解放されると、新設床面積は2020年比で11.22%増加し、欧州が18.28%と最も高い伸びを示し、次いで南米が2021年に2020年比で17.36%増加しました。
- 世界の住宅用新設床面積は予測期間中にCAGR 3.81%を記録し、南米が最も速いCAGR 4.05%で発展すると予測されます。2023年に発表されたブラジルのMinha Casa Minha Vidaのような計画やイニシアチブは、いくつかの規制変更とともに発表され、政府は低所得世帯に手頃な価格の住宅を提供するために19億8,000万米ドルの投資を計画しており、チリのFOGAESも2023年に発表され、初期投資額は5,000万米ドルです。
ドライミックスモルタル産業概要
ドライミックスモルタル市場は細分化されており、上位5社で11.78%を占めています。この市場の主要企業は、 HANIL HOLDINGS、MBCC Group、Saint-Gobain、SCG、Sika AGなどです。
その他の特典
- エクセル形式の市場予測(ME)シート
- 3ヶ月のアナリストサポート
目次
第1章 エグゼクティブサマリーと主要調査結果
第2章 レポートのオファー
第3章 イントロダクション
- 調査の前提条件と市場定義
- 調査範囲
- 調査手法
第4章 主要産業動向
- 最終用途セグメントの動向
- 商業
- 産業・施設
- インフラ
- 住宅用
- 主要インフラプロジェクト(現在と発表済み)
- 規制の枠組み
- バリューチェーンと流通チャネル分析
第5章 市場セグメンテーション
- 最終用途セグメント
- 商業
- 産業・施設
- インフラ
- 住宅用
- 用途
- コンクリートの保護と改修
- グラウト
- 断熱と仕上げシステム
- プラスター
- レンダー
- タイル接着剤
- 防水スラリー
- その他
- 地域
- アジア太平洋
- 国別
- オーストラリア
- 中国
- インド
- インドネシア
- 日本
- マレーシア
- 韓国
- タイ
- ベトナム
- その他のアジア太平洋
- 欧州
- 国別
- フランス
- ドイツ
- イタリア
- ロシア
- スペイン
- 英国
- その他の欧州
- 中東・アフリカ
- 国別
- サウジアラビア
- アラブ首長国連邦
- その他の中東・アフリカ
- 北米
- 国別
- カナダ
- メキシコ
- 米国
- 南米
- 国別
- アルゼンチン
- ブラジル
- その他の南米
- アジア太平洋
第6章 競合情勢
- 主要な戦略動向
- 市場シェア分析
- 企業情勢
- 企業プロファイル
- Ardex Group
- CEMEX, S.A.B. de C.V.
- Grupo Puma
- HANIL HOLDINGS CO.,LTD.
- Holcim
- LATICRETE International, Inc.
- MAPEI S.p.A.
- MBCC Group
- Saint-Gobain
- SAMPYO GROUP
- SCG
- SIG
- Sika AG
- UltraTech Cement Ltd.
- Votorantim Cimentos
第7章 CEOへの主要戦略的質問
第8章 付録
- 世界概要
- 概要
- ファイブフォース分析フレームワーク(産業魅力度分析)
- 世界のバリューチェーン分析
- 市場力学(DROs)
- 情報源と参考文献
- 図表一覧
- 主要洞察
- データパック
- 用語集
目次
Product Code: 56597
The Dry Mix Mortar Market size is estimated at 350.93 million Tons in 2024, and is expected to reach 482.16 million Tons by 2030, growing at a CAGR of 5.44% during the forecast period (2024-2030).
Growing commercial constructions in emerging countries, such as India's Grade A office, are expected to reach 1.2 billion square feet by 2030, augmenting the market's growth
- In 2022, global consumption of dry mix mortar saw a modest growth rate of 0.64%, driven by heightened demand from the infrastructure and commercial construction sectors. Notably, the infrastructure and commercial sectors saw growth rates of 3.42% and 1.0%, respectively, in 2022, compared to 2021. The global dry mix mortar market was projected to grow by approximately 4.29% in 2023.
- With a share of 62.34% in 2022, the residential sector stands as the largest consumer of dry mix mortar. Factors such as urbanization, government initiatives, and both foreign and domestic investments are fueling the demand for housing, leading to a surge in residential building construction. For example, Germany is set to construct a minimum of 4.0 thousand new housing units by 2024, while the Malaysian government aims to build around 500 thousand affordable housing units by 2025. Consequently, the dry mix mortar market for the residential sector is projected to witness a CAGR of 5.43% from 2023 to 2030.
- The commercial sector is poised to be the fastest-growing consumer of dry mix mortar, with a forecasted CAGR of 6.52%. This surge is attributed to the rising demand for shopping malls, office spaces, and other commercial structures. Highlighting this trend, India's Grade A office market in its top seven cities is expected to expand to approximately 1 billion square feet by 2026 and further to 1.2 billion square feet by 2030. In addition, the global commercial new floor area is projected to witness a substantial increase of 2.50 billion sq. ft. in 2030 compared to 2023. As a result, the global dry mix mortar consumption for the commercial sector is estimated to rise by 149 million tons from 2023 to 2030.
Fast-paced construction activities in the Asia-Pacific and South America predicted to bolster the demand for dry-mix mortar
- Dry-mix mortar plays a crucial role in both commercial and residential construction, finding applications in stucco, grouts, tile adhesives, and joint fillers. In 2022, the global dry-mix mortar market recorded a modest 0.64% growth in volume, a slowdown attributed to factors like inflation, surging raw material costs, and an impending recession. These challenges led to a dip in construction investments and project delays, dampening the demand for dry-mix mortar. However, a rebound was predicted, with the North American market poised to lead the way, projecting a 4.95% growth in volume from 2022 to 2023.
- Asia-Pacific held a dominant position in the dry-mix mortar market in 2022, accounting for a significant 130 million tons of the global share. Notably, countries like China, Japan, and India played pivotal roles in shaping this demand. In 2022, China's public spending on transport infrastructure rose to USD 165.6 billion, up from USD 157.6 billion in 2021. Japan witnessed a surge in manufacturing facility constructions, while India aimed to bolster its transportation network and provide affordable housing, fueling the construction sector's expansion.
- The Asia-Pacific region is poised to witness the highest growth rate, registering a CAGR of 6.09% in dry-mix mortar volume. South America follows closely, registering a CAGR of 5.54% during the forecast period. With governments and foreign investments backing major projects, the residential, infrastructure, and commercial construction sectors are expected to flourish, driving the demand for dry-mix mortar.
Global Dry Mix Mortar Market Trends
Asia-Pacific's surge in large-scale office building projects is set to elevate the global floor area dedicated to commercial construction
- In 2022, the global new floor area for commercial construction witnessed a modest growth of 0.15% from the previous year. Europe stood out with a significant surge of 12.70%, driven by a push for high-energy-efficient office buildings to align with its 2030 carbon emission targets. As employees returned to offices, European companies, resuming lease decisions, spurred the construction of 4.5 million square feet of new office space in 2022. This momentum is poised to persist in 2023, with a projected global growth rate of 4.26%.
- The COVID-19 pandemic caused labor and material shortages, leading to cancellations and delays in commercial construction projects. However, as lockdowns eased and construction activities resumed, the global new floor area for commercial construction surged by 11.11% in 2021, with Asia-Pacific taking the lead with a growth rate of 20.98%.
- Looking ahead, the global new floor area for commercial construction is set to achieve a CAGR of 4.56%. Asia-Pacific is anticipated to outpace other regions, with a projected CAGR of 5.16%. This growth is fueled by a flurry of commercial construction projects in China, India, South Korea, and Japan. Notably, major Chinese cities like Beijing, Shanghai, Hong Kong, and Taipei are gearing up for an uptick in Grade A office space construction. Additionally, India is set to witness the opening of approximately 60 shopping malls, spanning 23.25 million square feet, in its top seven cities between 2023 and 2025. Collectively, these endeavors across Asia-Pacific are expected to add a staggering 1.56 billion square feet to the new floor area for commercial construction by 2030, compared to 2022.
South America's estimated fastest growth in residential constructions due to increasing government investments in schemes for affordable housing to boost the global residential sector
- In 2022, the global new floor area for residential construction declined by around 289 million square feet compared to 2021. This can be attributed to the housing crisis generated due to the shortage of land, labor, and unsustainably high construction materials prices. This crisis severely impacted Asia-Pacific, where the new floor area declined 5.39% in 2022 compared to 2021. However, a more positive outlook is expected in 2023 as the global new floor area is predicted to grow by 3.31% compared to 2022, owing to government investments that can finance the construction of new affordable homes capable of accommodating 3 billion people by 2030.
- The COVID-19 pandemic caused an economic slowdown, due to which many residential construction projects got canceled or delayed, and the global new floor area declined by 4.79% in 2020 compared to 2019. As the restrictions were lifted in 2021 and pent-up demand for housing projects was released, new floor area grew 11.22% compared to 2020, with Europe having the highest growth of 18.28%, followed by South America, which rose 17.36% in 2021 compared to 2020.
- The global new floor area for residential construction is expected to register a CAGR of 3.81% during the forecast period, with South America predicted to develop at the fastest CAGR of 4.05%. Schemes and initiatives like the Minha Casa Minha Vida in Brazil announced in 2023 with a few regulatory changes, for which the government plans an investment of USD 1.98 billion to provide affordable housing units for low-income families, and the FOGAES in Chile also publicized in 2023, with an initial investment of USD 50 million, are aimed at providing mortgage loans to families for affordable housing and will encourage the construction of new residential units.
Dry Mix Mortar Industry Overview
The Dry Mix Mortar Market is fragmented, with the top five companies occupying 11.78%. The major players in this market are HANIL HOLDINGS CO.,LTD., MBCC Group, Saint-Gobain, SCG and Sika AG (sorted alphabetically).
Additional Benefits:
- The market estimate (ME) sheet in Excel format
- 3 months of analyst support
TABLE OF CONTENTS
1 EXECUTIVE SUMMARY & KEY FINDINGS
2 REPORT OFFERS
3 INTRODUCTION
- 3.1 Study Assumptions & Market Definition
- 3.2 Scope of the Study
- 3.3 Research Methodology
4 KEY INDUSTRY TRENDS
- 4.1 End Use Sector Trends
- 4.1.1 Commercial
- 4.1.2 Industrial and Institutional
- 4.1.3 Infrastructure
- 4.1.4 Residential
- 4.2 Major Infrastructure Projects (current And Announced)
- 4.3 Regulatory Framework
- 4.4 Value Chain & Distribution Channel Analysis
5 MARKET SEGMENTATION (includes market size, forecasts up to 2030 and analysis of growth prospects.)
- 5.1 End Use Sector
- 5.1.1 Commercial
- 5.1.2 Industrial and Institutional
- 5.1.3 Infrastructure
- 5.1.4 Residential
- 5.2 Application
- 5.2.1 Concrete Protection and Renovation
- 5.2.2 Grouts
- 5.2.3 Insulation and Finishing Systems
- 5.2.4 Plaster
- 5.2.5 Render
- 5.2.6 Tile Adhesive
- 5.2.7 Water Proofing Slurries
- 5.2.8 Other Applications
- 5.3 Region
- 5.3.1 Asia-Pacific
- 5.3.1.1 By Country
- 5.3.1.1.1 Australia
- 5.3.1.1.2 China
- 5.3.1.1.3 India
- 5.3.1.1.4 Indonesia
- 5.3.1.1.5 Japan
- 5.3.1.1.6 Malaysia
- 5.3.1.1.7 South Korea
- 5.3.1.1.8 Thailand
- 5.3.1.1.9 Vietnam
- 5.3.1.1.10 Rest of Asia-Pacific
- 5.3.2 Europe
- 5.3.2.1 By Country
- 5.3.2.1.1 France
- 5.3.2.1.2 Germany
- 5.3.2.1.3 Italy
- 5.3.2.1.4 Russia
- 5.3.2.1.5 Spain
- 5.3.2.1.6 United Kingdom
- 5.3.2.1.7 Rest of Europe
- 5.3.3 Middle East and Africa
- 5.3.3.1 By Country
- 5.3.3.1.1 Saudi Arabia
- 5.3.3.1.2 United Arab Emirates
- 5.3.3.1.3 Rest of Middle East and Africa
- 5.3.4 North America
- 5.3.4.1 By Country
- 5.3.4.1.1 Canada
- 5.3.4.1.2 Mexico
- 5.3.4.1.3 United States
- 5.3.5 South America
- 5.3.5.1 By Country
- 5.3.5.1.1 Argentina
- 5.3.5.1.2 Brazil
- 5.3.5.1.3 Rest of South America
- 5.3.1 Asia-Pacific
6 COMPETITIVE LANDSCAPE
- 6.1 Key Strategic Moves
- 6.2 Market Share Analysis
- 6.3 Company Landscape
- 6.4 Company Profiles
- 6.4.1 Ardex Group
- 6.4.2 CEMEX, S.A.B. de C.V.
- 6.4.3 Grupo Puma
- 6.4.4 HANIL HOLDINGS CO.,LTD.
- 6.4.5 Holcim
- 6.4.6 LATICRETE International, Inc.
- 6.4.7 MAPEI S.p.A.
- 6.4.8 MBCC Group
- 6.4.9 Saint-Gobain
- 6.4.10 SAMPYO GROUP
- 6.4.11 SCG
- 6.4.12 SIG
- 6.4.13 Sika AG
- 6.4.14 UltraTech Cement Ltd.
- 6.4.15 Votorantim Cimentos
7 KEY STRATEGIC QUESTIONS FOR CONCRETE, MORTARS AND CONSTRUCTION CHEMICALS CEOS
8 APPENDIX
- 8.1 Global Overview
- 8.1.1 Overview
- 8.1.2 Porter's Five Forces Framework (Industry Attractiveness Analysis)
- 8.1.3 Global Value Chain Analysis
- 8.1.4 Market Dynamics (DROs)
- 8.2 Sources & References
- 8.3 List of Tables & Figures
- 8.4 Primary Insights
- 8.5 Data Pack
- 8.6 Glossary of Terms

