
|
市場調査レポート
商品コード
1693686
アジア太平洋のドライミックスモルタル:市場シェア分析、産業動向・統計、成長予測(2025年~2030年)Asia-Pacific Dry Mix Mortar - Market Share Analysis, Industry Trends & Statistics, Growth Forecasts (2025 - 2030) |
||||||
カスタマイズ可能
適宜更新あり
|
|||||||
| アジア太平洋のドライミックスモルタル:市場シェア分析、産業動向・統計、成長予測(2025年~2030年) |
|
出版日: 2025年03月18日
発行: Mordor Intelligence
ページ情報: 英文 243 Pages
納期: 2~3営業日
|

全表示
- 概要
- 目次
概要
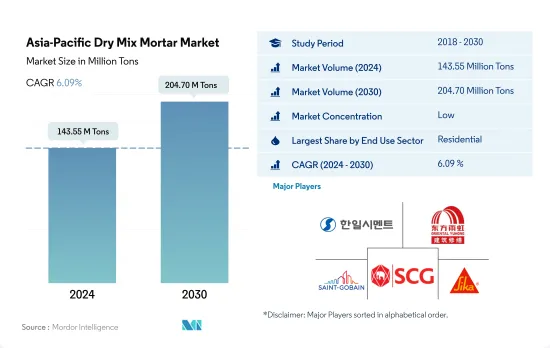
アジア太平洋地域のドライミックスモルタル市場規模は、2024年には1億4,355万トンと推定され、2030年には2億470万トンに達すると予測され、予測期間中(2024~2030年)のCAGRは6.09%で成長すると予測されます。
住宅需要の増加がドライミックスモルタルの成長を牽引しそうだ
- 2022年までに、アジア太平洋地域が世界のドライミックスモルタル市場の40.73%を占め、圧倒的なシェアを占めています。2023年、同地域のドライミックスモルタル消費量は、商業・住宅建設両部門の需要増に牽引され、数量ベースで4.07%増加しました。
- 2022年には、アジア太平洋地域の住宅部門がドライミックスモルタルの主要消費者として台頭し、市場の60.34%を占めました。都市化の進展、政府の取り組み、国内外からの投資といった要因が、この地域の住宅ニーズに拍車をかけた。例えば、インドネシア政府(GOI)は2025年までに100万戸の住宅建設を目標としており、同国の住宅総需要は3,000万戸に達すると予測されています。その結果、住宅部門におけるドライミックスモルタルの需要は、2023年の8,150万トンから2030年には1億1,970万トンに急増すると予測されました。
- アジア太平洋地域の商業セクターは、ドライミックスモルタルの消費量において最も高い成長率を示すと予測され、予測期間中のCAGRは7.64%でした。ショッピングモール、オフィススペース、小売センターの成長が見込まれ、2025年の商業床面積は前年比で1億7,800万平方フィート増加しました。例えば、インドの上位7都市におけるグレードAオフィス市場は、2026年までに10億平方フィートに拡大し、さらに2030年までに12億平方フィートに拡大すると予測されました。その結果、商業部門におけるドライミックスモルタルの需要は、2023年と比較して2030年までに1,395万トン増加すると推定されました。
建設セクターへの政府投資の増加によるアジア太平洋地域でのドライミックスモルタルの高い需要予測
- セメント、砂、鉱物、機能性添加物を正確な比率で配合したドライミックスモルタルは、コンクリート保護、改修、レンダリング、左官、防水などの用途があります。オーストラリアのドライミックスモルタル市場は、2022年に2021年比17.32%の大幅な数量増を記録しました。2023年、アジア太平洋地域は、住宅およびインフラ建設への旺盛な投資に牽引され、前年比4.07%の数量成長を遂げました。
- 2022年のアジア太平洋のドライミックスモルタル市場では、中国が大きなシェアを占めています。政府による封鎖にもかかわらず、中国のインフラ部門は2021年から2022年にかけて4.29%の数量成長を示しました。この成長は、輸送インフラ支出の顕著な増加によって促進され、2021年の1,576億米ドルから2022年には1,656億米ドルに増加しました。さらに、中国の住宅建設セクターは大幅な改革と政策変更を受け、不動産購入に対する消費者の関心が再燃しました。継続的な投資と取り組みにより、中国市場の2023年の数量成長率は3.83%となりました。
- インドネシアのドライミックスモルタル市場は、予測期間中、数量ベースで6.74%と最も速いCAGRを記録します。首都建設法案」の下、インドネシアは2045年までに首都をジャカルタからボルネオ島に移転する320億米ドルのプロジェクトに着手しました。この野心的な試みには集合住宅、製造ユニット、インフラが含まれ、ドライミックスモルタルの需要急増を示唆しています。
アジア太平洋のドライミックスモルタル市場動向
インドなどで小売店やオフィススペースが増加し、アジア太平洋地域の商業建設セクターを押し上げる
- 2022年、アジア太平洋地域の商業施設の新設床面積は前年比3.23%減少しました。この後退は、規制の圧力、インフレ率の上昇、住宅ローン金利の急上昇といった要因によるものです。2023年には、この地域は回復し、商業施設の新設床面積は約1億4,600万平方フィート増加しました。この急増は主に外国直接投資(FDI)の増加によるもので、新しいオフィス、倉庫、小売店、その他の施設の需要に拍車をかけた。特に、ベトナムの建設部門は2023年に7,144万米ドルのFDI資本を誘致しました。
- 2020年、アジア太平洋地域は商業施設の新設床面積で大幅な後退を経験し、2019年比で21.92%の数量減となりました。この減少の主な原因は、政府による封鎖が広まり、プロジェクト作業が中断され、サプライチェーン、設備、労働力に深刻な影響を与えたことです。しかし、規制が緩和されるにつれ、同地域は目覚ましい回復を見せ、2021年の商業施設の新設床面積は20.98%急増し、約5億2,600万平方フィートの床面積に達しました。
- アジア太平洋地域の商業用新設床面積は大幅な成長が見込まれ、2023年と比較して2030年には14億1,000万平方フィート増加すると推定されます。この急増は、ショッピングモール、オフィススペース、小売店などに対する需要の高まりに後押しされています。アジア太平洋地域は世界の小売大国として台頭しており、世界の小売成長の4分の3近くに寄与しています。例えば、インドのグレードAオフィス市場は、上位7都市で2026年までに10億平方フィート、さらに2030年までに12億平方フィートまで拡大する可能性があります。全体として、アジア太平洋地域の商業施設の新設床面積は、予測期間中にCAGR5.16%を記録すると予測されています。
インドでは2030年までに2,500万戸に達する可能性があるなど、手頃な価格の住宅が増加し、同地域の住宅建設が拡大します。
- 2022年、アジア太平洋地域の住宅着工床面積は前年比約5.39%減少しました。この落ち込みは、COVID-19の大流行時に建築活動が急増した後、セクターが正常化した結果です。この地域の住宅セクターは、人口の増加、富裕層の増加、急速な都市化によって牽引されています。同地域の住宅新築床面積は、2023年には2022年比で4億1,000万平方フィート増加すると予想されました。
- 2020年、アジア太平洋地域の住宅新設床面積は2019年比で約5.06%減少しました。これは主に、政府による封鎖、サプライチェーンの混乱、労働力不足、建設生産性の低下、外国投資の低迷によるものでした。しかし、規制が緩和されるにつれて、この地域では大幅な回復が見られ、2021年には住宅新設戸数の増加により住宅新設床面積が約14億平方フィート急増しました。例えば、2021年だけでも、インドの住宅不動産市場は上位7都市で約16万3,000戸の新築住宅を導入します。
- アジア太平洋地域の住宅新築床面積は、予測期間中にCAGR 3.98%を記録すると予測されます。この成長は、住宅需要、投資の増加、有利な政府政策によるものです。より手頃な価格の住宅建設に注力することで、同地域の住宅建設セクターは活気を取り戻し、回復の一助となることが期待されます。2030年までには、インド人口の40%以上が都市部に居住するようになると推定され、さらに2,500万戸の手頃な価格の住宅需要が見込まれます。この需要の急増により、インドの住宅不動産市場は2030年までに150万戸に達すると予想されています。
アジア太平洋のドライミックスモルタル産業の概要
アジア太平洋のドライミックスモルタル市場は断片化されており、上位5社で12.67%を占めています。この市場の主要企業は以下の通り。 HANIL HOLDINGS, Oriental Yuhong, Saint-Gobain, SCG and Sika AG(sorted alphabetically).
その他の特典
- エクセル形式の市場予測(ME)シート
- 3ヶ月のアナリストサポート
目次
第1章 エグゼクティブサマリーと主な調査結果
第2章 レポートのオファー
第3章 イントロダクション
- 調査の前提条件と市場定義
- 調査範囲
- 調査手法
第4章 主要産業動向
- エンドユース分野の動向
- 商業
- 産業・施設
- インフラ
- 住宅
- 主要インフラプロジェクト(現在および発表済み)
- 規制の枠組み
- バリューチェーンと流通チャネル分析
第5章 市場セグメンテーション
- エンドユース分野
- 商業
- 産業・施設
- インフラ
- 住宅
- 用途
- コンクリートの保護と改修
- グラウト
- 断熱と仕上げシステム
- プラスター
- レンダー
- タイル接着剤
- 防水スラリー
- その他の用途
- 国名
- オーストラリア
- 中国
- インド
- インドネシア
- 日本
- マレーシア
- 韓国
- タイ
- ベトナム
- その他アジア太平洋地域
第6章 競合情勢
- 主要な戦略動向
- 市場シェア分析
- 企業情勢
- 企業プロファイル
- Asia Cement Co., Ltd.
- BBMG Corporation
- HANIL HOLDINGS CO.,LTD.
- MBCC Group
- Oriental Yuhong
- Saint-Gobain
- SAMPYO GROUP
- SCG
- Sika AG
- UltraTech Cement Ltd.
第7章 CEOへの主な戦略的質問
第8章 付録
- 世界概要
- 概要
- ファイブフォース分析フレームワーク(産業魅力度分析)
- 世界のバリューチェーン分析
- 市場力学(DROs)
- 情報源と参考文献
- 図表一覧
- 主要洞察
- データパック
- 用語集
目次
Product Code: 93365
The Asia-Pacific Dry Mix Mortar Market size is estimated at 143.55 million Tons in 2024, and is expected to reach 204.70 million Tons by 2030, growing at a CAGR of 6.09% during the forecast period (2024-2030).
Rising demand for housing units is likely to drive the dry mix mortar growth
- By 2022, Asia-Pacific dominated the global dry mix mortar market, accounting for 40.73% of the total share. In 2023, the region's dry mix mortar consumption grew by 4.07% in volume, driven by rising demand from both commercial and residential construction sectors.
- In 2022, the residential sector in Asia-Pacific emerged as the leading consumer of dry mix mortar, comprising 60.34% of the market. Factors such as increasing urbanization, government initiatives, and investments, both domestic and foreign, fueled the region's housing needs. For example, the Government of Indonesia (GOI) aimed to build 1 million housing units by 2025, with the country's total housing demand projected to hit 30 million units. Consequently, the demand for dry mix mortar in the residential sector was forecast to surge from 81.5 million tons in 2023 to 119.7 million tons in 2030.
- The commercial sector in Asia-Pacific was poised to witness the highest growth rate in dry mix mortar consumption, with a CAGR of 7.64% during the forecast period. Anticipated growth in shopping malls, office spaces, and retail centers led to a rise of 178 million sq. ft in commercial floor area in 2025 compared to the previous year. For instance, India's Grade A office market in its top seven cities was projected to expand to 1 billion square feet by 2026 and further to 1.2 billion square feet by 2030. Consequently, the demand for dry mix mortar in the commercial sector was estimated to increase by 13.95 million tons by 2030 compared to 2023.
High demand for dry-mix mortar forecast in Asia-pacific due to rising government investments in the construction sector
- Dry-mix mortar, comprising cement, sand, minerals, and functional additives in precise ratios, finds applications in concrete protection, renovation, rendering, plastering, and waterproofing. Australia's dry-mix mortar market witnessed a significant 17.32% volume growth in 2022 compared to 2021. In the year 2023, Asia-Pacific, driven by robust investments in residential and infrastructure construction, experienced a 4.07% volume growth over the previous year.
- In the year 2022, China held a substantial share of the Asia-Pacific dry-mix mortar market. Despite government-imposed lockdowns, China's infrastructure sector witnessed a 4.29% volume growth between 2021 and 2022. This growth was fueled by a notable increase in transport infrastructure spending, rising from USD 157.6 billion in 2021 to USD 165.6 billion in 2022. Additionally, the residential construction sector in China underwent significant reforms and policy changes, rekindling consumer interest in property purchases. With continued investments and initiatives, the Chinese market experienced a 3.83% volume growth in 2023.
- Indonesia's dry-mix mortar market is set to witness the fastest CAGR of 6.74% in volume during the forecast period. Under the "Capital City Bill," Indonesia embarked on a USD 32 billion project to relocate its capital from Jakarta to Borneo Island by the year 2045. This ambitious endeavor encompasses housing complexes, manufacturing units, and infrastructure, signaling a surge in dry-mix mortar demand.
Asia-Pacific Dry Mix Mortar Market Trends
Rising retail and office spaces in countries such as India to boost the Asia-Pacific commercial construction sector
- In 2022, Asia-Pacific witnessed a 3.23% decline in its commercial new floor area compared to the previous year. This setback was attributed to factors such as regulatory pressures, higher inflation, and a surge in mortgage rates. In 2023, the region rebounded, with commercial construction new floor area increasing by approximately 146 million sq. ft. This surge was primarily driven by a rise in foreign direct investment (FDI), which spurred the demand for new offices, warehouses, retail outlets, and other facilities. Notably, the Vietnamese construction sector attracted an FDI capital of USD 71.44 million in 2023.
- In 2020, the Asia-Pacific region experienced a significant setback in commercial new floor area, with a volume decline of 21.92% compared to 2019. This decline was primarily due to widespread government lockdowns, which disrupted project work and severely impacted supply chains, equipment, and labor. However, as restrictions eased, the region witnessed a remarkable rebound, with its commercial new floor area surging by 20.98% in 2021, reaching a volume of approximately 526 million sq. ft.
- Asia-Pacific's commercial new floor area is projected to witness substantial growth, with an estimated increase of 1.41 billion sq. ft by 2030 compared to 2023. This surge is fueled by a rising demand for shopping malls, office spaces, retail outlets, and more. The Asia-Pacific region is emerging as a global retail powerhouse, contributing to nearly three-quarters of the worldwide retail growth. For instance, the Indian Grade A office market in its top seven cities may to expand to 1 billion sq. ft by 2026 and further to 1.2 billion sq. ft. by 2030. Overall, the commercial new floor area in Asia-Pacific is projected to witness a volume CAGR of 5.16% during the forecast period.
Rising affordable housing units, such as India's likely to reach 25 million by 2030, to augment the residential constructions in the region
- In 2022, the residential new floor area in the Asia-Pacific region saw a volume decline of approximately 5.39% from the previous year. This dip was a result of the sector normalizing after a surge in building activity during the COVID-19 pandemic. The region's residential sector is driven by a growing population, increasing wealth, and rapid urbanization. The residential new floor area in the region was expected to rise by 410 million sq. ft in 2023 compared to 2022.
- In 2020, the residential new floor area in Asia-Pacific declined in volume by around 5.06% compared to 2019. This was primarily due to government-imposed lockdowns, disruptions in the supply chain, labor shortages, reduced construction productivity, and low foreign investments. However, as restrictions eased, the region saw a significant rebound, with the residential new floor area surging by about 1.4 billion sq. ft in 2021, driven by the addition of new residential housing units. For instance, in 2021 alone, the Indian residential real estate market introduced approximately 163 thousand new residential units across its top seven cities.
- The residential new floor area in the Asia-Pacific region is projected to witness a CAGR of 3.98% during the forecast period. This growth can be attributed to the demand for housing, increased investments, and favorable government policies. The focus on constructing more affordable housing units is expected to rejuvenate the residential construction sector in the region, aiding its recovery. By 2030, it is estimated that over 40% of India's population will reside in urban areas, leading to a demand for an additional 25 million affordable housing units. This surge in demand is expected to push the Indian residential real estate market to reach 1.5 million units by 2030.
Asia-Pacific Dry Mix Mortar Industry Overview
The Asia-Pacific Dry Mix Mortar Market is fragmented, with the top five companies occupying 12.67%. The major players in this market are HANIL HOLDINGS CO.,LTD., Oriental Yuhong, Saint-Gobain, SCG and Sika AG (sorted alphabetically).
Additional Benefits:
- The market estimate (ME) sheet in Excel format
- 3 months of analyst support
TABLE OF CONTENTS
1 EXECUTIVE SUMMARY & KEY FINDINGS
2 REPORT OFFERS
3 INTRODUCTION
- 3.1 Study Assumptions & Market Definition
- 3.2 Scope of the Study
- 3.3 Research Methodology
4 KEY INDUSTRY TRENDS
- 4.1 End Use Sector Trends
- 4.1.1 Commercial
- 4.1.2 Industrial and Institutional
- 4.1.3 Infrastructure
- 4.1.4 Residential
- 4.2 Major Infrastructure Projects (current And Announced)
- 4.3 Regulatory Framework
- 4.4 Value Chain & Distribution Channel Analysis
5 MARKET SEGMENTATION (includes market size, forecasts up to 2030 and analysis of growth prospects.)
- 5.1 End Use Sector
- 5.1.1 Commercial
- 5.1.2 Industrial and Institutional
- 5.1.3 Infrastructure
- 5.1.4 Residential
- 5.2 Application
- 5.2.1 Concrete Protection and Renovation
- 5.2.2 Grouts
- 5.2.3 Insulation and Finishing Systems
- 5.2.4 Plaster
- 5.2.5 Render
- 5.2.6 Tile Adhesive
- 5.2.7 Water Proofing Slurries
- 5.2.8 Other Applications
- 5.3 Country
- 5.3.1 Australia
- 5.3.2 China
- 5.3.3 India
- 5.3.4 Indonesia
- 5.3.5 Japan
- 5.3.6 Malaysia
- 5.3.7 South Korea
- 5.3.8 Thailand
- 5.3.9 Vietnam
- 5.3.10 Rest of Asia-Pacific
6 COMPETITIVE LANDSCAPE
- 6.1 Key Strategic Moves
- 6.2 Market Share Analysis
- 6.3 Company Landscape
- 6.4 Company Profiles
- 6.4.1 Asia Cement Co., Ltd.
- 6.4.2 BBMG Corporation
- 6.4.3 HANIL HOLDINGS CO.,LTD.
- 6.4.4 MBCC Group
- 6.4.5 Oriental Yuhong
- 6.4.6 Saint-Gobain
- 6.4.7 SAMPYO GROUP
- 6.4.8 SCG
- 6.4.9 Sika AG
- 6.4.10 UltraTech Cement Ltd.
7 KEY STRATEGIC QUESTIONS FOR CONCRETE, MORTARS AND CONSTRUCTION CHEMICALS CEOS
8 APPENDIX
- 8.1 Global Overview
- 8.1.1 Overview
- 8.1.2 Porter's Five Forces Framework (Industry Attractiveness Analysis)
- 8.1.3 Global Value Chain Analysis
- 8.1.4 Market Dynamics (DROs)
- 8.2 Sources & References
- 8.3 List of Tables & Figures
- 8.4 Primary Insights
- 8.5 Data Pack
- 8.6 Glossary of Terms

