
|
市場調査レポート
商品コード
1687088
欧州のデータセンター- 市場シェア分析、産業動向・統計、成長予測(2025年~2030年)Europe Data Center - Market Share Analysis, Industry Trends & Statistics, Growth Forecasts (2025 - 2030) |
||||||
カスタマイズ可能
適宜更新あり
|
|||||||
| 欧州のデータセンター- 市場シェア分析、産業動向・統計、成長予測(2025年~2030年) |
|
出版日: 2025年03月18日
発行: Mordor Intelligence
ページ情報: 英文 270 Pages
納期: 2~3営業日
|

全表示
- 概要
- 目次
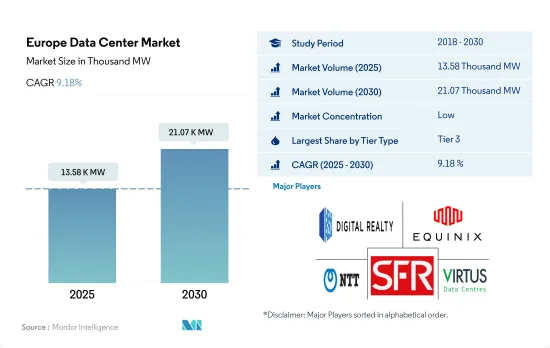
欧州のデータセンター市場規模は、2025年に1万3,580kWと推定され、2030年には2万1,070kWに達し、CAGR 9.18%で成長すると予測されます。
また、2025年には181億830万米ドルのコロケーション収益が見込まれ、2030年には350億3,370万米ドルに達すると予測され、予測期間(2025~2030年)のCAGRは14.11%です。
2023年にはティア3データセンターが数量ベースで大半のシェアを占め、予測期間中も支配的と予測される
- ティア3セグメントは、その特長が大きなメリットとなり、現在欧州でシェアの大半を占めています。これらのティアは、高い冗長性と電源と冷却のための複数の経路を備えています。これらのデータセンターの稼働率は約99.982%で、ダウンタイムは年間1.6時間です。エッジ接続やクラウド接続の採用が増加していることが、このセグメントの成長を押し上げると予想されます。
- 英国は国内最大数のティア3データセンターを擁しており、スラウとグレーター・ロンドンが大きなシェアを占めています。その他の主要拠点はフランス、ドイツ、アイルランドなどです。ダブリンはアイルランドでティア3データセンター施設の98%以上をホストしている唯一の地域で、北ダブリンと南ダブリンが大きなシェアを占めています。ティア3セグメントは2023年の7,979.69MWから2029年には1万2,110.18MWに成長すると予想され、CAGRは7.20%です。
- ティア4セグメントは、予測期間中に15.51%という最高のCAGRで推移すると予想されます。様々な先進諸国は、すべてのコンポーネントの完全なフォールトトレランスと冗長性という利点を得るために、ティア4認証の採用に注力しています。そのため、開発途上地域でもティア4ゾーンの採用が進んでいます。例えば、伝統的FLAP市場以外のティア2のメトロ市場は、初期の低いスタート地点から最も急速に容量が増加すると見られています。特に、バルセロナ、ミラノ、ローマのメトロ市場では、今後4年間でデータセンターの収容能力が3倍に増加すると予想されています。
- 現在、全トラフィックの70%以上がサーバーからサーバーへと移動しているため、ティア1と2のタイプは、最も少ない成長率を示しています。最新のアプリケーションでは、データセンター内をより高速で移動するために、より多くのデータが必要とされ、レイテンシーへのこだわりが強くなっています。
FLAP-Dのメトロ市場(フランクフルト、ロンドン/スロー、アムステルダム、パリ、ダブリンを含む)におけるデジタル化の採用が市場需要を増大
- 最大のデータセンター市場は、FLAP-Dメトロ市場(フランクフルト、ロンドン/スロ、アムステルダム、パリ、ダブリンを含む)がカバーしています。デジタルサービスや電力管理の導入が進む中、これらの国ではコロケーション施設の拡大が進んでいます。2022年8月、Greater London Authorityは、より良い電力管理規制で西ロンドンの電力危機に取り組み緩和するため、データセンター開発の申請プロセスを変更する計画を発表しました。
- ロンドンの地価は1平方フィート当たり150米ドル前後です。ロンドンの地価が高いため、同産業では地価の安い他の都市に投資がシフトすると予想されています。例えば、アムステルダムはFLAP-Dデータセンター市場において施設建設にかかる地価が安く、1平方フィート当たり38米ドルです。スペイン市場では多くのサードパーティDCプロジェクトが建設中で、マドリードとバルセロナで施設が開発されています。
- 再生可能エネルギーに関しては、FLAP-D市場では再生可能エネルギーは主に太陽光、風力、水力、海洋・波力、バイオエネルギーから生産されています。例えば、フランス政府は2022年4月、2030年国家投資計画に基づき、10億米ドル以上を投資する再生可能エネルギーイノベーションプロジェクト戦略を発表しました。
- FLAP-Dデータセンターハブは土地の不足と熟練労働力の不足に悩まされており、新興地域の脅威にさらされています。イタリア、ポーランド、ベルギー、スウェーデンのような国々が、今後成長を見せると予想されています。スウェーデンのデータセンター市場は、海底ケーブル接続に関して北欧地域で最も接続性の高い場所のひとつです。同国はデータセンター向けに地域暖房のコンセプトを採用しています。
欧州のデータセンター市場動向
OTTサブスクリプションとモバイルゲームの利用増加、ソーシャルメディアの普及がデータセンター市場を拡大
- 2025年までに、欧州における接続の85%近くをスマートフォンが占めると予想されます。西欧には世界有数のモバイルデータ消費者がいるが、中欧と東欧は世界平均に遅れをとっています。2021年、西欧ではモバイル機器からのトラフィックは月間4,189,615テラバイトに達します。スマートフォンやモバイルゲームのOTT契約数の増加による平均データ量の増加は、ゲームやビデオコンテンツのライブストリーミングのためのデータ処理とストレージ設備に対する需要をさらに押し上げています。デンマーク市場では、2021年のビデオに対する消費者支出総額が2020年比で11.8%増加しました。デンマークのビデオ市場は、2021年には45億9,100万デンマーククローネ(6億780万ユーロ)以上の規模に達します。
- OTTサービスの継続的な動向により、欧州諸国ではスマートフォン1台当たりのデータ通信量が増加しています。例えばデンマークでは、OTT契約数は2016年に210万件に達し、2021年には570万件に達します。スイスのソーシャルメディア利用者数は754万人で、2021~2022年にかけて44万人増加し、6.2%の伸びを示しています。データ消費量の増加、スマートフォンの利用時間、すべてのエンドユーザーにおけるデジタル化の進展といった要因が、スマートフォン1台当たりのデータ通信量の増加につながっています。
- データ消費量の大幅な増加はCOVID-19の流行後の2021年に観察され、この地域ではリモートワークの文化があるため、より多くのユーザーがスマートフォンに切り替えました。インターネット交換事業者であるDE-CIXを通じて交換されたデータは、2020年の32エクサバイトから2021年には38エクサバイト以上にデータスループットが増加したと報告されています。このような統計は、同地域におけるスマートフォン1台あたりのデータトラフィックが大幅に増加していることを示唆しています。
欧州ユーザーによるApp StoreやGoogle Playでの出費の増加、キャッシュレス取引によるデータセンター需要の増加
- 2021年、モバイル技術とサービスは欧州のGDPの約4.6%を生み出し、その経済価値は7,450億ユーロ以上に達します。欧州におけるスマートフォンの平均寿命は3年で、年間販売台数は約2億1,100万台です。
- 欧州では、2021年には4億7,400万人がモバイルサービスに加入していました。2025年には、この数は4億8,000万人に増加すると予測されています。地域事業者の3分の2以上が5Gネットワークを構築しており、欧州のほとんどの国が商用5Gサービスを導入しています。欧州では2025年までに3億1,100万件の5G接続が見込まれ、これは44%の普及率に相当します。2021年には、欧州のユーザーによるApp StoreとGoogle Playでの支出が183億米ドルに達しました。アプリ内課金、サブスクリプション、プレミアムアプリに対する顧客の支出別では、この予測は2020年からの年間総収入の22.8%増に相当します。欧州の支出は、2021年の世界のモバイルアプリ収入の約14%を占め、1,316億米ドルに達しました。
- スイスのインターネット普及率は2016年の89%から2021年には96%に増加し、同時にスマートフォンユーザー数は2016年の690万人から2021年には790万人に増加しました。このような広範な利用により、デジタル決済サービスが促進され、COVID-19の大流行によりその利用が増加しました。スイスではキャッシュレス決済を利用する人が増えています。スイス国民の35%だけが依然として現金での決済を好んでおり、キャッシュレス決済を選択する人が増えていることを示しています。こうした要因から、欧州市場ではスマートフォンの利用が増加しており、その結果、データが常に増加し、ストレージ容量が必要になっていることがわかる。
欧州のデータセンター産業概要
欧州のデータセンター市場は細分化されており、上位5社で28.90%を占めています。この市場の主要企業は、 Digital Realty Trust Inc.、Equinix Inc.、NTT Ltd、SOCIETE FRANCAISE DU RADIOTELEPHONE-SFR、Virtus Data Centres Properties Ltd(STT GDC)があります。
その他の特典
- エクセル形式の市場予測(ME)シート
- 3ヶ月間のアナリストサポート
目次
第1章 エグゼクティブサマリーと主要調査結果
第2章 レポートのオファー
第3章 イントロダクション
- 調査の前提条件と市場定義
- 調査範囲
- 調査手法
第4章 市場展望
- 耐荷重
- 床面積
- コロケーション収入
- 設置ラック数
- ラックスペース利用率
- 海底ケーブル
第5章 主要産業動向
- スマートフォンユーザー数
- スマートフォン1台当たりのデータトラフィック
- モバイルデータ速度
- ブロードバンドデータ速度
- 光ファイバー接続ネットワーク
- 規制の枠組み
- オーストリア
- ベルギー
- デンマーク
- フランス
- ドイツ
- アイルランド
- イタリア
- オランダ
- ノルウェー
- ポーランド
- ロシア
- スペイン
- スウェーデン
- スイス
- 英国
- バリューチェーンと流通チャネル分析
第6章 市場セグメンテーション
- データセンターの規模
- 大規模
- 超大規模
- 中規模
- メガ規模
- 小規模
- ティアタイプ
- ティア1と2
- ティア3
- ティア4
- 吸収量
- 非利用
- 利用
- コロケーションタイプ別
- ハイパースケール
- リテール
- ホールセール
- エンドユーザー別
- BFSI
- クラウド
- eコマース
- 政府機関
- 製造業
- メディア&エンターテイメント
- テレコム
- その他
- 国名
- フランス
- ドイツ
- アイルランド
- オランダ
- ノルウェー
- スペイン
- スイス
- 英国
- その他の欧州
第7章 競合情勢
- 市場シェア分析
- 企業情勢
- 企業プロファイル.
- CyrusOne Inc.
- Data4
- Digital Realty Trust Inc.
- Equinix Inc.
- Global Switch Holdings Limited
- Leaseweb Global BV
- NTT Ltd
- SOCIETE FRANCAISE DU RADIOTELEPHONE-SFR
- Stack Infrastructure Inc.
- Telehouse(KDDI Corporation)
- Vantage Data Centers LLC
- Virtus Data Centres Properties Ltd(STT GDC)
第8章 CEOへの主要戦略的質問
第9章 付録
- 世界概要
- 概要
- ファイブフォース分析フレームワーク
- 世界のバリューチェーン分析
- 世界市場規模とDRO
- 情報源と参考文献
- 図表リスト
- 主要洞察
- データパック
- 用語集
The Europe Data Center Market size is estimated at 13.58 thousand MW in 2025, and is expected to reach 21.07 thousand MW by 2030, growing at a CAGR of 9.18%. Further, the market is expected to generate colocation revenue of USD 18,108.3 Million in 2025 and is projected to reach USD 35,033.7 Million by 2030, growing at a CAGR of 14.11% during the forecast period (2025-2030).
Tier 3 data center accounted for majority share in terms of volume in 2023, and is expected to dominate through out the forecasted period
- The tier 3 segment currently has a majority of share in the European region due to the major advantage of its features. These tiers have a high redundancy level and multiple paths for power and cooling. These data centers have an uptime of around 99.982%, translating into a downtime of 1.6 hours per year. The increasing adoption of edge and cloud connectivity is expected to boost the segment's growth.
- The United Kingdom hosts the maximum number of tier 3 data centers in the country, with Slough and Greater London holding a major share. The other major locations are France, Germany, Ireland, and other countries. Dublin is the only region that hosts more than 98% of the tier 3 data center facilities in Ireland, with North and South Dublin holding a major share. The tier 3 segment is expected to grow from 7,979.69 MW in 2023 to 12,110.18 MW in 2029, with a CAGR of 7.20%.
- The tier 4 segment is expected to record the highest CAGR of 15.51% during the forecast period. Various developed countries are focusing on adopting Tier 4 certifications to get the advantage of complete fault tolerance and redundancy for every component. Thus, even the developing regions are adopting the tier 4 zone. For instance, the tier 2 metro markets, outside the traditional FLAP markets, are set to see the fastest capacity growth from a low initial starting point. In particular, the Barcelona, Milan, and Rome metro markets are expected to triple the amount of data center power over the next four years.
- Tier 1 & 2 types showcase the least majority growth as more than 70% of all traffic today moves from server to server. Modern applications require significantly more data to travel within a data center at faster speeds and are more particular about latency.
Adoption of digitization in FLAP-D metro markets (including Frankfurt, London/Slough, Amsterdam, Paris, and Dublin) increases the market demand
- The largest data center markets are covered by FLAP-D metro markets (including Frankfurt, London/Slough, Amsterdam, Paris, and Dublin). With the increasing adoption of digital services and power management, these countries are expanding their colocation facilities. In August 2022, the Greater London Authority announced plans to change the application process for data center development to tackle and ease the West London power crisis with better electricity management regulations.
- The land price in London is around USD 150 per sq. ft. The higher land cost in London is expected to shift investments to other cities in the industry with lower land prices. For instance, Amsterdam has a lower land price for building facilities in the FLAP-D data center market, which is USD 38 per sq. ft. The Spanish market has many third-party DC projects under construction, with facilities being developed in Madrid and Barcelona.
- In terms of renewable energy, in the FLAP-D market, renewable energy is majorly produced from solar, wind, hydroelectricity, marine and wave energy, and bioenergy. For instance, in April 2022, the French government announced a strategy for renewable energy innovation projects as per its 2030 national investment plan, with an investment of over USD 1 billion.
- As the FLAP-D data center hubs observe a lack of land availability and skilled workforce, they are under threat from emerging regions. Countries like Italy, Poland, Belgium, and Sweden are expected to showcase growth in the future. Sweden's data center market is one of the most connected locations in the Nordic region regarding subsea cable connectivity. The country has adopted the district heating concept for data centers.
Europe Data Center Market Trends
Increasing usage of OTT subscriptions and mobile gaming along with social media penetration increases the data center market
- By 2025, smartphones are expected to account for nearly 85% of connections in Europe. Western Europe is home to some of the world's biggest consumers of mobile data, while Central and Eastern Europe lag behind the global average. In 2021, in Western European, the traffic from mobile devices reached 4,189,615 terabytes per month. The growing average data volume due to rising OTT subscriptions for smartphones and mobile gaming is further driving the demand for data processing and storage facilities for live-streaming games and video content. The Danish market saw an 11.8% growth in total consumer spending on video in 2021 compared to 2020. The Danish video market represented a value of more than DKK 4,591 million (EUR 607.8 million) in 2021.
- The ongoing trend of OTT services is increasing data traffic per smartphone in European countries. For instance, in Denmark, OTT subscriptions reached 2.1 million in 2016 to 5.7 million in 2021. The number of social media users in Switzerland was 7.54 million, increasing by 440,000 between 2021 and 2022, indicating a 6.2% growth. Factors such as increased data consumption, time spent on smartphones, and growth of digitalization across all end users are leading to the rise in data traffic per smartphone.
- A major increase in data consumption was observed in 2021 after the COVID-19 pandemic, with more users switching to smartphones due to the remote working culture in the region. The data exchanged through the internet exchange operator, DE-CIX, reported an increase in data throughput from 32 exabytes in 2020 to more than 38 exabytes in 2021. Such statistics suggest the significant growth of data traffic per smartphone in the region.
Increasing spending by European users on the App Store and Google Play along with cashless transactions increases the Data Center demand
- In 2021, mobile technologies and services generated around 4.6% of the GDP in Europe, a contribution that amounted to more than EUR 745 billion of the economic value. The average lifespan of a smartphone in Europe is three years, with annual sales of almost 211 million units.
- In Europe, 474 million individuals were subscribers to mobile services in 2021. By 2025, this number is projected to increase to 480 million. Over two-thirds of regional operators have built 5G networks, and most European nations have implemented commercial 5G services. There may be 311 million 5G connections in Europe by 2025, representing a 44% adoption rate. The year 2021 witnessed USD 18.3 billion in spending by European users on the App Store and Google Play. Based on customer spending for in-app purchases, subscriptions, and premium apps, this prediction represented a 22.8% rise in yearly gross income from 2020. European spending accounted for approximately 14% of global mobile app revenue in 2021, which reached USD 131.6 billion.
- The internet penetration in Switzerland increased from 89% in 2016 to 96% in 2021, while at the same time, the number of smartphone users increased from 6.9 million in 2016 to 7.9 million in 2021. Owing to such extensive use, digital payment services were promoted, and their application increased due to the COVID-19 pandemic. More people in Switzerland are using cashless transactions. Only 35% of Swiss citizens still prefer cash as a form of payment, indicating that people are increasingly choosing cashless transactions, while the rest favor using a card or an app to pay. Such factors indicate the rising use of smartphones in the European market, resulting in a constant increase in data and necessitating a growing amount of storage space.
Europe Data Center Industry Overview
The Europe Data Center Market is fragmented, with the top five companies occupying 28.90%. The major players in this market are Digital Realty Trust Inc., Equinix Inc., NTT Ltd, SOCIETE FRANCAISE DU RADIOTELEPHONE - SFR and Virtus Data Centres Properties Ltd (STT GDC) (sorted alphabetically).
Additional Benefits:
- The market estimate (ME) sheet in Excel format
- 3 months of analyst support
TABLE OF CONTENTS
1 EXECUTIVE SUMMARY & KEY FINDINGS
2 REPORT OFFERS
3 INTRODUCTION
- 3.1 Study Assumptions & Market Definition
- 3.2 Scope of the Study
- 3.3 Research Methodology
4 MARKET OUTLOOK
- 4.1 It Load Capacity
- 4.2 Raised Floor Space
- 4.3 Colocation Revenue
- 4.4 Installed Racks
- 4.5 Rack Space Utilization
- 4.6 Submarine Cable
5 Key Industry Trends
- 5.1 Smartphone Users
- 5.2 Data Traffic Per Smartphone
- 5.3 Mobile Data Speed
- 5.4 Broadband Data Speed
- 5.5 Fiber Connectivity Network
- 5.6 Regulatory Framework
- 5.6.1 Austria
- 5.6.2 Belgium
- 5.6.3 Denmark
- 5.6.4 France
- 5.6.5 Germany
- 5.6.6 Ireland
- 5.6.7 Italy
- 5.6.8 Netherlands
- 5.6.9 Norway
- 5.6.10 Poland
- 5.6.11 Russia
- 5.6.12 Spain
- 5.6.13 Sweden
- 5.6.14 Switzerland
- 5.6.15 United Kingdom
- 5.7 Value Chain & Distribution Channel Analysis
6 MARKET SEGMENTATION (INCLUDES MARKET SIZE IN VOLUME, FORECASTS UP TO 2030 AND ANALYSIS OF GROWTH PROSPECTS)
- 6.1 Data Center Size
- 6.1.1 Large
- 6.1.2 Massive
- 6.1.3 Medium
- 6.1.4 Mega
- 6.1.5 Small
- 6.2 Tier Type
- 6.2.1 Tier 1 and 2
- 6.2.2 Tier 3
- 6.2.3 Tier 4
- 6.3 Absorption
- 6.3.1 Non-Utilized
- 6.3.2 Utilized
- 6.3.2.1 By Colocation Type
- 6.3.2.1.1 Hyperscale
- 6.3.2.1.2 Retail
- 6.3.2.1.3 Wholesale
- 6.3.2.2 By End User
- 6.3.2.2.1 BFSI
- 6.3.2.2.2 Cloud
- 6.3.2.2.3 E-Commerce
- 6.3.2.2.4 Government
- 6.3.2.2.5 Manufacturing
- 6.3.2.2.6 Media & Entertainment
- 6.3.2.2.7 Telecom
- 6.3.2.2.8 Other End User
- 6.4 Country
- 6.4.1 France
- 6.4.2 Germany
- 6.4.3 Ireland
- 6.4.4 Netherlands
- 6.4.5 Norway
- 6.4.6 Spain
- 6.4.7 Switzerland
- 6.4.8 United Kingdom
- 6.4.9 Rest of Europe
7 COMPETITIVE LANDSCAPE
- 7.1 Market Share Analysis
- 7.2 Company Landscape
- 7.3 Company Profiles (includes Global Level Overview, Market Level Overview, Core Business Segments, Financials, Headcount, Key Information, Market Rank, Market Share, Products and Services, and Analysis of Recent Developments).
- 7.3.1 CyrusOne Inc.
- 7.3.2 Data4
- 7.3.3 Digital Realty Trust Inc.
- 7.3.4 Equinix Inc.
- 7.3.5 Global Switch Holdings Limited
- 7.3.6 Leaseweb Global BV
- 7.3.7 NTT Ltd
- 7.3.8 SOCIETE FRANCAISE DU RADIOTELEPHONE - SFR
- 7.3.9 Stack Infrastructure Inc.
- 7.3.10 Telehouse (KDDI Corporation)
- 7.3.11 Vantage Data Centers LLC
- 7.3.12 Virtus Data Centres Properties Ltd (STT GDC)
- 7.4 LIST OF COMPANIES STUDIED
8 KEY STRATEGIC QUESTIONS FOR DATA CENTER CEOS
9 APPENDIX
- 9.1 Global Overview
- 9.1.1 Overview
- 9.1.2 Porter's Five Forces Framework
- 9.1.3 Global Value Chain Analysis
- 9.1.4 Global Market Size and DROs
- 9.2 Sources & References
- 9.3 List of Tables & Figures
- 9.4 Primary Insights
- 9.5 Data Pack
- 9.6 Glossary of Terms
