
|
市場調査レポート
商品コード
1685834
アジア太平洋地域のエンジニアリングプラスチック:市場シェア分析、産業動向・統計、成長予測(2024年~2029年)Asia-pacific Engineering Plastics - Market Share Analysis, Industry Trends & Statistics, Growth Forecasts (2024 - 2029) |
||||||
カスタマイズ可能
適宜更新あり
|
|||||||
| アジア太平洋地域のエンジニアリングプラスチック:市場シェア分析、産業動向・統計、成長予測(2024年~2029年) |
|
出版日: 2025年03月18日
発行: Mordor Intelligence
ページ情報: 英文 321 Pages
納期: 2~3営業日
|

全表示
- 概要
- 目次
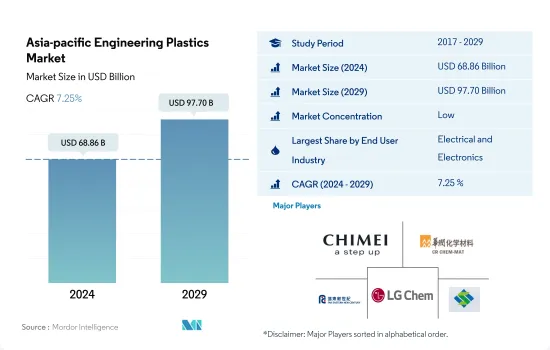
アジア太平洋地域のエンジニアリングプラスチック市場規模は2024年に688億6,000万米ドルと推定され、2029年には977億米ドルに達すると予測され、予測期間中(2024-2029年)のCAGRは7.25%で成長します。
包装業界は電気・電子業界に数量シェアを奪われる
- エンジニアリングプラスチックは汎用性が高く、航空宇宙の内装壁パネルやドアから硬質包装や軟質包装まで、あらゆる用途に使われています。アジア太平洋のエンジニアリングプラスチック市場は、主に包装、電気・電子、自動車産業が牽引しています。2022年には、エンジニアリングプラスチック市場全体の約43.80%を包装、31.32%を電気・電子が占める。
- 2020年には、世界のサプライチェーンの混乱により、全産業を合わせた消費収益は前年比6.02%減少しました。しかし、2021年に市場は回復し、2022年には7.18%増加し、安定した成長を続けた。
- 包装産業は、数量シェアではこの地域最大のエンドユーザー産業です。しかし、収益データによると、包装用途に広く使用されている他のエンジニアリングプラスチックの中でもPETの価格が比較的安いため、電気・電子産業がこの地域で最大のシェアを占めています。都市化と家族構成の著しい変化により、機能的で包装された便利な食品の需要が増加しています。例えば、アジア太平洋地域のプラスチック包装の生産量は2022年に6,800万トンに達し、世界全体の51%を占める。
- 電気・電子産業が最も有望な市場で、予測期間(2023~2029年)の収益と予測CAGRは8.21%です。同地域の電子部品生産収入は、スマート電子デバイスの需要増加、電気自動車、自律型ロボット、高度防衛技術などの需要拡大により、2029年までに6兆7,400億米ドルに達すると予測されます。
中国と日本が最大の需要創出国であり続ける
- アジア太平洋地域は、2022年のエンジニアリングプラスチックの世界消費量の56.7%を占めています。エンジニアリングプラスチックは、自動車、包装、電気・電子など様々な産業で用途を見出すことができるため、汎用性の高い特性を示します。
- 中国は、電気・電子、包装、自動車などの産業が成長しているため、この地域で最大のエンジニアリングプラスチック消費国です。2022年、中国の電気・電子産業は、アジア太平洋地域全体と比較して29.26%の収益シェアを占めました。中国における電気・電子部品生産からの収益は、2022年に29億2,000万米ドルを占めました。
- 日本はこの地域で2番目に大きなエンジニアリングプラスチックの消費国です。同国は、建設および電気・電子産業が急成長しているため、2022年には8.29%の売上シェアを記録しました。2022年、日本の建築・建設業界の新設床面積は、2021年に7.47%、2022年に4.11%の割合で増加しました。電気・電子部品の生産が増加していることから、同国では今後エンジニアリングプラスチックの需要が高まると予測されます。
- 中国は、自動車やエレクトロニクスなどの産業の急成長により、予測期間中に金額ベースでCAGR 7.50%となり、アジア太平洋地域のエンジニアリングプラスチック市場で最も速い成長を遂げると予想されます。2022年以降、中国は乗用車製造における外資規制を撤廃し、中国政府と自動車エンジニアリング企業との合弁事業への投資が50対50の比率で最大まで認められるようになりました。この変化は、投資拡大による中国自動車産業の成長機会をもたらします。
アジア太平洋地域のエンジニアリングプラスチック市場の動向
エレクトロニクス生産を促進するASEAN諸国の急成長
- アジア太平洋地域では、2020年から2021年にかけて電気・電子機器の生産収入が13.9%増加しました。エレクトロニクス部門は、ほとんどのアジア諸国の輸出総額の20~50%を占めています。テレビ、ラジオ、コンピューター、携帯電話などの家電製品の大部分はASEAN地域で生産されています。
- ASEANはハードディスク・ドライブの生産をリードしており、ハードディスク・ドライブの80%以上がASEAN域内で生産されています。全体として、ASEANの電気・電子(E&E)産業は、他の産業よりも外国からの投入物や技術に依存しており、E&E輸出の53%は、ASEANのE&E輸出に組み込まれた外国付加価値(FVA)または外国からの投入物から生じています。
- タイやマレーシアのような国々は、域内のエレクトロニクス生産をリードしています。東南アジア最大級の電子機器組立基地を有するタイは、ハードドライブ、集積回路、半導体の生産でリードしています。エアコン製造では第2位、世界の冷蔵庫市場では第4位です。
- エレクトロニクス産業は、中国や日本のようなアジアの経済大国との貿易改善を促進するASEANの統合生産ネットワークから大きな恩恵を受けています。
- 中国は電気製品の世界輸出で11.2%のシェアを占め、2019年から2020年にかけてデジタル製品の輸出で5.8%の成長を記録しました。アジア開発銀行によると、中国はこの地域の電子機器に大きな市場を提供しています。タイ、日本、中国、マレーシア、インド、フィリピンなどの国々は、エレクトロニクスの生産で引き続きこの地域をリードしています。
アジア太平洋地域のエンジニアリングプラスチックス産業の概要
アジア太平洋地域のエンジニアリングプラスチック市場は断片化されており、上位5社で22.59%を占めています。この市場の主要企業は以下の通りです。 CHIMEI, China Resources(Holdings), Far Eastern New Century Corporation, LG Chem and Sanfame Group(sorted alphabetically).
その他の特典
- エクセル形式の市場予測(ME)シート
- 3ヶ月のアナリストサポート
目次
第1章 エグゼクティブサマリーと主な調査結果
第2章 レポートのオファー
第3章 イントロダクション
- 調査の前提条件と市場定義
- 調査範囲
- 調査手法
第4章 主要産業動向
- エンドユーザー動向
- 航空宇宙
- 自動車
- 建築・建設
- 電気・電子
- 包装
- 輸出入動向
- フッ素樹脂貿易
- ポリアミド(PA)貿易
- ポリカーボネート(PC)貿易
- ポリエチレンテレフタレート(PET)の貿易
- ポリメチルメタクリレート(PMMA)の貿易
- ポリオキシメチレン(POM)貿易
- スチレン共重合体(ABSとSAN)の貿易
- 価格動向
- リサイクルの概要
- ポリアミド(PA)のリサイクル動向
- ポリカーボネート(PC)のリサイクル動向
- ポリエチレンテレフタレート(PET)のリサイクル動向
- スチレン系共重合体(ABS、SAN)のリサイクル動向
- 規制の枠組み
- オーストラリア
- 中国
- インド
- 日本
- マレーシア
- 韓国
- バリューチェーンと流通チャネル分析
第5章 市場セグメンテーション
- エンドユーザー産業
- 航空宇宙
- 自動車
- 建築・建設
- 電気・電子
- 工業・機械
- 包装
- その他エンドユーザー産業
- 樹脂タイプ
- フッ素樹脂
- サブタイプ別
- エチレンテトラフルオロエチレン(ETFE)
- フッ素化エチレンプロピレン(FEP)
- ポリテトラフルオロエチレン(PTFE)
- ポリフッ化ビニル(PVF)
- ポリフッ化ビニリデン(PVDF)
- その他のサブレジンタイプ
- 液晶ポリマー(LCP)
- ポリアミド(PA)
- サブレジンタイプ別
- アラミド
- ポリアミド(PA)6
- ポリアミド(PA)66
- ポリフタルアミド
- ポリブチレンテレフタレート(PBT)
- ポリカーボネート(PC)
- ポリエーテルエーテルケトン(PEEK)
- ポリエチレンテレフタレート(PET)
- ポリイミド(PI)
- ポリメチルメタクリレート(PMMA)
- ポリオキシメチレン(POM)
- スチレン共重合体(ABSおよびSAN)
- フッ素樹脂
- 国
- オーストラリア
- 中国
- インド
- 日本
- マレーシア
- 韓国
- その他アジア太平洋地域
第6章 競合情勢
- 主要な戦略動向
- 市場シェア分析
- 企業情勢
- 企業プロファイル.
- Asahi Kasei Corporation
- CHIMEI
- China Petroleum & Chemical Corporation
- China Resources(Holdings)Co.,Ltd.
- Covestro AG
- Far Eastern New Century Corporation
- Formosa Plastics Group
- LG Chem
- Lotte Chemical
- Mitsubishi Chemical Corporation
- Sanfame Group
- Sinochem
- Solvay
- Sumitomo Chemical Co., Ltd.
- Toray Industries, Inc.
第7章 CEOへの主な戦略的質問
第8章 付録
- 世界概要
- 概要
- ファイブフォース分析フレームワーク(産業魅力度分析)
- 世界のバリューチェーン分析
- 市場力学(DROs)
- 情報源と参考文献
- 図表一覧
- 主要洞察
- データパック
- 用語集
The Asia-pacific Engineering Plastics Market size is estimated at 68.86 billion USD in 2024, and is expected to reach 97.70 billion USD by 2029, growing at a CAGR of 7.25% during the forecast period (2024-2029).
Packaging industry to lose its volume share to electrical and electronics industry
- Engineering plastics are versatile, finding applications in everything from interior wall panels and doors in aerospace to rigid and flexible packaging. The Asia-Pacific engineering plastics market is primarily driven by the packaging, electrical and electronics, and automotive industries. In 2022, packaging and electrical and electronics accounted for approximately 43.80% and 31.32% of the total engineering plastics market volume, respectively.
- In 2020, the combined consumption revenue across all industries fell by 6.02% compared to the previous year due to disruptions in the global supply chain. However, the market recovered in 2021 and continued to grow steadily, increasing by 7.18% in 2022.
- The packaging industry is the largest end-user industry in the region in terms of volume share. However, according to revenue data, the electrical and electronics industry holds the largest share in the region due to the relatively low price of PET, among other engineering plastics, which are widely used in packaging applications. Significant changes in urbanization and family demographics have increased the demand for functional, prepackaged, and convenient food products. For instance, Asia-Pacific plastic packaging production reached a volume of 68 million tons in 2022, accounting for 51% of the global total.
- The electrical and electronic industry is the most promising market, with an expected CAGR of 8.21% by revenue during the forecast period (2023-2029). Electronics component production revenue in the region is projected to reach USD 6.74 trillion by 2029, driven by the increasing demand for smart electronic devices, the growing demand for electric vehicles, autonomous robots, and advanced defense technologies.
China and Japan to remain as largest demand generators
- Asia-Pacific accounted for 56.7% by volume of the consumption of engineering plastics globally in 2022. Engineering plastics exhibit versatile properties due to which they find applications in various industries, such as automotive, packaging, and electrical and electronics.
- China is the largest consumer of engineering plastics in the region owing to its growing electrical and electronics, packaging, automotive, and other industries. In 2022, the Chinese electrical and electronics industry held a revenue share of 29.26% compared to the overall Asia-Pacific region. In China, the revenue from electrical and electronic component production accounted for USD 2.92 billion in 2022.
- Japan is the second-largest consumer of engineering plastics in the region. The country registered a revenue share of 8.29% in 2022 due to its rapidly growing construction and electrical and electronics industries. In 2022, the new construction floor area of the Japanese building and construction industry increased at a rate of 7.47% and 4.11% in 2021 and 2022 by revenue, respectively. The rising electrical and electronics component production is projected to drive the demand for engineering plastics in the country in the future.
- China is expected to witness the fastest growth in the Asia-Pacific engineering plastics market, with a CAGR of 7.50% in terms of value during the forecast period, owing to the rapid growth of industries like automotive and electronics. From 2022 onward, China lifted the restrictions on foreign investment in passenger car manufacturing, allowing for maximum investment in joint ventures between the Chinese government and automotive engineering companies to reach a 50:50 ratio. This change presents an opportunity for growth in the Chinese automotive industry through increased investment.
Asia-pacific Engineering Plastics Market Trends
Rapid growth in ASEAN countries to foster electronics production
- The Asia-Pacific region saw an increase in electrical and electronics production revenue by 13.9% from 2020 to 2021. The electronics sector accounts for 20-50% of the total value of most Asian countries' exports. Consumer electronics such as televisions, radios, computers, and cellular phones are largely manufactured in the ASEAN region.
- ASEAN leads the production of hard drives, with over 80% of hard drives being manufactured in the region. Overall, the electrical and electronics (E&E) industry in ASEAN relies more on foreign inputs and technology than other industries, with 53% of E&E exports arising from foreign value added (FVA) or foreign inputs integrated into ASEAN's E&E exports.
- Countries like Thailand and Malaysia lead in the production of electronics in the region. Thailand, home to one of the largest electronics assembly bases in Southeast Asia, leads in the production of hard drives, integrated circuits, and semiconductors. It ranks second in manufacturing air conditioning units and fourth in the global refrigerators market.
- The electronics industry has greatly benefitted from ASEAN's integrated production networks, which foster improved trade with larger Asian economies like China and Japan.
- China held an 11.2% share of global exports in electrical products and registered a growth of 5.8% in the export of digital products from 2019 to 2020. According to the Asian Development Bank, China provides a large market for electronics in the region. Countries such as Thailand, Japan, China, Malaysia, India, and the Philippines continue to lead the region in the production of electronics.
APAC Engineering Plastics Industry Overview
The Asia-pacific Engineering Plastics Market is fragmented, with the top five companies occupying 22.59%. The major players in this market are CHIMEI, China Resources (Holdings) Co.,Ltd., Far Eastern New Century Corporation, LG Chem and Sanfame Group (sorted alphabetically).
Additional Benefits:
- The market estimate (ME) sheet in Excel format
- 3 months of analyst support
TABLE OF CONTENTS
1 EXECUTIVE SUMMARY & KEY FINDINGS
2 REPORT OFFERS
3 INTRODUCTION
- 3.1 Study Assumptions & Market Definition
- 3.2 Scope of the Study
- 3.3 Research Methodology
4 KEY INDUSTRY TRENDS
- 4.1 End User Trends
- 4.1.1 Aerospace
- 4.1.2 Automotive
- 4.1.3 Building and Construction
- 4.1.4 Electrical and Electronics
- 4.1.5 Packaging
- 4.2 Import And Export Trends
- 4.2.1 Fluoropolymer Trade
- 4.2.2 Polyamide (PA) Trade
- 4.2.3 Polycarbonate (PC) Trade
- 4.2.4 Polyethylene Terephthalate (PET) Trade
- 4.2.5 Polymethyl Methacrylate (PMMA) Trade
- 4.2.6 Polyoxymethylene (POM) Trade
- 4.2.7 Styrene Copolymers (ABS and SAN) Trade
- 4.3 Price Trends
- 4.4 Recycling Overview
- 4.4.1 Polyamide (PA) Recycling Trends
- 4.4.2 Polycarbonate (PC) Recycling Trends
- 4.4.3 Polyethylene Terephthalate (PET) Recycling Trends
- 4.4.4 Styrene Copolymers (ABS and SAN) Recycling Trends
- 4.5 Regulatory Framework
- 4.5.1 Australia
- 4.5.2 China
- 4.5.3 India
- 4.5.4 Japan
- 4.5.5 Malaysia
- 4.5.6 South Korea
- 4.6 Value Chain & Distribution Channel Analysis
5 MARKET SEGMENTATION (includes market size in Value in USD and Volume, Forecasts up to 2029 and analysis of growth prospects)
- 5.1 End User Industry
- 5.1.1 Aerospace
- 5.1.2 Automotive
- 5.1.3 Building and Construction
- 5.1.4 Electrical and Electronics
- 5.1.5 Industrial and Machinery
- 5.1.6 Packaging
- 5.1.7 Other End-user Industries
- 5.2 Resin Type
- 5.2.1 Fluoropolymer
- 5.2.1.1 By Sub Resin Type
- 5.2.1.1.1 Ethylenetetrafluoroethylene (ETFE)
- 5.2.1.1.2 Fluorinated Ethylene-propylene (FEP)
- 5.2.1.1.3 Polytetrafluoroethylene (PTFE)
- 5.2.1.1.4 Polyvinylfluoride (PVF)
- 5.2.1.1.5 Polyvinylidene Fluoride (PVDF)
- 5.2.1.1.6 Other Sub Resin Types
- 5.2.2 Liquid Crystal Polymer (LCP)
- 5.2.3 Polyamide (PA)
- 5.2.3.1 By Sub Resin Type
- 5.2.3.1.1 Aramid
- 5.2.3.1.2 Polyamide (PA) 6
- 5.2.3.1.3 Polyamide (PA) 66
- 5.2.3.1.4 Polyphthalamide
- 5.2.4 Polybutylene Terephthalate (PBT)
- 5.2.5 Polycarbonate (PC)
- 5.2.6 Polyether Ether Ketone (PEEK)
- 5.2.7 Polyethylene Terephthalate (PET)
- 5.2.8 Polyimide (PI)
- 5.2.9 Polymethyl Methacrylate (PMMA)
- 5.2.10 Polyoxymethylene (POM)
- 5.2.11 Styrene Copolymers (ABS and SAN)
- 5.2.1 Fluoropolymer
- 5.3 Country
- 5.3.1 Australia
- 5.3.2 China
- 5.3.3 India
- 5.3.4 Japan
- 5.3.5 Malaysia
- 5.3.6 South Korea
- 5.3.7 Rest of Asia-Pacific
6 COMPETITIVE LANDSCAPE
- 6.1 Key Strategic Moves
- 6.2 Market Share Analysis
- 6.3 Company Landscape
- 6.4 Company Profiles (includes Global Level Overview, Market Level Overview, Core Business Segments, Financials, Headcount, Key Information, Market Rank, Market Share, Products and Services, and Analysis of Recent Developments).
- 6.4.1 Asahi Kasei Corporation
- 6.4.2 CHIMEI
- 6.4.3 China Petroleum & Chemical Corporation
- 6.4.4 China Resources (Holdings) Co.,Ltd.
- 6.4.5 Covestro AG
- 6.4.6 Far Eastern New Century Corporation
- 6.4.7 Formosa Plastics Group
- 6.4.8 LG Chem
- 6.4.9 Lotte Chemical
- 6.4.10 Mitsubishi Chemical Corporation
- 6.4.11 Sanfame Group
- 6.4.12 Sinochem
- 6.4.13 Solvay
- 6.4.14 Sumitomo Chemical Co., Ltd.
- 6.4.15 Toray Industries, Inc.
7 KEY STRATEGIC QUESTIONS FOR ENGINEERING PLASTICS CEOS
8 APPENDIX
- 8.1 Global Overview
- 8.1.1 Overview
- 8.1.2 Porter's Five Forces Framework (Industry Attractiveness Analysis)
- 8.1.3 Global Value Chain Analysis
- 8.1.4 Market Dynamics (DROs)
- 8.2 Sources & References
- 8.3 List of Tables & Figures
- 8.4 Primary Insights
- 8.5 Data Pack
- 8.6 Glossary of Terms
