
データセンター:市場シェア分析、業界動向と統計、成長予測(2026年~2031年)
Data Center - Market Share Analysis, Industry Trends & Statistics, Growth Forecasts (2026 - 2031)- 発行日
- ページ情報
- 英文 173 Pages
- 納期
- 2~3営業日
- 商品コード
- 2035038
- カスタマイズ可能 お客様のご希望に応じて、既存データの加工や未掲載情報(例:国別セグメント)の追加などの対応が可能です。詳細はお問い合わせください。
- 適宜更新あり 本レポートは最新情報反映のため適宜更新し、内容構成変更を行う場合があります。ご検討の際はお問い合わせください。
- 翻訳ツール提供対象 PDF対応AI翻訳ツールの無料貸し出しサービスのご利用が可能です
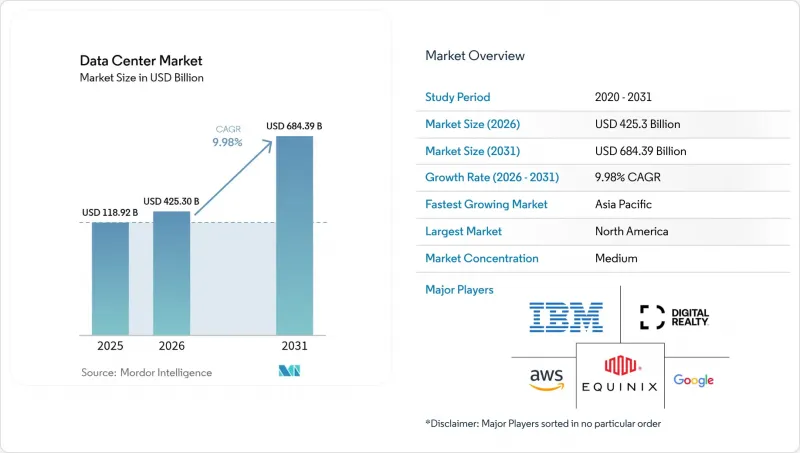
データセンター市場の規模は、2025年に3,867億1,000万米ドルと評価され、予測期間(2026年~2031年)においてCAGR9.98%で拡大し、2026年の4,253億米ドルから2031年には6,843億9,000万米ドルに達すると推定されています。
導入ベースに関しては、市場は2025年の11万8,920メガワットから2030年までに24万50メガワットへと拡大し、予測期間(2025年~2030年)におけるCAGRは15.08%になると見込まれています。市場セグメンテーションのシェアおよび予測値は、MW単位で算出・報告されています。この成長軌道は、急増する人工知能(AI)ワークロード、エッジノードの急速な展開、そしてデジタルインフラの経済性を変革しつつある資本集約的なハイパースケール・キャンパスなどを反映しています。エンタープライズコンピューティングは、液体冷却を必要とする高密度ラックへと移行しつつあり、一方で電力調達は、サイト選定における決定的な要因として浮上しています。大規模な低炭素電力を確保できる事業者は、特に金融サービスや生成AIを利用するテナントからの需要を大幅に獲得しています。データ居住地やカーボン報告に対する規制当局の注目が高まっていることから、新規の容量は二次都市圏や再生可能エネルギーが豊富な地域へと向かっており、データセンター市場全体における地理的な分散が拡大しています。
世界のデータセンター市場の動向とインサイト
AIおよびGPU集約型ワークロードの爆発的増加
大規模言語モデルのトレーニングクラスターが急増するにつれ、ラック密度は8~12kWから120kWへと高まっています。事業者各社は、液体冷却や浸漬冷却を標準化し、専用の変電所を設置し、数ギガワット規模の拡張が可能なキャンパス規模のサイトを設計しています。AIに最適化された容量を目的としたAmazonの1,500億米ドルといった設備投資のコミットメントは、現在必要とされている電力と不動産の規模を如実に示しています。低遅延かつ高密度の電力供給と、耐障害性のある冷却アーキテクチャを組み合わせたサービスを提供できるプロバイダーに競争上の優位性が生まれ、データセンター市場全体での統合動向を強めています。
クラウドおよびデジタルトランスフォーメーションの急速な普及
企業は、リフト・アンド・シフト型の移行から、分散処理に依存するクラウドネイティブなマイクロサービスへと移行しています。金融機関は決済および不正検知プラットフォームの近代化を進めており、複数のクラウドオンランプに接続されたキャリアニュートラルなコロケーションに対する持続的な需要を生み出しています。新興国におけるデータプライバシー規制は現地での施設拡張を促進している一方、ハイブリッドクラウド戦略は、データセンター市場全体での相互接続の選択肢を維持するために、コロケーション契約期間を長期化させています。
電力不足と電気料金の高騰
送電網の制約により、容量が逼迫している地域では、相互接続の承認が3年以上遅れています。電力会社は、大量の電力を消費するキャンパスに対応するために変電所を迅速にアップグレードすることに苦慮しており、ピーク時の料金体系が事業者の利益率を圧迫しています。開発業者は、オンサイト発電、蓄電池、再生可能エネルギーや小型モジュール炉(SMR)の容量に関する電力購入契約(PPA)で対応していますが、リードタイムや規制当局の認証は、データセンター市場全体において依然として大きな障害となっています。
セグメント分析
一般的に10~50MW規模の中規模サイトは、2025年の収益の60.10%を大規模キャンパスが占めたにもかかわらず、2031年までの予測において最も高いCAGR12.08%を記録しました。これらの施設は、AIクラスターが求める高密度ラックと迅速な展開のバランスを取っており、拡張性がありながらも柔軟な設置面積を必要とするクラウドやフィンテック企業のテナントにとって魅力的です。このセグメントの成長は、データセンター市場全体において、適正規模の容量ノードへの構造的な転換が進んでいることを示しています。
この勢いは、液体冷却ラック、オンサイトバッテリーストレージ、再生可能エネルギーによるマイクログリッドを統合した専用設計のキャンパスによってさらに強化されており、これにより事業者は電力密度を犠牲にすることなく、サステナビリティ目標を達成できるようになります。ハイパースケール企業が電力網の制約を緩和するためにサイト選定を多様化する中、中規模施設は、拡張の選択肢を維持しつつ、データセンター市場における収益化までの時間を短縮する暫定的な解決策を提供しています。
2025年の支出の59.10%を占めたのはTier 3ですが、2031年までの年間平均成長率(CAGR)は14.31%となり、Tier 4の収益がTier 3を上回ると予測されています。アルゴリズム取引、デジタルバンキング、AIモデルトレーニングにおけるゼロダウンタイム要件は、2N+1冗長性に関連する25%の設備投資プレミアムを正当化するものです。これらの仕様は参入障壁を高め、高可用性構築の資金調達能力を持つプロバイダーに需要を集中させるため、データセンター市場の規模階層においてTier 4へのシェアシフトをもたらします。
新興経済国では、国家決済システムやソブリンAIワークロード向けに耐障害性インフラを義務付ける新規規制が導入されたことで、成長が特に顕著です。早期にTier 4認定を取得した事業者は、企業がミッションクリティカルなアプリケーションをデータセンター市場内の認定施設へ移行する中で、圧倒的な価格決定力を享受し、強固な競争上の優位性を確立しています。
本データセンター市場レポートは、データセンター規模(大規模、超大規模、中規模、メガ、小規模)、ティアタイプ(Tier 1および2、Tier 3、Tier 4)、データセンタータイプ(ハイパースケール/自社建設、エンタープライズ/エッジ、コロケーション)、エンドユーザー(BFSI、ITおよびITES、Eコマース、政府、製造、メディア・エンターテインメント、通信、その他)、および地域別に分類されています。市場予測は、IT負荷容量(MW)単位で提供されています。
地域別分析
北米は、バージニア州北部、ダラス、フェニックス周辺の成熟したハイパースケール・エコシステムを背景に、2025年のシェア35.10%を維持しました。地域電力会社による28億2,000万米ドルの投資など、送電網のアップグレードは新たなメガワット規模の供給枠の開拓を目指していますが、一部のサブマーケットでは依然として相互接続の待ち時間が3年を超えています。事業者らは、再生可能エネルギーが豊富なオハイオ州、ミズーリ州、およびカナダの各州へと事業拠点を拡大しており、それによってデータセンター市場内での将来の拡張がより広範な地域に広がっています。
アジア太平洋地域は、国家主導のAI構想、eコマースの普及、およびデータローカライゼーションに関する法規制に後押しされ、CAGR11.34%という最も高い成長が見込まれています。インドのコロケーション施設の規模は過去18ヶ月間で約1GWへと倍増し、ジャカルタ、クアラルンプール、大阪の各都市では設置容量が300MWを超えました。個人データの国内保存を優先する国家政策や、再生可能エネルギー調達へのインセンティブが引き続き外国からの直接投資を呼び込み、データセンター市場における需要増加の中心地としての同地域の地位を強固なものにしています。
欧州、中東・アフリカでは、状況にばらつきが見られます。欧州の主要ハブは用地や電力の制約に直面しており、開発の焦点はマドリード、ミラノ、ワルシャワへと移りつつあります。同時に、アラゴン州のような再生可能エネルギーが豊富な地域では、国際的な事業者が資金を提供する300MW規模のプロジェクトを含む、ギガスケールのキャンパスが誘致されています。湾岸諸国は、低炭素電力とデジタル推進の政策を活用してハイパースケール施設の建設を獲得しており、一方、アフリカの主要都市では、新たな海底ケーブルの陸揚げに伴い容量を確保し、データセンター市場を形成する世界のクラウド基盤へと、徐々に大陸を組み込んでいます。
その他の特典:
- エクセル形式の市場予測(ME)シート
- 3ヶ月間のアナリストサポート
よくあるご質問
目次
第1章 イントロダクション
- 調査の前提条件と市場の定義
- 調査範囲
第2章 調査手法
第3章 エグゼクティブサマリー
第4章 市場情勢
- 市場概要
- 市場促進要因
- AIおよびGPU集約型ワークロードの爆発的増加
- クラウドおよびデジタルトランスフォーメーションの急速な普及
- エッジおよび5G低遅延需要の波
- 海底ケーブルの敷設拡大が二次沿岸地域の可能性を解き放つ
- オンサイトSMR電力PPAモデル
- 新興市場におけるカーボンクレジット対応改修
- 市場抑制要因
- 電力不足と電気料金の高騰
- ティア1ハブにおける用地および許認可のボトルネック
- 高度なアクセラレータに対する輸出規制
- 変圧器および開閉装置のリードタイムの長期化
- 市場見通し
- IT負荷容量
- 高床式フロア面積
- コロケーション収益
- 設置済みラック
- ラックスペース利用率
- 海底ケーブル
- 主要な業界動向
- スマートフォンユーザー
- スマートフォン1台あたりのデータトラフィック
- モバイルデータ通信速度
- ブロードバンドデータ通信速度
- 光ファイバー接続ネットワーク
- 規制の枠組み
- バリューチェーンおよび流通チャネル分析
- ポーターのファイブフォース分析
- 新規参入業者の脅威
- 買い手の交渉力
- 供給企業の交渉力
- 代替品の脅威
- 競争企業間の敵対関係
第5章 市場規模と成長予測(MW)
- データセンター規模別
- 大規模
- 巨大
- 中規模
- メガ
- 小規模
- ティアタイプ別
- ティア1および2
- ティア3
- ティア4
- データセンタータイプ別
- ハイパースケール/セルフビルド
- エンタープライズ/エッジ
- コロケーション
- 非利用
- 利用
- リテール・コロケーション
- ホールセール・コロケーション
- エンドユーザー別
- BFSI
- ITおよびITES
- Eコマース
- 政府
- 製造
- メディアとエンターテイメント
- 通信
- その他のエンドユーザー
- 地域別
- 北米
- 南米
- 欧州
- アジア太平洋地域
- 中東・アフリカ
第6章 競合情勢
- 市場集中度
- 戦略的動向
- 市場シェア分析
- 企業プロファイル
- Amazon Web Services, Inc.
- Google Inc.
- Microsoft Corporation
- Digital Realty Trust, Inc.
- CloudHQ
- CyrusOne
- Digital Bridge(Formely known as Switch)
- Stack Infrastructure
- QTS Realty Trust, LLC
- Quality Technology Services
- Equinix Inc
- Chindata Group Holdings Ltd
- Menlo Equities LLC
- Alibaba Cloud
- IBM Corporation
第7章 市場機会と将来の展望
- 発行日
- 発行
- Mordor Intelligence
- ページ情報
- 英文 173 Pages
- 納期
- 2~3営業日