|
|
市場調査レポート
商品コード
1636163
コンプライアンスカーボンクレジット:市場シェア分析、産業動向、成長予測(2025~2030年)Compliance Carbon Credit - Market Share Analysis, Industry Trends & Statistics, Growth Forecasts (2025 - 2030) |
||||||
|
|||||||
カスタマイズ可能
適宜更新あり
|
|||||||

| コンプライアンスカーボンクレジット:市場シェア分析、産業動向、成長予測(2025~2030年) |
|
出版日: 2025年01月05日
発行: Mordor Intelligence
ページ情報: 英文 120 Pages
納期: 2~3営業日
|

全表示
- 概要
- 目次
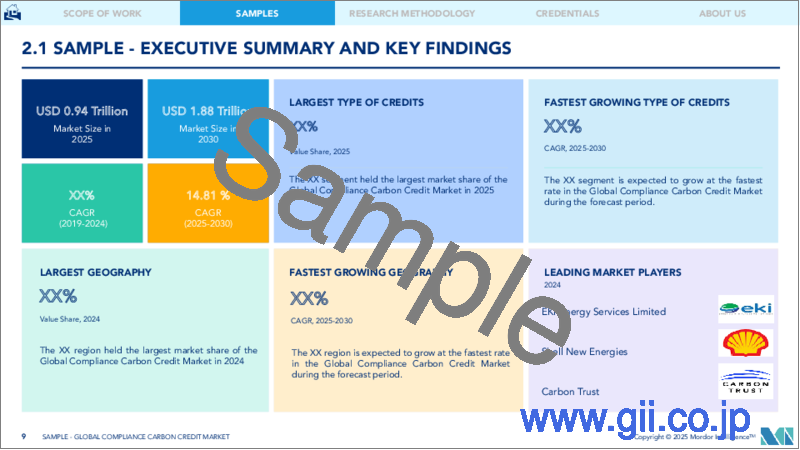
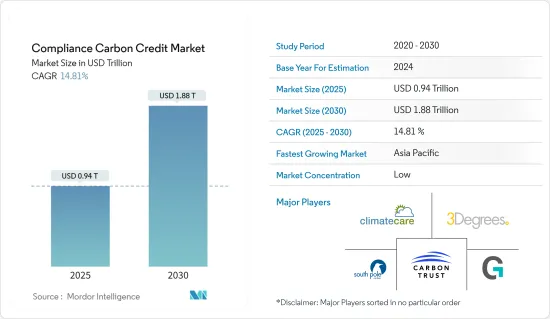
コンプライアンスカーボンクレジットの市場規模は、2025年に9,400億米ドルと予測され、予測期間(2025-2030年)のCAGRは14.81%で、2030年には1兆8,800億米ドルに達すると予測されます。
コンプライアンスカーボンクレジット市場は、排出量取引制度(ETS)やキャップ・アンド・トレード制度など、温室効果ガスの排出を制限する規制の枠組みの下で運営されています。その主な機能は、産業、発電所、運輸部門など排出規制の対象となる事業体が、カーボンクレジットを購入することで遵守義務を果たすためのメカニズムを提供することです。
排出権取引制度や規制の枠組みを導入している国や地域が異なるため、規制状況は多様です。主なコンプライアンス市場には、欧州連合排出量取引制度(EU ETS)、カリフォルニア州キャップ・アンド・トレード・プログラム、地域温室効果ガス・イニシアティブ(RGGI)、中国、韓国、ニュージーランドのさまざまな国家制度などがあります。
コンプライアンスカーボンクレジットは、再生可能エネルギー設備(風力、太陽光など)、エネルギー効率化イニシアティブ、林業・土地利用プロジェクト(植林、再植林など)、工業プロセスの改善など、さまざまな排出削減プロジェクトから創出されます。
コンプライアンスカーボンクレジット市場の動向
炭素価格決定の方向性を示すEU離脱後のUK-ETS
- 2020年のEU離脱後、英国はEU-ETSへの参加に代わって、炭素価格決定メカニズムであるUK-ETSを導入しました。この移行により、英国はEUから独立して排出量取引制度を確立し、炭素価格政策を設定することができるようになった。
- 英国の排出量取引制度(UK-ETS)で取引される排出枠(UKA)の価格は、2021年1月の開始以来、顕著な変動を経験しています。業界の専門家によると、価格は2022年8月19日に1トン当たり97.75英ポンドの高値をつけ、強い需要や規制要因が価格を押し上げていることを示しています。しかし、2023年5月31日には1トン当たり51.04英ポンドまで下落し、2022年1月以前の最低価格を記録しました。市場環境の変化、規制の調整、需給動態の変化など、さまざまな要因がこの価格下落に影響を与えた可能性があります。
- 2022年、UK-ETSは総額4.3英ポンドという大きな収益を生み出しました。この収益は、産業施設、発電所、その他排出量取引制度の対象となる部門を含む、英国内の規制対象事業体に対する炭素価格の財務的影響を表しています。炭素排出枠から得られる収益は、これらの事業体のコンプライアンス・コストを反映し、気候関連の取り組みや投資に充てる政府資金に貢献しています。
再生可能エネルギー発電への投資と技術革新がカーボンクレジット生成を促進する
- 多くのエネルギー会社は、二酸化炭素排出量を削減するために、風力、水力、太陽光発電などの再生可能エネルギーに投資しています。このようなクリーンなエネルギー発電へのシフトは、再生可能エネルギー・プロジェクトからコンプライアンスカーボンクレジットを創出する機会を生み出します。
- 例えば、チリは2024年2月、銅鉱山や化石燃料に依存する他の産業を脱炭素化するため、太陽光、風力、グリーン水素技術への投資家を欧州で募集しました。EUチリ貿易投資協定の再交渉中、102の公開会社および非公開会社を代表する水素協会H2Chileのマルコス・クルカ会長は、政府のエネルギー戦略を発表するために欧州を訪れました。
- さらに、業界の専門家は、ブロックチェーン技術がMRV(デジタル監視・報告・検証)システムと統合することで、炭素市場におけるカーボンクレジットの検証を強化できると考えています。MRVシステムは、衛星画像、IoTセンサー、モニタリングシステムなど様々なソースからデータを収集します。デジタルMRVデータはハッシュ化され、カーボンクレジットを検証するためにブロックチェーンにアップロードされます。スマート・コントラクトは、カーボンクレジットが特定の基準を満たすプロジェクトにのみ発行されるようにすることで、検証プロセスを自動化します。分散型オラクルを使用することで、検証プロセスにチェーン外の情報フィードを追加することができ、リアルタイムのカーボンクレジット検証が可能になります。
コンプライアンスカーボンクレジット業界の概要
様々な認証機関や標準化団体が、事前に定義された基準や手法に基づいて排出削減プロジェクトを認証し、カーボン・クレジットを発行しています。認証サービスを求めるプロジェクト開発者を惹きつけるために、認証機関間で競合が存在する可能性があり、認証手数料、スケジュール、評判の違いが認証機関の選択に影響します。カーボンクレジットの価格と市場力学は、時間経過とともに、また異なる市場間で大きく変動する可能性があり、価格設定、流動性、市場行動の分断につながります。このような変動は、市場参入企業にとって、市場の状況を効果的に予測し、ナビゲートすることを困難にします。カーボン・トラスト、クライメート・ケア、3Degreesなどが、カーボン・クレジット市場に参加しています。
その他の特典:
- エクセル形式の市場予測(ME)シート
- 3ヶ月間のアナリスト・サポート
目次
第1章 イントロダクション
- 調査の成果
- 調査の前提
- 調査範囲
第2章 調査手法
第3章 エグゼクティブサマリー
第4章 市場洞察
- 現在の市場シナリオ
- 技術動向
- 業界のバリューチェーン分析
- 政府の規制と取り組み
第5章 市場力学
- 促進要因
- 規制強化と政策
- 企業の持続可能性への取り組みの高まり
- 抑制要因
- 市場の複雑さと不確実性
- 機会
- イノベーションと技術の進歩
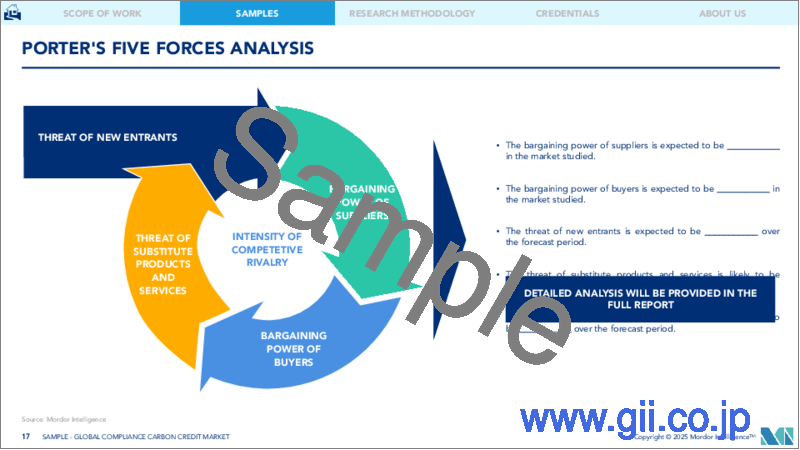
- 業界の魅力- ポーターのファイブフォース分析
- 供給企業の交渉力
- 消費者/買い手の交渉力
- 新規参入業者の脅威
- 代替品の脅威
- 競争企業間の敵対関係の強さ
第6章 市場セグメンテーション
- クレジットタイプ別
- 再生可能エネルギープロジェクト
- 林業と土地利用
- エネルギー効率
- 産業プロセス改善
- セクター別
- エネルギー部門
- 運輸部門
- 産業部門
- 農業・林業
- 地域別
- 北米
- 米国
- カナダ
- 欧州
- 英国
- ドイツ
- フランス
- その他欧州
- アジア太平洋
- 中国
- 日本
- インド
- 韓国
- その他アジア太平洋地域
- 中東・アフリカ
- ラテンアメリカ
- 北米
第7章 競合情勢
- 企業プロファイル
- Carbon Trust
- ClimateCare
- 3Degrees
- South Pole
- Gold Standard
- Natural Capital Partners
- Shell New Energies
- Sustainable Travel International
- Forest Carbon
- Atmosfair
- その他の企業
第8章 市場機会と今後の動向
第9章 付録
The Compliance Carbon Credit Market size is estimated at USD 0.94 trillion in 2025, and is expected to reach USD 1.88 trillion by 2030, at a CAGR of 14.81% during the forecast period (2025-2030).
The compliance carbon credit market operates under regulatory frameworks that limit greenhouse gas emissions, such as emissions trading schemes (ETS) or cap-and-trade systems. Its primary function is to provide a mechanism for entities subject to emissions regulations, such as industries, power plants, and transportation sectors, to meet compliance obligations by purchasing carbon credits.
Compliance carbon markets operate within a diverse regulatory landscape, with different jurisdictions implementing emissions trading schemes and regulatory frameworks. Major compliance markets include the European Union Emissions Trading System (EU ETS), the California Cap-and-Trade Program, the Regional Greenhouse Gas Initiative (RGGI), and various national schemes in China, South Korea, and New Zealand.
Compliance carbon credits are generated from various emission reduction projects, including renewable energy installations (e.g., wind, solar), energy efficiency initiatives, forestry and land-use projects (e.g., afforestation, reforestation), and industrial process improvements.
Compliance Carbon Credit Market Trends
Charting the Course of Carbon Pricing: UK-ETS Post-Brexit
- After leaving the European Union in 2020, the United Kingdom implemented its carbon pricing mechanism, the UK-ETS, which replaced its participation in the EU-ETS. This transition allowed the United Kingdom to establish its emissions trading system and set its carbon pricing policies independent of the European Union.
- The price of emissions allowances (UKAs) traded on the United Kingdom's Emissions Trading System (UK-ETS) has experienced notable fluctuations since its inception in January 2021. According to industry experts, the price reached a high of GBP 97.75 per metric ton on August 19, 2022, indicating strong demand or regulatory factors driving the price. However, by May 31, 2023, the price dropped to GBP 51.04 per metric ton, marking the lowest price before January 2022. Various factors, including changes in market conditions, regulatory adjustments, or shifts in supply and demand dynamics, could have influenced this decline in price.
- In 2022, the UK-ETS generated significant revenue, totaling GBP 4.3. This revenue represents the financial impact of carbon pricing on regulated entities within the United Kingdom, including industrial facilities, power plants, and other sectors covered by the emissions trading system. The revenue generated from carbon allowances reflects the cost of compliance for these entities and contributes to government funds dedicated to climate-related initiatives and investments.
Renewable Energy Investments and Technological Innovations Driving Carbon Credit Generation
- Many energy companies invest in renewable power sources, including wind, hydroelectric, and solar power, to reduce their carbon footprint. This shift toward cleaner energy production creates opportunities for generating compliance carbon credits from renewable energy projects.
- For instance, in February 2024, Chile embarked on a European hunt for investors in solar, wind, and green hydrogen technologies to decarbonize copper mines and other industries reliant on fossil fuels. During renegotiations of the EU Chile Trade and Investment Agreement, Marcos Kulka, president of H2Chile, a hydrogen association representing 102 publicly and privately owned companies, went to Europe to present his government's energy strategy.
- Further, Industry experts believe blockchain technology can enhance carbon credit validation in the carbon market by integrating with MRV (Digital Monitoring, Reporting, and Verification) systems. MRV systems collect data from various sources, including satellite images, IoT sensors, and monitoring systems. The digital MRV data is hashed and uploaded to the blockchain to verify carbon credits. Smart contracts automate the verification process by ensuring carbon credits are issued only to projects that fulfill specific criteria. Using decentralized oracles, off-chain information feeds can be added to the validation process, allowing for real-time carbon credit validation.
Compliance Carbon Credit Industry Overview
Various certification bodies and standards organizations certify emission reduction projects and issue carbon credits based on predefined criteria and methodologies. Competition may exist among certification bodies to attract project developers seeking certification services, with differences in certification fees, timelines, and reputation influencing their choice of certifier. Carbon credit prices and market dynamics can vary significantly over time and across different markets, leading to pricing, liquidity, and market behavior fragmentation. This variability can make it challenging for market participants to predict and navigate market conditions effectively. Some of the compliant carbon credit market players are Carbon Trust, ClimateCare, and 3Degrees.
Additional Benefits:
- The market estimate (ME) sheet in Excel format
- 3 months of analyst support
TABLE OF CONTENTS
1 INTRODUCTION
- 1.1 Study Deliverables
- 1.2 Study Assumptions
- 1.3 Scope of the Study
2 RESEARCH METHODOLOGY
3 EXECUTIVE SUMMARY
4 MARKET INSIGHTS
- 4.1 Current Market Scenario
- 4.2 Technological Trends
- 4.3 Industry Value Chain Analysis
- 4.4 Government Regulations and Initiatives
5 MARKET DYNAMICS
- 5.1 Drivers
- 5.1.1 Regulatory Mandates and Policies
- 5.1.2 Growing Corporate Sustainability Initiatives
- 5.2 Restraints
- 5.2.1 Market Complexity and Uncertainty
- 5.3 Opportunities
- 5.3.1 Innovation and Technology Advancements
- 5.4 Industry Attractiveness - Porter's Five Forces Analysis
- 5.4.1 Bargaining Power of Suppliers
- 5.4.2 Bargaining Power of Consumers / Buyers
- 5.4.3 Threat of New Entrants
- 5.4.4 Threat of Substitute Products
- 5.4.5 Intensity of Competitive Rivalry
6 MARKET SEGMENTATION
- 6.1 By Type of Credits
- 6.1.1 Renewable Energy Projects
- 6.1.2 Forestry and Land Use
- 6.1.3 Energy Efficiency
- 6.1.4 Industrial Process Improvements
- 6.2 By Sector
- 6.2.1 Energy Sector
- 6.2.2 Transportation
- 6.2.3 Industrial Sector
- 6.2.4 Agriculture and Forestry
- 6.3 By Geography
- 6.3.1 North America
- 6.3.1.1 United States
- 6.3.1.2 Canada
- 6.3.2 Europe
- 6.3.2.1 United Kingdom
- 6.3.2.2 Germany
- 6.3.2.3 France
- 6.3.2.4 Rest of Europe
- 6.3.3 Asia-Pacific
- 6.3.3.1 China
- 6.3.3.2 Japan
- 6.3.3.3 India
- 6.3.3.4 South Korea
- 6.3.3.5 Rest of Asia-Pacific
- 6.3.4 Middle East and Africa
- 6.3.5 Latin America
- 6.3.1 North America
7 COMPETITIVE LANDSCAPE
- 7.1 Overview (Market Concentration and Major Players)
- 7.2 Company Profiles
- 7.2.1 Carbon Trust
- 7.2.2 ClimateCare
- 7.2.3 3Degrees
- 7.2.4 South Pole
- 7.2.5 Gold Standard
- 7.2.6 Natural Capital Partners
- 7.2.7 Shell New Energies
- 7.2.8 Sustainable Travel International
- 7.2.9 Forest Carbon
- 7.2.10 Atmosfair*
- 7.3 Other Companies
