|
|
市場調査レポート
商品コード
1511333
コンプライアンス炭素クレジット市場の2030年までの予測: タイプ別、用途別、エンドユーザー別、地域別の世界分析Compliance Carbon Credit Market Forecasts to 2030 - Global Analysis By Type (Certified Emission Reductions, Emission Reduction Units, Removal Units and Other Types), Application, End User and By Geography |
||||||
|
|||||||
カスタマイズ可能
|
|||||||

| コンプライアンス炭素クレジット市場の2030年までの予測: タイプ別、用途別、エンドユーザー別、地域別の世界分析 |
|
出版日: 2024年07月06日
発行: Stratistics Market Research Consulting
ページ情報: 英文 200+ Pages
納期: 2~3営業日
|

全表示
- 概要
- 図表
- 目次
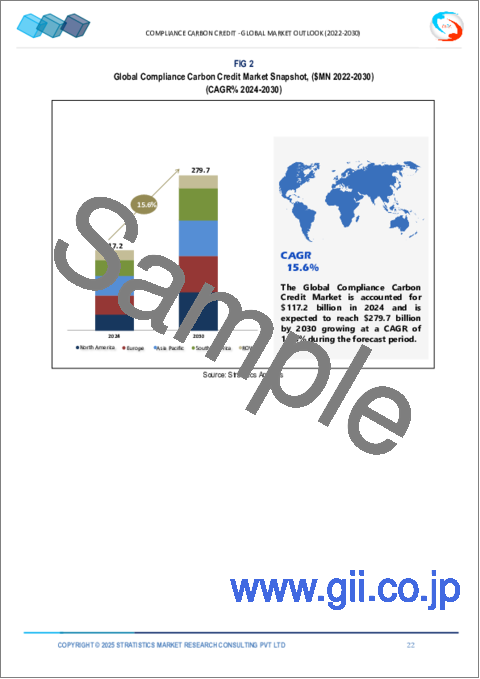
ストラティスティックスMRCによると、世界のコンプライアンス炭素クレジット市場は2024年に1,172億米ドルを占め、2030年までにCAGR15.6%で成長し、2,797億米ドルに達すると予測されています。
炭素クレジットは、1メートルトンの二酸化炭素またはその等価物を排出する権利を表す取引可能な許可証です。温室効果ガスの排出削減を目的とした炭素取引制度の主要な構成要素です。産業界や政府が排出削減目標を達成するための費用対効果の高い方法を模索する中で、炭素クレジット市場は大きく成長してきました。この成長は、気候変動に対する世界の意識の高まりと、市場ベースのメカニズムを通じてその影響を緩和しようとする努力を反映しています。
国際排出量取引協会(IETA)によると、カーボンプライシング・イニシアチブを導入している国や地域の数は大幅に増加しています。2016年には41カ国だったが、2022年には85カ国に増えています。さらに、独自のカーボンプライシングメカニズムの導入を積極的に検討している国や地域も増えています。
政府規制と炭素削減目標の増加
世界各国政府は、気候変動と闘うために、より厳しい排出規制を実施し、野心的な炭素削減目標を設定しています。このため、企業は義務付けられた排出制限を達成するための費用対効果の高い方法を模索し、コンプライアンス・カーボンクレジットへの需要が高まっています。カーボンプライシングメカニズムや排出量取引システムの範囲が地域間で拡大しているため、より多くの企業が炭素市場に参加せざるを得ず、市場の成長に拍車をかけています。規制が強化されるにつれ、企業は社内で容易に削減できない排出量を相殺するために、カーボン・クレジットを利用するようになっています。
標準化と透明性の欠如
コンプライアンス型炭素クレジット市場は、排出削減量の測定、報告、検証のための標準化された手法の欠如による課題に直面しています。炭素クレジットのルールや品質基準は管轄地域によって異なるため、一貫性と比較可能性を確保することが難しいです。炭素会計やオフセット・プロジェクトの複雑な性質は、排出削減の真の追加性や永続性についての懸念など、透明性の問題にもつながります。このような標準化と透明性の欠如は、市場の信頼を損ない、コンプライアンス・ツールとしての炭素クレジットの広範な採用を妨げる可能性があります。
技術の進歩
ブロックチェーンと分散型台帳技術は、炭素クレジットの透明性、トレーサビリティ、検証を改善することができます。高度なモニタリングとデータ分析ツールにより、排出削減量をより正確に測定することができます。人工知能と機械学習は、炭素クレジット取引とリスク管理を最適化することができます。これらの技術的進歩は、市場効率を高め、取引コストを削減し、炭素クレジットの完全性に対する信頼を高め、市場参加と流動性を拡大する可能性を秘めています。
炭素リーケージのリスク
炭素リーケージは、コンプライアンス型炭素クレジット市場の有効性に対する脅威となります。ある管轄区域における厳しい排出規制によって、企業が炭素集約的な事業をより規制の緩やかな地域に移転し、世界全体の排出量が増加する可能性があります。これは、炭素削減努力の環境保全性を損ない、競合を歪める可能性があります。
COVID-19の影響:
COVID-19の大流行は当初、炭素市場を混乱させ、経済活動と排出量の減少によるクレジット価格の急落を引き起こしました。しかし、経済が回復するにつれ、気候変動対策に再び注目が集まり、炭素クレジットに対する需要が増加しました。パンデミックは、レジリエンス(回復力)とサステナビリティ(持続可能性)の重要性を浮き彫りにし、グリーン復興への取り組みの一環として、コンプライアンス型炭素市場の長期的成長を加速させる可能性があった。
認証排出削減量(CERs)セグメントは予測期間中最大になると予想される
認証排出削減量(CERs)セグメントは、その国際的認知度とクリーン開発メカニズム(CDM)の下で確立された手法により、コンプライアンス・カーボンクレジット市場を独占する可能性が高いです。CERは、標準化され検証された排出削減アプローチを提供し、複数の管轄区域で受け入れられています。セクターや地域を超えて幅広く適用できることから、クレジットの買い手と売り手の双方にとって魅力的なものとなっています。国際的な炭素クレジットをコンプライアンス・メカニズムに組み込む国が増えるにつれて、高品質のCERに対する需要が高まり、市場での地位が確固たるものになると予想されます。
予測期間中にCAGRが最も高くなると予想される産業プロセス分野
産業プロセス分野は、エネルギー集約型産業に対する脱炭素化圧力の高まりにより、コンプライアンス炭素クレジット市場において急成長の構えを見せています。これらのセクターは、より厳しい排出規制に直面しているため、排出削減が困難な排出を相殺するために炭素クレジットを利用するようになっています。産業プロセスにおける技術革新もまた、排出削減とクレジット生成の新たな機会を生み出しています。この分野での大規模な排出削減の可能性は、規制の関心の高まりと相まって、産業用炭素クレジットプロジェクトへの投資を促進し、予測CAGRが最も高くなる要因となっています。
最大のシェアを持つ地域:
欧州は、確立されたEU排出権取引制度(EU ETS)と野心的な気候目標に牽引され、コンプライアンス型炭素クレジット市場における優位性を維持するとみられます。この地域の厳しい規制の枠組みは複数のセクターをカバーしており、炭素クレジットに対する一貫した需要を生み出しています。気候政策における欧州のリーダーシップと、2050年までにネットゼロ排出を達成するというコミットメントは、その市場での地位をさらに強固なものにしています。国際的なクレジットの統合と欧州各国におけるカーボンプライシングメカニズムの拡大は、この地域の大きな市場シェアと継続的な成長に寄与しています。
CAGRが最も高い地域:
アジア太平洋地域は、急速な工業化、環境意識の高まり、排出権取引システムの採用増加により、コンプライアンス型炭素クレジット市場で最も高いCAGRを経験すると予想されます。中国、韓国、日本のような国々は炭素市場を拡大しており、クレジット創出と取引の新たな機会を生み出しています。この地域の急速な経済成長と野心的な気候変動への取り組みは、費用対効果の高い排出削減ソリューションへの需要を促進しています。より多くのアジア諸国がカーボンプライシングメカニズムを導入するにつれて、この地域はコンプライアンス・カーボンクレジット分野の成長を加速させる態勢が整っています。
無料のカスタマイズサービス
本レポートをご購読のお客様には、以下の無料カスタマイズオプションのいずれかをご利用いただけます:
- 企業プロファイル
- 追加市場企業の包括的プロファイリング(3社まで)
- 主要企業のSWOT分析(3社まで)
- 地域セグメンテーション
- 顧客の関心に応じた主要国の市場推計・予測・CAGR(注:フィージビリティチェックによる)
- 競合ベンチマーキング
- 製品ポートフォリオ、地理的プレゼンス、戦略的提携に基づく主要企業のベンチマーキング
目次
第1章 エグゼクティブサマリー
第2章 序文
- 概要
- ステークホルダー
- 調査範囲
- 調査手法
- データマイニング
- データ分析
- データ検証
- 調査アプローチ
- 調査情報源
- 1次調査情報源
- 2次調査情報源
- 前提条件
第3章 市場動向分析
- 促進要因
- 抑制要因
- 機会
- 脅威
- 用途分析
- エンドユーザー分析
- 新興市場
- COVID-19の影響
第4章 ポーターのファイブフォース分析
- 供給企業の交渉力
- 買い手の交渉力
- 代替品の脅威
- 新規参入業者の脅威
- 競争企業間の敵対関係
第5章 世界のコンプライアンス炭素クレジット市場:タイプ別
- 認証排出削減量(CER)
- 排出削減単位(ERU)
- 除去ユニット(RMU)
- その他のタイプ
第6章 世界のコンプライアンス炭素クレジット市場:用途別
- 再生可能エネルギー
- エネルギー効率
- 燃料の切り替え
- 工業プロセス
- 農業と林業
第7章 世界のコンプライアンス炭素クレジット市場:エンドユーザー別
- 発電
- 製造業
- 化学・石油化学
- 石油ガス
- 交通機関
- その他のエンドユーザー
第8章 世界のコンプライアンス炭素クレジット市場:地域別
- 北米
- 米国
- カナダ
- メキシコ
- 欧州
- ドイツ
- 英国
- イタリア
- フランス
- スペイン
- その他欧州
- アジア太平洋
- 日本
- 中国
- インド
- オーストラリア
- ニュージーランド
- 韓国
- その他アジア太平洋
- 南米
- アルゼンチン
- ブラジル
- チリ
- その他南米
- 中東・アフリカ
- サウジアラビア
- アラブ首長国連邦
- カタール
- 南アフリカ
- その他中東・アフリカ
第9章 主な発展
- 契約、パートナーシップ、コラボレーション、合弁事業
- 買収と合併
- 新製品発売
- 事業拡大
- その他の主要戦略
第10章 企業プロファイリング
- 3 Degrees
- AltaGas
- Bluesource LLC
- Carbon Care Asia Limited
- Carbon Credit Capital
- Carbonbetter
- Clearsky Climate Solutions
- Climate Impact Partners
- Climate Trade
- Climatepartner GmbH
- Climeco LLC
- Climetrek Ltd.
- Cool Effect, Inc.
- Degrees Group Inc.
- EcoAct
- EKI Energy Services Ltd.
- Finite Carbon
- Forest Carbon
List of Tables
- Table 1 Global Compliance Carbon Credit Market Outlook, By Region (2022-2030) ($MN)
- Table 2 Global Compliance Carbon Credit Market Outlook, By Type (2022-2030) ($MN)
- Table 3 Global Compliance Carbon Credit Market Outlook, By Certified Emission Reductions (CERs) (2022-2030) ($MN)
- Table 4 Global Compliance Carbon Credit Market Outlook, By Emission Reduction Units (ERUs) (2022-2030) ($MN)
- Table 5 Global Compliance Carbon Credit Market Outlook, By Removal Units (RMUs) (2022-2030) ($MN)
- Table 6 Global Compliance Carbon Credit Market Outlook, By Other Types (2022-2030) ($MN)
- Table 7 Global Compliance Carbon Credit Market Outlook, By Application (2022-2030) ($MN)
- Table 8 Global Compliance Carbon Credit Market Outlook, By Renewable Energy (2022-2030) ($MN)
- Table 9 Global Compliance Carbon Credit Market Outlook, By Energy Efficiency (2022-2030) ($MN)
- Table 10 Global Compliance Carbon Credit Market Outlook, By Fuel Switching (2022-2030) ($MN)
- Table 11 Global Compliance Carbon Credit Market Outlook, By Industrial Processes (2022-2030) ($MN)
- Table 12 Global Compliance Carbon Credit Market Outlook, By Agriculture & Forestry (2022-2030) ($MN)
- Table 13 Global Compliance Carbon Credit Market Outlook, By End User (2022-2030) ($MN)
- Table 14 Global Compliance Carbon Credit Market Outlook, By Power Generation (2022-2030) ($MN)
- Table 15 Global Compliance Carbon Credit Market Outlook, By Manufacturing (2022-2030) ($MN)
- Table 16 Global Compliance Carbon Credit Market Outlook, By Chemical & Petrochemical (2022-2030) ($MN)
- Table 17 Global Compliance Carbon Credit Market Outlook, By Oil & Gas (2022-2030) ($MN)
- Table 18 Global Compliance Carbon Credit Market Outlook, By Transportation (2022-2030) ($MN)
- Table 19 Global Compliance Carbon Credit Market Outlook, By Other End Users (2022-2030) ($MN)
- Table 20 North America Compliance Carbon Credit Market Outlook, By Country (2022-2030) ($MN)
- Table 21 North America Compliance Carbon Credit Market Outlook, By Type (2022-2030) ($MN)
- Table 22 North America Compliance Carbon Credit Market Outlook, By Certified Emission Reductions (CERs) (2022-2030) ($MN)
- Table 23 North America Compliance Carbon Credit Market Outlook, By Emission Reduction Units (ERUs) (2022-2030) ($MN)
- Table 24 North America Compliance Carbon Credit Market Outlook, By Removal Units (RMUs) (2022-2030) ($MN)
- Table 25 North America Compliance Carbon Credit Market Outlook, By Other Types (2022-2030) ($MN)
- Table 26 North America Compliance Carbon Credit Market Outlook, By Application (2022-2030) ($MN)
- Table 27 North America Compliance Carbon Credit Market Outlook, By Renewable Energy (2022-2030) ($MN)
- Table 28 North America Compliance Carbon Credit Market Outlook, By Energy Efficiency (2022-2030) ($MN)
- Table 29 North America Compliance Carbon Credit Market Outlook, By Fuel Switching (2022-2030) ($MN)
- Table 30 North America Compliance Carbon Credit Market Outlook, By Industrial Processes (2022-2030) ($MN)
- Table 31 North America Compliance Carbon Credit Market Outlook, By Agriculture & Forestry (2022-2030) ($MN)
- Table 32 North America Compliance Carbon Credit Market Outlook, By End User (2022-2030) ($MN)
- Table 33 North America Compliance Carbon Credit Market Outlook, By Power Generation (2022-2030) ($MN)
- Table 34 North America Compliance Carbon Credit Market Outlook, By Manufacturing (2022-2030) ($MN)
- Table 35 North America Compliance Carbon Credit Market Outlook, By Chemical & Petrochemical (2022-2030) ($MN)
- Table 36 North America Compliance Carbon Credit Market Outlook, By Oil & Gas (2022-2030) ($MN)
- Table 37 North America Compliance Carbon Credit Market Outlook, By Transportation (2022-2030) ($MN)
- Table 38 North America Compliance Carbon Credit Market Outlook, By Other End Users (2022-2030) ($MN)
- Table 39 Europe Compliance Carbon Credit Market Outlook, By Country (2022-2030) ($MN)
- Table 40 Europe Compliance Carbon Credit Market Outlook, By Type (2022-2030) ($MN)
- Table 41 Europe Compliance Carbon Credit Market Outlook, By Certified Emission Reductions (CERs) (2022-2030) ($MN)
- Table 42 Europe Compliance Carbon Credit Market Outlook, By Emission Reduction Units (ERUs) (2022-2030) ($MN)
- Table 43 Europe Compliance Carbon Credit Market Outlook, By Removal Units (RMUs) (2022-2030) ($MN)
- Table 44 Europe Compliance Carbon Credit Market Outlook, By Other Types (2022-2030) ($MN)
- Table 45 Europe Compliance Carbon Credit Market Outlook, By Application (2022-2030) ($MN)
- Table 46 Europe Compliance Carbon Credit Market Outlook, By Renewable Energy (2022-2030) ($MN)
- Table 47 Europe Compliance Carbon Credit Market Outlook, By Energy Efficiency (2022-2030) ($MN)
- Table 48 Europe Compliance Carbon Credit Market Outlook, By Fuel Switching (2022-2030) ($MN)
- Table 49 Europe Compliance Carbon Credit Market Outlook, By Industrial Processes (2022-2030) ($MN)
- Table 50 Europe Compliance Carbon Credit Market Outlook, By Agriculture & Forestry (2022-2030) ($MN)
- Table 51 Europe Compliance Carbon Credit Market Outlook, By End User (2022-2030) ($MN)
- Table 52 Europe Compliance Carbon Credit Market Outlook, By Power Generation (2022-2030) ($MN)
- Table 53 Europe Compliance Carbon Credit Market Outlook, By Manufacturing (2022-2030) ($MN)
- Table 54 Europe Compliance Carbon Credit Market Outlook, By Chemical & Petrochemical (2022-2030) ($MN)
- Table 55 Europe Compliance Carbon Credit Market Outlook, By Oil & Gas (2022-2030) ($MN)
- Table 56 Europe Compliance Carbon Credit Market Outlook, By Transportation (2022-2030) ($MN)
- Table 57 Europe Compliance Carbon Credit Market Outlook, By Other End Users (2022-2030) ($MN)
- Table 58 Asia Pacific Compliance Carbon Credit Market Outlook, By Country (2022-2030) ($MN)
- Table 59 Asia Pacific Compliance Carbon Credit Market Outlook, By Type (2022-2030) ($MN)
- Table 60 Asia Pacific Compliance Carbon Credit Market Outlook, By Certified Emission Reductions (CERs) (2022-2030) ($MN)
- Table 61 Asia Pacific Compliance Carbon Credit Market Outlook, By Emission Reduction Units (ERUs) (2022-2030) ($MN)
- Table 62 Asia Pacific Compliance Carbon Credit Market Outlook, By Removal Units (RMUs) (2022-2030) ($MN)
- Table 63 Asia Pacific Compliance Carbon Credit Market Outlook, By Other Types (2022-2030) ($MN)
- Table 64 Asia Pacific Compliance Carbon Credit Market Outlook, By Application (2022-2030) ($MN)
- Table 65 Asia Pacific Compliance Carbon Credit Market Outlook, By Renewable Energy (2022-2030) ($MN)
- Table 66 Asia Pacific Compliance Carbon Credit Market Outlook, By Energy Efficiency (2022-2030) ($MN)
- Table 67 Asia Pacific Compliance Carbon Credit Market Outlook, By Fuel Switching (2022-2030) ($MN)
- Table 68 Asia Pacific Compliance Carbon Credit Market Outlook, By Industrial Processes (2022-2030) ($MN)
- Table 69 Asia Pacific Compliance Carbon Credit Market Outlook, By Agriculture & Forestry (2022-2030) ($MN)
- Table 70 Asia Pacific Compliance Carbon Credit Market Outlook, By End User (2022-2030) ($MN)
- Table 71 Asia Pacific Compliance Carbon Credit Market Outlook, By Power Generation (2022-2030) ($MN)
- Table 72 Asia Pacific Compliance Carbon Credit Market Outlook, By Manufacturing (2022-2030) ($MN)
- Table 73 Asia Pacific Compliance Carbon Credit Market Outlook, By Chemical & Petrochemical (2022-2030) ($MN)
- Table 74 Asia Pacific Compliance Carbon Credit Market Outlook, By Oil & Gas (2022-2030) ($MN)
- Table 75 Asia Pacific Compliance Carbon Credit Market Outlook, By Transportation (2022-2030) ($MN)
- Table 76 Asia Pacific Compliance Carbon Credit Market Outlook, By Other End Users (2022-2030) ($MN)
- Table 77 South America Compliance Carbon Credit Market Outlook, By Country (2022-2030) ($MN)
- Table 78 South America Compliance Carbon Credit Market Outlook, By Type (2022-2030) ($MN)
- Table 79 South America Compliance Carbon Credit Market Outlook, By Certified Emission Reductions (CERs) (2022-2030) ($MN)
- Table 80 South America Compliance Carbon Credit Market Outlook, By Emission Reduction Units (ERUs) (2022-2030) ($MN)
- Table 81 South America Compliance Carbon Credit Market Outlook, By Removal Units (RMUs) (2022-2030) ($MN)
- Table 82 South America Compliance Carbon Credit Market Outlook, By Other Types (2022-2030) ($MN)
- Table 83 South America Compliance Carbon Credit Market Outlook, By Application (2022-2030) ($MN)
- Table 84 South America Compliance Carbon Credit Market Outlook, By Renewable Energy (2022-2030) ($MN)
- Table 85 South America Compliance Carbon Credit Market Outlook, By Energy Efficiency (2022-2030) ($MN)
- Table 86 South America Compliance Carbon Credit Market Outlook, By Fuel Switching (2022-2030) ($MN)
- Table 87 South America Compliance Carbon Credit Market Outlook, By Industrial Processes (2022-2030) ($MN)
- Table 88 South America Compliance Carbon Credit Market Outlook, By Agriculture & Forestry (2022-2030) ($MN)
- Table 89 South America Compliance Carbon Credit Market Outlook, By End User (2022-2030) ($MN)
- Table 90 South America Compliance Carbon Credit Market Outlook, By Power Generation (2022-2030) ($MN)
- Table 91 South America Compliance Carbon Credit Market Outlook, By Manufacturing (2022-2030) ($MN)
- Table 92 South America Compliance Carbon Credit Market Outlook, By Chemical & Petrochemical (2022-2030) ($MN)
- Table 93 South America Compliance Carbon Credit Market Outlook, By Oil & Gas (2022-2030) ($MN)
- Table 94 South America Compliance Carbon Credit Market Outlook, By Transportation (2022-2030) ($MN)
- Table 95 South America Compliance Carbon Credit Market Outlook, By Other End Users (2022-2030) ($MN)
- Table 96 Middle East & Africa Compliance Carbon Credit Market Outlook, By Country (2022-2030) ($MN)
- Table 97 Middle East & Africa Compliance Carbon Credit Market Outlook, By Type (2022-2030) ($MN)
- Table 98 Middle East & Africa Compliance Carbon Credit Market Outlook, By Certified Emission Reductions (CERs) (2022-2030) ($MN)
- Table 99 Middle East & Africa Compliance Carbon Credit Market Outlook, By Emission Reduction Units (ERUs) (2022-2030) ($MN)
- Table 100 Middle East & Africa Compliance Carbon Credit Market Outlook, By Removal Units (RMUs) (2022-2030) ($MN)
- Table 101 Middle East & Africa Compliance Carbon Credit Market Outlook, By Other Types (2022-2030) ($MN)
- Table 102 Middle East & Africa Compliance Carbon Credit Market Outlook, By Application (2022-2030) ($MN)
- Table 103 Middle East & Africa Compliance Carbon Credit Market Outlook, By Renewable Energy (2022-2030) ($MN)
- Table 104 Middle East & Africa Compliance Carbon Credit Market Outlook, By Energy Efficiency (2022-2030) ($MN)
- Table 105 Middle East & Africa Compliance Carbon Credit Market Outlook, By Fuel Switching (2022-2030) ($MN)
- Table 106 Middle East & Africa Compliance Carbon Credit Market Outlook, By Industrial Processes (2022-2030) ($MN)
- Table 107 Middle East & Africa Compliance Carbon Credit Market Outlook, By Agriculture & Forestry (2022-2030) ($MN)
- Table 108 Middle East & Africa Compliance Carbon Credit Market Outlook, By End User (2022-2030) ($MN)
- Table 109 Middle East & Africa Compliance Carbon Credit Market Outlook, By Power Generation (2022-2030) ($MN)
- Table 110 Middle East & Africa Compliance Carbon Credit Market Outlook, By Manufacturing (2022-2030) ($MN)
- Table 111 Middle East & Africa Compliance Carbon Credit Market Outlook, By Chemical & Petrochemical (2022-2030) ($MN)
- Table 112 Middle East & Africa Compliance Carbon Credit Market Outlook, By Oil & Gas (2022-2030) ($MN)
- Table 113 Middle East & Africa Compliance Carbon Credit Market Outlook, By Transportation (2022-2030) ($MN)
- Table 114 Middle East & Africa Compliance Carbon Credit Market Outlook, By Other End Users (2022-2030) ($MN)
According to Stratistics MRC, the Global Compliance Carbon Credit Market is accounted for $117.2 billion in 2024 and is expected to reach $279.7 billion by 2030 growing at a CAGR of 15.6% during the forecast period. Carbon credits are tradable permits representing the right to emit one metric ton of carbon dioxide or its equivalent. They are a key component of carbon trading schemes aimed at reducing greenhouse gas emissions. The market for carbon credits has grown significantly as industries and governments seek cost-effective ways to meet emission reduction targets. This growth reflects increasing global awareness of climate change and efforts to mitigate its effects through market-based mechanisms.
According to the International Emissions Trading Association (IETA), the number of countries and regions with carbon pricing initiatives has grown significantly. In 2016, there were 41, and by 2022, that number had risen to 85. Additionally, more countries and regions are actively considering implementing their own carbon pricing mechanisms.
Market Dynamics:
Driver:
Increasing government regulations and carbon reduction targets
Governments worldwide are implementing stricter emissions regulations and setting ambitious carbon reduction targets to combat climate change. This is driving demand for compliance carbon credits as companies seek cost-effective ways to meet their mandated emissions limits. The expanding scope of carbon pricing mechanisms and emissions trading systems across regions is compelling more industries to participate in carbon markets, fueling market growth. As regulations tighten, companies are increasingly turning to carbon credits to offset emissions they cannot easily reduce internally.
Restraint:
Lack of standardization and transparency
The compliance carbon credit market faces challenges due to a lack of standardized methodologies for measuring, reporting, and verifying emissions reductions. Different jurisdictions have varying rules and quality standards for carbon credits, making it difficult to ensure consistency and comparability. The complex nature of carbon accounting and offset projects also leads to transparency issues, with concerns about the true additionality and permanence of emissions reductions. This lack of standardization and transparency can undermine market confidence and hinder broader adoption of carbon credits as a compliance tool.
Opportunity:
Technological advancements
Blockchain and distributed ledger technologies can improve transparency, traceability, and verification of carbon credits. Advanced monitoring and data analytics tools enable more accurate measurement of emissions reductions. Artificial intelligence and machine learning can optimize carbon credit trading and risk management. These technological advancements have the potential to increase market efficiency, reduce transaction costs, and build greater trust in the integrity of carbon credits, thereby expanding market participation and liquidity.
Threat:
Risk of carbon leakage
Carbon leakage poses a threat to the effectiveness of compliance carbon credit markets. There is a risk that stringent emissions regulations in one jurisdiction may lead companies to relocate their carbon-intensive operations to regions with less strict policies, potentially increasing overall global emissions. This can undermine the environmental integrity of carbon reduction efforts and distort competition.
Covid-19 Impact:
The COVID-19 pandemic initially disrupted carbon markets, causing a sharp drop in credit prices due to reduced economic activity and emissions. However, as economies recovered, there was renewed focus on climate action, leading to increased demand for carbon credits. The pandemic highlighted the importance of resilience and sustainability, potentially accelerating long-term growth in compliance carbon markets as part of green recovery efforts.
The certified emission reductions (CERs) segment is expected to be the largest during the forecast period
The certified emission reductions (CERs) segment is likely to dominate the compliance carbon credit market due to their international recognition and established methodologies under the Clean Development Mechanism (CDM). CERs offer a standardized, verified approach to emissions reductions that is accepted in multiple jurisdictions. Their wide applicability across sectors and geographies makes them attractive to both credit buyers and sellers. As more countries integrate international carbon credits into their compliance mechanisms, the demand for high-quality CERs is expected to grow, solidifying their position in the market.
The industrial processes segment is expected to have the highest CAGR during the forecast period
The industrial processes segment is poised for rapid growth in the compliance carbon credit market due to increasing pressure on energy-intensive industries to decarbonize. As these sectors face stricter emissions regulations, they are turning to carbon credits to offset hard-to-abate emissions. Technological innovations in industrial processes are also creating new opportunities for emissions reduction and credit generation. The potential for large-scale emissions reductions in this sector, coupled with growing regulatory focus, is driving investment in industrial carbon credit projects, leading to the highest projected CAGR.
Region with largest share:
Europe is set to maintain its dominance in the compliance carbon credit market, driven by its well-established EU Emissions Trading System (EU ETS) and ambitious climate targets. The region's stringent regulatory framework, covering multiple sectors, creates consistent demand for carbon credits. Europe's leadership in climate policy and commitment to achieving net-zero emissions by 2050 further reinforce its market position. The integration of international credits and the expansion of carbon pricing mechanisms across European countries contribute to the region's large market share and continued growth.
Region with highest CAGR:
Asia Pacific is expected to experience the highest CAGR in the compliance carbon credit market, fueled by rapid industrialization, growing environmental awareness, and increasing adoption of emissions trading systems. Countries like China, South Korea, and Japan are expanding their carbon markets, creating new opportunities for credit generation and trading. The region's fast-growing economies and ambitious climate commitments are driving demand for cost-effective emissions reduction solutions. As more Asian countries implement carbon pricing mechanisms, the region is poised for accelerated growth in the compliance carbon credit sector.
Key players in the market
Some of the key players in Compliance Carbon Credit market include 3 Degrees, AltaGas, Bluesource LLC, Carbon Care Asia Limited, Carbon Credit Capital, Carbonbetter, Clearsky Climate Solutions, Climate Impact Partners, Climate Trade, Climatepartner GmbH, Climeco LLC, Climetrek Ltd., Cool Effect, Inc., Degrees Group Inc., EcoAct, EKI Energy Services Ltd., Finite Carbon and Forest Carbon.
Key Developments:
In November 2023, Bluesource Sustainable Forest Company submitted a revised Annual Operating Plan to reduce logging in favor of carbon credits within New Hampshire's conservation easement. This move is part of their participation in California's Air Resource Board Compliance Offset Program.
In January 2023, ClimeCo announced the acquisition of 3GreenTree Ecosystem Service Ltd. to enhance their sustainable project portfolio.
Types Covered:
- Certified Emission Reductions (CERs)
- Emission Reduction Units (ERUs)
- Removal Units (RMUs)
- Other Types
Applications Covered:
- Renewable Energy
- Energy Efficiency
- Fuel Switching
- Industrial Processes
- Agriculture & Forestry
End Users Covered:
- Power Generation
- Manufacturing
- Chemical & Petrochemical
- Oil & Gas
- Transportation
- Other End Users
Regions Covered:
- North America
- US
- Canada
- Mexico
- Europe
- Germany
- UK
- Italy
- France
- Spain
- Rest of Europe
- Asia Pacific
- Japan
- China
- India
- Australia
- New Zealand
- South Korea
- Rest of Asia Pacific
- South America
- Argentina
- Brazil
- Chile
- Rest of South America
- Middle East & Africa
- Saudi Arabia
- UAE
- Qatar
- South Africa
- Rest of Middle East & Africa
What our report offers:
- Market share assessments for the regional and country-level segments
- Strategic recommendations for the new entrants
- Covers Market data for the years 2022, 2023, 2024, 2026, and 2030
- Market Trends (Drivers, Constraints, Opportunities, Threats, Challenges, Investment Opportunities, and recommendations)
- Strategic recommendations in key business segments based on the market estimations
- Competitive landscaping mapping the key common trends
- Company profiling with detailed strategies, financials, and recent developments
- Supply chain trends mapping the latest technological advancements
Free Customization Offerings:
All the customers of this report will be entitled to receive one of the following free customization options:
- Company Profiling
- Comprehensive profiling of additional market players (up to 3)
- SWOT Analysis of key players (up to 3)
- Regional Segmentation
- Market estimations, Forecasts and CAGR of any prominent country as per the client's interest (Note: Depends on feasibility check)
- Competitive Benchmarking
- Benchmarking of key players based on product portfolio, geographical presence, and strategic alliances
Table of Contents
1 Executive Summary
2 Preface
- 2.1 Abstract
- 2.2 Stake Holders
- 2.3 Research Scope
- 2.4 Research Methodology
- 2.4.1 Data Mining
- 2.4.2 Data Analysis
- 2.4.3 Data Validation
- 2.4.4 Research Approach
- 2.5 Research Sources
- 2.5.1 Primary Research Sources
- 2.5.2 Secondary Research Sources
- 2.5.3 Assumptions
3 Market Trend Analysis
- 3.1 Introduction
- 3.2 Drivers
- 3.3 Restraints
- 3.4 Opportunities
- 3.5 Threats
- 3.6 Application Analysis
- 3.7 End User Analysis
- 3.8 Emerging Markets
- 3.9 Impact of Covid-19
4 Porters Five Force Analysis
- 4.1 Bargaining power of suppliers
- 4.2 Bargaining power of buyers
- 4.3 Threat of substitutes
- 4.4 Threat of new entrants
- 4.5 Competitive rivalry
5 Global Compliance Carbon Credit Market, By Type
- 5.1 Introduction
- 5.2 Certified Emission Reductions (CERs)
- 5.3 Emission Reduction Units (ERUs)
- 5.4 Removal Units (RMUs)
- 5.5 Other Types
6 Global Compliance Carbon Credit Market, By Application
- 6.1 Introduction
- 6.2 Renewable Energy
- 6.3 Energy Efficiency
- 6.4 Fuel Switching
- 6.5 Industrial Processes
- 6.6 Agriculture & Forestry
7 Global Compliance Carbon Credit Market, By End User
- 7.1 Introduction
- 7.2 Power Generation
- 7.3 Manufacturing
- 7.4 Chemical & Petrochemical
- 7.5 Oil & Gas
- 7.6 Transportation
- 7.7 Other End Users
8 Global Compliance Carbon Credit Market, By Geography
- 8.1 Introduction
- 8.2 North America
- 8.2.1 US
- 8.2.2 Canada
- 8.2.3 Mexico
- 8.3 Europe
- 8.3.1 Germany
- 8.3.2 UK
- 8.3.3 Italy
- 8.3.4 France
- 8.3.5 Spain
- 8.3.6 Rest of Europe
- 8.4 Asia Pacific
- 8.4.1 Japan
- 8.4.2 China
- 8.4.3 India
- 8.4.4 Australia
- 8.4.5 New Zealand
- 8.4.6 South Korea
- 8.4.7 Rest of Asia Pacific
- 8.5 South America
- 8.5.1 Argentina
- 8.5.2 Brazil
- 8.5.3 Chile
- 8.5.4 Rest of South America
- 8.6 Middle East & Africa
- 8.6.1 Saudi Arabia
- 8.6.2 UAE
- 8.6.3 Qatar
- 8.6.4 South Africa
- 8.6.5 Rest of Middle East & Africa
9 Key Developments
- 9.1 Agreements, Partnerships, Collaborations and Joint Ventures
- 9.2 Acquisitions & Mergers
- 9.3 New Product Launch
- 9.4 Expansions
- 9.5 Other Key Strategies
10 Company Profiling
- 10.1 3 Degrees
- 10.2 AltaGas
- 10.3 Bluesource LLC
- 10.4 Carbon Care Asia Limited
- 10.5 Carbon Credit Capital
- 10.6 Carbonbetter
- 10.7 Clearsky Climate Solutions
- 10.8 Climate Impact Partners
- 10.9 Climate Trade
- 10.10 Climatepartner GmbH
- 10.11 Climeco LLC
- 10.12 Climetrek Ltd.
- 10.13 Cool Effect, Inc.
- 10.14 Degrees Group Inc.
- 10.15 EcoAct
- 10.16 EKI Energy Services Ltd.
- 10.17 Finite Carbon
- 10.18 Forest Carbon
