
|
市場調査レポート
商品コード
1687153
飼料用プロバイオティクス:市場シェア分析、産業動向・統計、成長予測(2025年~2030年)Feed Probiotics - Market Share Analysis, Industry Trends & Statistics, Growth Forecasts (2025 - 2030) |
||||||
カスタマイズ可能
適宜更新あり
|
|||||||
| 飼料用プロバイオティクス:市場シェア分析、産業動向・統計、成長予測(2025年~2030年) |
|
出版日: 2025年03月18日
発行: Mordor Intelligence
ページ情報: 英文 390 Pages
納期: 2~3営業日
|

全表示
- 概要
- 目次
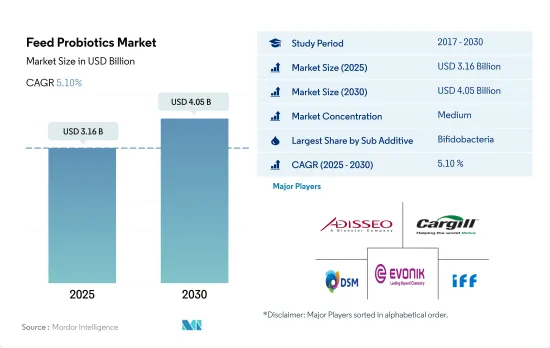
飼料用プロバイオティクス市場規模は2025年に31億6,000万米ドルと推定され、2030年には40億5,000万米ドルに達すると予測され、予測期間中(2025-2030年)のCAGRは5.10%で成長する見込みです。
- 世界の飼料添加物市場では、プロバイオティクスの消費が大幅に増加しています。2022年には、プロバイオティクスの市場シェアは8.3%でした。これは、動物の成長と生産を強化し、病原体から保護し、骨の強度を向上させ、免疫システムを強化し、寄生虫と戦うその能力によるものです。同市場は予測期間中に成長し、CAGR 5.1%を記録すると予想されます。
- ビフィズス菌と乳酸菌は、世界的に消費されている2大副添加物であり、合わせて2022年の世界の飼料用プロバイオティクス市場の63.5%を占める。乳酸菌は消化器系を刺激し、病気の原因菌と戦い、ビタミンの生成を助ける。ビフィズス菌は体重増加を助け、動物の健康を増進します。
- 飼料用プロバイオティクスの世界市場において、家禽類は最大の動物種セグメントであり、2022年には金額ベースで市場シェアの46.8%を占めました。家禽類における飼料用プロバイオティクスの利用が増加しているのは、その成長性能と全体的な健康を促進する能力によるものです。
- 飼料用プロバイオティクスの世界の最大消費国はアジア太平洋と北米です。2022年には米国が最大の市場シェアを占め、北米の飼料用プロバイオティクス市場の70.0%を占めました。アジア太平洋地域では、中国が飼料用プロバイオティクスの主要市場であり、金額ベースで同地域の飼料用プロバイオティクス市場の43.9%を占めています。これは同国の畜産人口の多さによるもので、2022年には中国がアジア太平洋の家禽人口の41.0%を占める。
- そのため、消化器系を改善し、病気を予防し、飼料生産量を増加させるプロバイオティクスの能力により、飼料添加物におけるプロバイオティクスの使用は拡大すると予想されます。これは、メーカーが製品を拡大する機会を提供します。
- 世界の飼料用プロバイオティクス市場は近年目覚しい成長を遂げています。プロバイオティクスは、免疫システムを強化し、動物を病気から守ると同時に、動物の成長と開発を強化するのに役立つ必須栄養素です。2017年から2022年にかけて、世界の飼料用プロバイオティクス市場は29.7%成長し、飼料添加物市場全体の8.3%を占めました。
- 2022年には、アジア太平洋地域は普及率が高く、動物の商業栽培が盛んであることから、8億8,320万米ドルとなり、飼料用プロバイオティクスの最大市場となりました。国別では、米国が飼料用プロバイオティクスの最大市場であり、世界市場シェアのほぼ18.5%を占め、2022年の市場規模は5億580万米ドルでした。米国は、高度に発達した生産慣行と大規模な商業畜産により、圧倒的な地位を占めています。
- 中国は飼料用プロバイオティクスの第2位の市場であり、動物の頭数が多いため、2022年の世界市場シェアの14.2%を占めました。しかし、日本と米国は世界で最も急成長している国であり、飼料生産の需要が高まり、子豚や子牛の原料として飼料用プロバイオティクスの利用が増加していることから、予測期間中にそれぞれ6.2%と6.0%のCAGRで推移すると予想されます。
- 飼料用プロバイオティクスの世界市場は、生産性の向上、世界人口の増加、都市化などの懸念の高まりにより、予測期間中にCAGR 5.1%を記録すると予想されます。また、肉や乳製品の消費の増加も市場の成長を促進すると予想されます。
世界の飼料用プロバイオティクス市場動向
家禽部門への投資の増加に伴う、卵などの動物性タンパク質や家禽製品への高い需要が家禽人口を増加させています。
- 家禽の飼育頭数は近年大幅に増加しているが、これは主に日常食における鶏肉と鶏卵の需要が増加しているためです。鶏肉製品へのシフトは、米国で豚肉など他の食肉の価格が上昇していることが背景にあります。例えば、欧州の鶏卵消費量は2017年から2021年にかけて4.6%増加し、2021年には6,135トンを占める。
- アジア太平洋は最大の家禽類生産国で、2022年の生産量は2017年比で6.6%増加しました。鶏肉生産量の増加は、豚肉供給量を減少させたアフリカ豚熱の発生に伴う動物性タンパク質への需要の高まりによるものです。中国は世界の生産量の40%を占め、9億羽以上の採卵鶏を飼養しており、最大のレイヤー養鶏センターでは年間6,000万羽のヒナを孵化させることができます。中東地域も、予測期間(2023~2029年)に鶏肉生産の成長が見込まれます。サウジアラビアのAlmaraiのような企業は、この産業に多額の投資を行っており、11億2,000万米ドルを生産拡大のための新農場設立に費やしています。
- 鶏肉製品の需要増は、養鶏産業への投資増と相まって、飼料生産の成長を強化すると予想されます。このことが、予測期間中の世界市場における飼料添加物の需要を促進すると予想されます。全体として、鶏肉業界は、鶏肉製品へのシフトと同部門への投資の増加により、今後数年間で大きく成長する態勢を整えています。
アジア太平洋と南米における水産物の消費需要の増加と政府の取り組みにより、養殖種用の飼料生産が増加しています。
- 養殖業の拡大により飼料需要が急増しており、これが配合飼料生産の成長を牽引しています。2022年の配合飼料生産量は前年比13.1%増、魚類飼料生産量は2017年から2022年にかけて46.3%増。魚用飼料の消費量の増加は、水産物の需要増に対応するため、水産動物の性能を維持・向上させ、生産性を高める必要があることが背景にあります。
- アジア太平洋地域では魚の消費と生産が盛んであるため、2022年には魚用飼料が世界市場の73.2%を占めました。世界市場では魚類に次いでエビやその他の水生動物が多く、エビは欧州諸国や米国が他地域から大量に輸入しています。増大する水産物需要を満たすため、各国は養殖生産の拡大に力を入れています。例えば、インドは生産量を増やすために漁業省への予算配分を2020年の1億1,410万米ドルから2021年には1億6,880万米ドルに増額しており、予測期間中に飼料需要を押し上げることが予想されます。
- 南米でも飼料生産が増加しており、養殖の拡大により2022年には2017年比46.4%増の510万トンに達します。同地域は主要な水産物消費地域のひとつであり、水産物需要の増加が養殖生産を促進しています。増大する需要に対応するために養殖が拡大し続ける中、この産業の開発とその拡大への注力が飼料生産の成長を促進すると予想されます。このような水生種用の飼料生産の増加は、予測期間中の水生セグメントの成長を助けると予想されます。
飼料用プロバイオティクス産業の概要
飼料用プロバイオティクス市場は適度に統合されており、上位5社で51.79%を占めています。この市場の主要企業は以下の通りです。 Adisseo, Cargill Inc., DSM Nutritional Products AG, Evonik Industries AG and IFF(Danisco Animal Nutrition)(sorted alphabetically).
その他の特典
- エクセル形式の市場予測(ME)シート
- 3ヶ月のアナリストサポート
目次
第1章 エグゼクティブサマリーと主な調査結果
第2章 レポートのオファー
第3章 イントロダクション
- 調査の前提条件と市場定義
- 調査範囲
- 調査手法
第4章 主要産業動向
- 動物頭数
- 家禽
- 反芻動物
- 豚
- 飼料生産
- 水産養殖
- 家禽
- 反芻動物
- 養豚
- 規制の枠組み
- オーストラリア
- ブラジル
- カナダ
- 中国
- フランス
- ドイツ
- インド
- インドネシア
- イタリア
- 日本
- メキシコ
- オランダ
- フィリピン
- ロシア
- 南アフリカ
- 韓国
- スペイン
- タイ
- トルコ
- 英国
- 米国
- ベトナム
- バリューチェーンと流通チャネル分析
第5章 市場セグメンテーション
- サブ添加物
- ビフィズス菌
- 腸球菌
- 乳酸菌
- ペディオコッカス
- レンサ球菌
- その他のプロバイオティクス
- 動物
- 水産養殖
- サブ動物別
- 魚類
- エビ
- その他の養殖種
- 家禽類
- サブ動物別
- ブロイラー
- レイヤー
- その他の鳥類
- 反芻動物
- サブ動物別
- 肉牛
- 乳牛
- その他の反芻動物
- 豚
- その他の動物
- 水産養殖
- 地域
- アフリカ
- 国別
- エジプト
- ケニア
- 南アフリカ
- その他のアフリカ
- アジア太平洋
- 国別
- オーストラリア
- 中国
- インド
- インドネシア
- 日本
- フィリピン
- 韓国
- タイ
- ベトナム
- その他アジア太平洋地域
- 欧州
- 国別
- フランス
- ドイツ
- イタリア
- オランダ
- ロシア
- スペイン
- トルコ
- 英国
- その他欧州
- 中東
- 国別
- イラン
- サウジアラビア
- その他中東
- 北米
- 国別
- カナダ
- メキシコ
- 米国
- その他北米地域
- 南米
- 国別
- アルゼンチン
- ブラジル
- チリ
- その他南米諸国
- アフリカ
第6章 競合情勢
- 主要な戦略的動き
- 市場シェア分析
- 企業情勢
- 企業プロファイル.
- Adisseo
- Cargill Inc.
- CHR. Hansen A/S
- DSM Nutritional Products AG
- Evonik Industries AG
- IFF(Danisco Animal Nutrition)
- Kemin Industries
- Kerry Group Plc
- Lallemand Inc.
- MIAVIT Stefan Niemeyer GmbH
第7章 CEOへの主な戦略的質問
第8章 付録
- 世界概要
- 概要
- ファイブフォース分析フレームワーク
- 世界のバリューチェーン分析
- 世界市場規模とDRO
- 情報源と参考文献
- 図表リスト
- 主要洞察
- データパック
- 用語集
The Feed Probiotics Market size is estimated at 3.16 billion USD in 2025, and is expected to reach 4.05 billion USD by 2030, growing at a CAGR of 5.10% during the forecast period (2025-2030).
- The global feed additives market has seen a significant increase in the consumption of probiotics. In 2022, probiotics held a market share of 8.3%. This is due to their ability to enhance the growth and production of animals, protect against pathogens, improve bone strength, enhance the immune system, and fight parasitism. The market is expected to grow and register a CAGR of 5.1% during the forecast period.
- Bifidobacteria and lactobacilli are the two major sub-additives consumed globally, together accounting for 63.5% of the global feed probiotics market in 2022. Lactobacilli stimulate the digestive system, fight disease-causing bacteria, and help produce vitamins. Bifidobacteria helps in weight gain and improve animal health.
- Poultry birds were the largest animal type segment in the global feed probiotics market, accounting for 46.8% of the market share by value in 2022. The increased usage of feed probiotics in poultry birds is due to their ability to promote growth performance and overall health.
- The largest consumers of feed probiotics globally are Asia-Pacific and North America. In 2022, the United States held the largest market share, accounting for 70.0% of the North American feed probiotic market. In the Asia-Pacific region, China is the major market for feed probiotics, accounting for 43.9% of the region's feed probiotics market by value. This is due to the high livestock population in the country, with China accounting for 41.0% of the Asia-Pacific's poultry population in 2022.
- Therefore, the use of probiotics in feed additives is expected to grow due to their ability to improve the digestive system, prevent diseases, and increase feed production. This provides an opportunity for manufacturers to expand their offerings.
- The global feed probiotics market experienced impressive growth in recent years. Probiotics are essential nutrients that help enhance animal growth and development while strengthening immune systems and protecting the animals from diseases. During 2017-2022, the global feed probiotics market grew by 29.7%, representing 8.3% of the overall feed additive market.
- In 2022, Asia-Pacific was the largest market for feed probiotics, with a value of USD 883.2 million due to the region's higher penetration rates and higher commercial cultivation of animals. At the country level, the United States was the largest market for feed probiotics, accounting for almost 18.5% of the global market share, with a value of USD 505.8 million in 2022. The United States occupied a dominant position due to its highly developed production practices and significant commercial animal cultivation.
- China was the second-largest market for feed probiotics, accounting for 14.2% of the global market share in 2022 due to its large animal headcount. However, Japan and the United States are the fastest-growing countries in the world, and they are expected to record a CAGR of 6.2% and 6.0%, respectively, during the forecast period due to the rising demand for feed production and increased usage of feed probiotics as ingredients for piglets and calves.
- The global feed probiotics market is expected to register a CAGR of 5.1% during the forecast period, driven by the growing concerns of rising productivity, increasing global population, and urbanization. The increased consumption of meat and dairy products is also expected to fuel the market's growth.
Global Feed Probiotics Market Trends
High demand for animal protein and poultry products such as eggs with increasing investment in poultry sector is increasing poultry population
- The poultry population has witnessed a significant increase in recent years, primarily due to the growing demand for chicken meat and eggs in daily diets. The shift toward poultry products has been driven by the increasing prices of other meat, such as pig meat, in the United States. For instance, the consumption of eggs in Europe increased by 4.6% between 2017 and 2021, accounting for 6,135 metric tons in 2021.
- Asia-Pacific was the largest producer of poultry birds, with production increasing by 6.6% in 2022 compared to 2017. The rise in poultry production is due to the growing demand for animal protein following the outbreak of African Swine Fever, which has reduced the pork meat supply. China accounts for 40% of the global production, has more than 900 million stock-laying hens, and its largest layer poultry farming center can hatch 60 million chicks per year. The Middle Eastern region is also expected to witness growth in poultry production in the forecast period (2023-2029). Companies such as Almarai in Saudi Arabia have invested heavily in the industry, with USD 1.12 billion spent on establishing new farms to expand production.
- The increasing demand for poultry products, coupled with rising investments in the poultry industry, is expected to strengthen the growth of feed production. This, in turn, is expected to drive the demand for feed additives in the global market during the forecast period. Overall, the poultry industry is poised for significant growth in the coming years, driven by the shift toward poultry products and increasing investments in the sector.
The growing demand for seafood consumption in Asia-Pacific and South America, and government initiatives is increasing the feed production for aquaculture species
- The demand for feed is rapidly increasing due to the expansion of aquaculture, which is driving the growth of compound feed production. In 2022, compound feed production increased by 13.1% from the previous year, and fish feed production increased by 46.3% between 2017 and 2022. The rise in consumption of fish feed is driven by the need to maintain and improve the performance of aquatic animals and increase productivity to meet the growing demand for seafood.
- Fish feed accounted for 73.2% of the global market in 2022, as fish is highly consumed and produced in the Asia-Pacific region. Fish is followed by shrimp and other aquatic species in the global market, with shrimp being highly imported by European countries and the United States from other regions. To meet the growing demand for seafood, countries are focusing on expanding aquaculture production. For instance, India increased its budget allocation to the Department of Fisheries from USD 114.1 million in 2020 to USD 168.8 million in 2021 to increase production, which is expected to boost the demand for feed during the forecast period.
- South America is also experiencing an increase in feed production, which rose by 46.4% in 2022 from 2017 to reach 5.1 million metric tons due to the expansion of aquaculture farming. The region is one of the major seafood-consuming regions, and the increasing demand for seafood is driving aquaculture production. As aquaculture continues to expand to meet the growing demand, the development of the industry and a focus on its expansion are expected to fuel the growth of feed production. This increase in feed production for aquatic species is expected to aid in the growth of the aquatic segment during the forecast period.
Feed Probiotics Industry Overview
The Feed Probiotics Market is moderately consolidated, with the top five companies occupying 51.79%. The major players in this market are Adisseo, Cargill Inc., DSM Nutritional Products AG, Evonik Industries AG and IFF(Danisco Animal Nutrition) (sorted alphabetically).
Additional Benefits:
- The market estimate (ME) sheet in Excel format
- 3 months of analyst support
TABLE OF CONTENTS
1 EXECUTIVE SUMMARY & KEY FINDINGS
2 REPORT OFFERS
3 INTRODUCTION
- 3.1 Study Assumptions & Market Definition
- 3.2 Scope of the Study
- 3.3 Research Methodology
4 KEY INDUSTRY TRENDS
- 4.1 Animal Headcount
- 4.1.1 Poultry
- 4.1.2 Ruminants
- 4.1.3 Swine
- 4.2 Feed Production
- 4.2.1 Aquaculture
- 4.2.2 Poultry
- 4.2.3 Ruminants
- 4.2.4 Swine
- 4.3 Regulatory Framework
- 4.3.1 Australia
- 4.3.2 Brazil
- 4.3.3 Canada
- 4.3.4 China
- 4.3.5 France
- 4.3.6 Germany
- 4.3.7 India
- 4.3.8 Indonesia
- 4.3.9 Italy
- 4.3.10 Japan
- 4.3.11 Mexico
- 4.3.12 Netherlands
- 4.3.13 Philippines
- 4.3.14 Russia
- 4.3.15 South Africa
- 4.3.16 South Korea
- 4.3.17 Spain
- 4.3.18 Thailand
- 4.3.19 Turkey
- 4.3.20 United Kingdom
- 4.3.21 United States
- 4.3.22 Vietnam
- 4.4 Value Chain & Distribution Channel Analysis
5 MARKET SEGMENTATION (includes market size in Value in USD and Volume, Forecasts up to 2030 and analysis of growth prospects)
- 5.1 Sub Additive
- 5.1.1 Bifidobacteria
- 5.1.2 Enterococcus
- 5.1.3 Lactobacilli
- 5.1.4 Pediococcus
- 5.1.5 Streptococcus
- 5.1.6 Other Probiotics
- 5.2 Animal
- 5.2.1 Aquaculture
- 5.2.1.1 By Sub Animal
- 5.2.1.1.1 Fish
- 5.2.1.1.2 Shrimp
- 5.2.1.1.3 Other Aquaculture Species
- 5.2.2 Poultry
- 5.2.2.1 By Sub Animal
- 5.2.2.1.1 Broiler
- 5.2.2.1.2 Layer
- 5.2.2.1.3 Other Poultry Birds
- 5.2.3 Ruminants
- 5.2.3.1 By Sub Animal
- 5.2.3.1.1 Beef Cattle
- 5.2.3.1.2 Dairy Cattle
- 5.2.3.1.3 Other Ruminants
- 5.2.4 Swine
- 5.2.5 Other Animals
- 5.2.1 Aquaculture
- 5.3 Region
- 5.3.1 Africa
- 5.3.1.1 By Country
- 5.3.1.1.1 Egypt
- 5.3.1.1.2 Kenya
- 5.3.1.1.3 South Africa
- 5.3.1.1.4 Rest of Africa
- 5.3.2 Asia-Pacific
- 5.3.2.1 By Country
- 5.3.2.1.1 Australia
- 5.3.2.1.2 China
- 5.3.2.1.3 India
- 5.3.2.1.4 Indonesia
- 5.3.2.1.5 Japan
- 5.3.2.1.6 Philippines
- 5.3.2.1.7 South Korea
- 5.3.2.1.8 Thailand
- 5.3.2.1.9 Vietnam
- 5.3.2.1.10 Rest of Asia-Pacific
- 5.3.3 Europe
- 5.3.3.1 By Country
- 5.3.3.1.1 France
- 5.3.3.1.2 Germany
- 5.3.3.1.3 Italy
- 5.3.3.1.4 Netherlands
- 5.3.3.1.5 Russia
- 5.3.3.1.6 Spain
- 5.3.3.1.7 Turkey
- 5.3.3.1.8 United Kingdom
- 5.3.3.1.9 Rest of Europe
- 5.3.4 Middle East
- 5.3.4.1 By Country
- 5.3.4.1.1 Iran
- 5.3.4.1.2 Saudi Arabia
- 5.3.4.1.3 Rest of Middle East
- 5.3.5 North America
- 5.3.5.1 By Country
- 5.3.5.1.1 Canada
- 5.3.5.1.2 Mexico
- 5.3.5.1.3 United States
- 5.3.5.1.4 Rest of North America
- 5.3.6 South America
- 5.3.6.1 By Country
- 5.3.6.1.1 Argentina
- 5.3.6.1.2 Brazil
- 5.3.6.1.3 Chile
- 5.3.6.1.4 Rest of South America
- 5.3.1 Africa
6 COMPETITIVE LANDSCAPE
- 6.1 Key Strategic Moves
- 6.2 Market Share Analysis
- 6.3 Company Landscape
- 6.4 Company Profiles (includes Global Level Overview, Market Level Overview, Core Business Segments, Financials, Headcount, Key Information, Market Rank, Market Share, Products and Services, and Analysis of Recent Developments).
- 6.4.1 Adisseo
- 6.4.2 Cargill Inc.
- 6.4.3 CHR. Hansen A/S
- 6.4.4 DSM Nutritional Products AG
- 6.4.5 Evonik Industries AG
- 6.4.6 IFF(Danisco Animal Nutrition)
- 6.4.7 Kemin Industries
- 6.4.8 Kerry Group Plc
- 6.4.9 Lallemand Inc.
- 6.4.10 MIAVIT Stefan Niemeyer GmbH
7 KEY STRATEGIC QUESTIONS FOR FEED ADDITIVE CEOS
8 APPENDIX
- 8.1 Global Overview
- 8.1.1 Overview
- 8.1.2 Porter's Five Forces Framework
- 8.1.3 Global Value Chain Analysis
- 8.1.4 Global Market Size and DROs
- 8.2 Sources & References
- 8.3 List of Tables & Figures
- 8.4 Primary Insights
- 8.5 Data Pack
- 8.6 Glossary of Terms

