|
|
市場調査レポート
商品コード
1535303
リアルワールドエビデンスソリューションの市場規模、シェア、予測、動向分析:コンポーネント別、用途別、エンドユーザー別 - 2031年までの世界予測Real-world Evidence Solutions Market Size, Share, Forecast, & Trends Analysis by Component (Datasets [Clinical, Claims, Pharmacy], Services) Application (Market Access, Drug Development & Approvals, PMS), and End User - Global Forecast to 2031 |
||||||

|
|||||||
カスタマイズ可能
|
|||||||

| リアルワールドエビデンスソリューションの市場規模、シェア、予測、動向分析:コンポーネント別、用途別、エンドユーザー別 - 2031年までの世界予測 |
|
出版日: 2024年08月14日
発行: Meticulous Research
ページ情報: 英文 254 Pages
納期: 即納可能
|

全表示
- 概要
- 図表
- 目次
世界のリアルワールドエビデンス(RWE)ソリューション市場の2023年の市場規模は26億2,000万米ドルでした。この市場は、2024年の推定29億4,000万米ドルから2031年には63億7,000万米ドルに達すると予測され、2024年から2031年の予測期間中のCAGRは11.7%です。
本レポートでは、包括的な一次・二次調査と市場シナリオの詳細な分析に基づき、業界の主要促進要因・制約・課題・機会を提供しています。この市場を牽引しているのは、慢性疾患の増加、医薬品開発の遅れとそれに伴う開発コストの増大、個別化ヘルスケアへの注目の高まり、価値観に基づく医療へのシフト、医薬品開発・商業化におけるリアルワールドエビデンスソリューションの採用拡大などです。例えば、IQVIAは2024年6月にOne Home for Sitesを発表しました。このデジタルプラットフォームは、臨床試験実施施設が臨床試験を実施するために必要なすべての重要なシステムとタスクのダッシュボードとして機能します。
さらに、新興国やエンドツーエンドのRWEサービスへの注目の高まりは、リアルワールドソリューション市場に大きな成長機会をもたらしています。しかし、市場の拡大は、実地調査に頼ろうとしない姿勢やデータ収集における品質管理の不在によって制約を受ける可能性があります。さらに、RWEを開発するための標準化された手法がないことや、データのプライバシーとセキュリティに関する懸念は、この市場で事業を展開する企業にとって大きな課題となっています。
コンポーネント別では、2024年にはデータセットセグメントがRWEソリューション市場で最大のシェアを占めると予想されています。RWEデータセットは、実世界における多様な集団の患者転帰に関連するさまざまな情報源に由来します。満たされていないニーズ、患者やヘルスケアシステムへの財政的・臨床的影響に関して、このソリューションは洞察に満ちた情報を提供します。さらに、はるかに大規模なデータセット、より少ない費用、より効果的な臨床試験管理に基づいています。
用途別では、2024年には市場アクセス&償還/保険適用決定セグメントがRWEソリューション市場で最大のシェアを占めると予想されています。予測分析とデータ主導の洞察を用いて、市場アクセスのためのRWEソリューションは、医療製品の有効性と価値の包括的な評価を可能にし、価値ベースの価格戦略をサポートし、有利な償還結果をもたらすことができます。大きな市場シェアは、医療費の高騰、規制当局によるRWEの受け入れ拡大、保険適用決定における臨床価値エビデンスの重要性の拡大、日常診療環境や異種患者コホートにおける治療効果に関する補足データの入手可能性など、いくつかの要因によるものです。
エンドユーザーの中では、2024年には製薬、バイオテクノロジー、医療機器企業セグメントがRWEソリューション市場で最大のシェアを占めると予想されています。薬剤に関するリアルタイムの臨床試験後データの収集、薬物反応のモニタリング、臨床試験外で新たに創出された治療法の価値を証明するためのRWEの利用拡大、迅速な薬剤試験や承認期間の延長など、いくつかの変数がこのセグメントの大きなシェアを占めています。
世界のRWEソリューション市場の地域別シナリオを詳細に分析することで、主要5地域(北米、欧州、アジア太平洋、中東・アフリカ、ラテンアメリカ)の詳細な定性的・定量的洞察を提供します。各地域の主要国をカバーしています。
2024年には、北米が世界のRWEソリューション市場で最大のシェアを占め、次いで欧州、アジア太平洋、ラテンアメリカ、中東・アフリカが続くと予想されます。北米の大幅なシェアは、慢性疾患の罹患率の上昇、投薬承認ガイドラインの厳格化、21世紀治療法、電子データセットへの幅広いアクセシビリティ、強固に確立されたヘルスケア産業、ヘルスケアにおけるビッグデータ活用の拡大など、さまざまな要因に起因しています。
調査範囲:
リアルワールドエビデンスソリューション市場評価:コンポーネント別
- データセット
- 個別データセット
- EMR/EHR/臨床データ
- 請求データ
- 薬局データ
- 製品/疾患登録データ
- ゲノムデータ
- その他の個別データセット
- 統合データセット
- コンサルティングサービス
注:その他の個別データセットには、モバイル機器、ウェアラブル機器、ソーシャルメディアから生成されたデータが含まれます。
リアルワールドエビデンスソリューション市場評価:用途別
- 市場参入と償還/適用範囲の決定
- 医薬品開発・承認
- 腫瘍学
- 神経学
- 免疫学
- 心血管疾患
- その他の治療領域
- 市販後調査
- 医療機器の開発と承認
- その他の用途
注1:その他の治療領域には、感染症、筋骨格系疾患、皮膚疾患、呼吸器疾患が含まれます。
注2:その他の用途には、規制および臨床上の意思決定が含まれます。
リアルワールドエビデンスソリューション市場評価:エンドユーザー別
- 製薬、バイオテクノロジー、医療機器企業
- ヘルスケア支払者
- ヘルスケアプロバイダー
- その他のエンドユーザー
注:その他のエンドユーザーには、学術研究機関、患者支援団体、規制当局、医療技術評価機関などが含まれます。
リアルワールドエビデンスソリューション市場評価:地域別
- 北米
- 米国
- カナダ
- 欧州
- ドイツ
- フランス
- 英国
- イタリア
- スペイン
- スイス
- ベルギー
- その他欧州(RoE)
- アジア太平洋(APAC)
- 中国
- 日本
- インド
- 韓国
- 台湾
- シンガポール
- オーストラリア
- その他アジア太平洋地域(RoAPAC)
- ラテンアメリカ
- ブラジル
- メキシコ
- その他ラテンアメリカ(RoLATAM)
- 中東・アフリカ
目次
第1章 イントロダクション
第2章 調査手法
第3章 エグゼクティブサマリー
第4章 市場洞察
- 概要
- 市場成長の要因
- 市場力学
- 促進要因
- 個別化ヘルスケアへの注目の高まり
- 医薬品開発の遅延とそれに伴う開発コストの増加
- 慢性疾患の増加
- 価値に基づく医療へのシフト
- ヘルスケア分野におけるビッグデータの急増
- 抑制要因
- 実臨床試験への難色
- 機会
- 新興国
- エンドツーエンドのRWEサービスへの注目の高まり
- 課題
- RWE開発のための標準化された調査手法の欠如
- 促進要因
- 要因分析
- 市場力学
- 主要市場動向
- RWE産業における人工知能(AI)の導入
- AI技術の採用は以下の分野で拡大している:
- 臨床試験デザイン
- 患者のエンリッチメントとリクルートのモデリングと予測
- 治験実施医療機関の選択
- 患者のモニタリングと管理、服薬アドヒアランスとリテンション
- AIを活用した臨床試験分析
- 戦略的パートナーシップとコラボレーションによるAIソリューションのアウトソーシング
- AIソリューションによる市場参入
- AIソリューションによる市販後調査
- AI技術の採用は以下の分野で拡大している:
- 医薬品開発および商業化におけるRWEの採用拡大
- 企業統合の増加
- リアルワールドエビデンスによる患者アウトカムの改善と価値創造
- RWE産業における人工知能(AI)の導入
- AIベースのRWEソリューションのケーススタディ
- 医療機器の市販後調査のためのAIベースのRWEソリューション - Huma.AI(米国)
- 医薬品研究開発における臨床的意思決定を支援するAI対応RWEソリューション - Owkin, Inc.
- 市場アクセスのためのAI統合RWEソリューション - Medaffcon Oy(フィンランド)
- AIと機械学習アルゴリズムを活用した実データ洞察の活用 - Aetion, Inc.(米国) およびQuinten Health(フランス)
- 有害事象を追跡するAI搭載RWEプラットフォーム - Data2Life(イスラエル)
- AIを搭載したRWEソリューションで重症患者病棟の患者の健康状態を予測 - PHASTAR(英国)
- 規制分析
- 概要
- 北米
- 欧州
- アジア太平洋
- 世界のその他の地域
- 価格設定モデル(EMR/ゲノム/統合データセット)
- 概要
- 患者記録ごとの支払い(ボリュームベースの価格設定)
- 使用量ごとの支払い(バリューベース価格)
- 年間サブスクリプション
第5章 リアルワールドエビデンスソリューション市場評価:コンポーネント別
- 概要
- データセット
- 異なるデータセット
- EMR/EHR/臨床データ
- 請求データ
- 薬局データ
- 製品/疾患登録データ
- ゲノムデータ
- その他の個別データセット
- 統合データセット
- 異なるデータセット
- コンサルティングと分析
第6章 リアルワールドエビデンスソリューション市場評価:用途別
- 概要
- 市場参入と償還/適用範囲の決定
- 医薬品開発・承認
- がん領域
- 神経学
- 免疫学
- 心血管疾患
- その他の治療領域
- 市販後調査
- 医療機器開発・承認
- その他の用途
第7章 リアルワールドエビデンスソリューション市場評価:エンドユーザー別
- 概要
- 製薬、バイオテクノロジー、医療機器企業
- ヘルスケアペイヤー
- ヘルスケアプロバイダー
- その他のエンドユーザー
第8章 リアルワールドエビデンスソリューション市場評価:地域別
- 概要
- 北米
- 米国
- カナダ
- 欧州
- 英国
- ドイツ
- フランス
- イタリア
- スペイン
- スイス
- ベルギー
- その他欧州
- アジア太平洋
- 日本
- 中国
- インド
- 韓国
- オーストラリア
- 台湾
- シンガポール
- その他アジア太平洋
- ラテンアメリカ
- ブラジル
- メキシコ
- その他ラテンアメリカ
- 中東・アフリカ
第9章 競合情勢
- イントロダクション
- 主要成長戦略
- 競合ベンチマーキング
- 競合ダッシュボード
- 業界リーダー
- 市場差別化要因
- 先行企業
- 新興企業
- 市場シェア分析
- IQVIA Holdings Inc.(U.S.)
- Icon plc(IRELAND)
- Thermo Fisher Scientific Inc.(U.S.)
第10章 企業プロファイル
- IQVIA Holdings, Inc.
- Icon plc
- Thermo Fisher Scientific Inc.
- F. Hoffmann-La Roche Ltd
- Oracle Corporation
- Elevance Health, Inc.
- Clinigen Group Plc
- Cognizant Technology Solutions Corporation
- Revvity, Inc.
- SAS Institute Inc.
- Parexel International Corporation
- Healthverity, Inc.
第11章 付録
LIST OF TABLES
- Table 1 Total Cost Per Study, by Phase and Therapeutic Area (USD Million)
- Table 2 Sources of Healthcare Data
- Table 3 Number of People aged 65 years or Over, by Region, 2019 vs. 2050 (Million)
- Table 4 Strategic Developments of Key Players Related to the Integration of AI into RWE Solutions
- Table 5 Real-world Evidence Status in Latin America
- Table 6 Observed Indicative Prices of Real-world Data by Type (USD Per Patient Record)
- Table 7 Global Real-world Solutions Market, by Component, 2022-2031 (USD Million)
- Table 8 Global RWE Datasets Market, by Type, 2022-2031 (USD Million)
- Table 9 Global RWE Datasets Market, by Country/Region, 2022-2031 (USD Million)
- Table 10 Global RWE Disparate Datasets Market, by Type, 2022-2031 (USD Million)
- Table 11 Global RWE Disparate Datasets Market, by Country/Region, 2022-2031 (USD Million)
- Table 12 Global EMR/EHR/Clinical Data Market, by Country/Region, 2022-2031 (USD Million)
- Table 13 Global Claims and Billing Data Market, by Country/Region, 2022-2031 (USD Million)
- Table 14 Global Pharmacy Data Market, by Country/Region, 2022-2031 (USD Million)
- Table 15 Global Product/Disease Registries Data Market, by Country/Region, 2022-2031 (USD Million)
- Table 16 Global Genomics Data Market, by Country/Region, 2022-2031 (USD Million)
- Table 17 Global Other Disparate Datasets Market, by Country/Region, 2022-2031 (USD Million)
- Table 18 Global RWE Integrated Datasets Market, by Country/Region, 2022-2031 (USD Million)
- Table 19 Global RWE Consulting & Analytics market, by Country/Region, 2022-2031 (USD Million)
- Table 20 Global Real-world Solutions Market, by Application, 2022-2031 (USD Million)
- Table 21 Global RWE Solutions Market for Market Access & Reimbursement/Coverage Decisions, by Country/Region, 2022-2031 (USD Million)
- Table 22 Global RWE Solutions Market for Drug Development & Approvals, by Therapeutic Area, 2022-2031 (USD Million)
- Table 23 Global RWE Solutions Market for Drug Development & Approvals, by Country/Region, 2022-2031 (USD Million)
- Table 24 Global RWE Solutions Market for Oncology, by Country/Region, 2022-2031 (USD Million)
- Table 25 Global RWE Solutions Market for Neurology, by Country/Region, 2022-2031 (USD Million)
- Table 26 Global RWE Solutions Market for Immunology, by Country/Region, 2022-2031 (USD Million)
- Table 27 Estimated Medical Costs Associated with Cardiovascular Diseases (2020-2030) (USD Billion)
- Table 28 Global RWE Solutions Market for Cardiovascular Diseases, by Country/Region, 2022-2031 (USD Million)
- Table 29 Global RWE Solutions Market for Other Therapeutic Areas, by Country/Region, 2022-2031 (USD Million)
- Table 30 Global RWE Solutions Market for Post-market Surveillance, by Country/Region, 2022-2031 (USD Million)
- Table 31 Global RWE Solutions Market for Medical Device Development & Approvals, by Country/Region, 2022-2031 (USD Million)
- Table 32 Global RWE Solutions Market for Other Applications, by Country/Region, 2022-2031 (USD Million)
- Table 33 Global Real-world Solutions Market, by End User, 2022-2031 (USD Million)
- Table 34 Global RWE Solutions Market for Pharmaceutical, Biotechnology, and Medical Device Companies, by Country/Region, 2022-2031 (USD Million)
- Table 35 Global RWE Solutions Market for Healthcare Payers, by Country/Region, 2022-2031 (USD Million)
- Table 36 Global RWE Solutions Market for Healthcare Providers, by Country/Region, 2022-2031 (USD Million)
- Table 37 Global RWE Solutions Market for Other End Users, by Country/Region, 2022-2031 (USD Million)
- Table 38 Global RWE Solutions Market, by Country/Region, 2022-2031 (USD Million)
- Table 39 North America: RWE Solutions Market, by Country, 2022-2031 (USD Million)
- Table 40 North America: RWE Solutions Market, by Component, 2022-2031 (USD Million)
- Table 41 North America: RWE Datasets Market, By Type, 2022-2031 (USD Million)
- Table 42 North America: RWE Disparate Datasets Market, By Type, 2022-2031 (USD Million)
- Table 43 North America: RWE Solutions Market, by Application, 2022-2031 (USD Million)
- Table 44 North America: RWE Solutions Market for Drug Development & Approvals, by Therapeutic Area, 2022-2031 (USD Million)
- Table 45 North America: RWE Solutions Market, by End User, 2022-2031 (USD Million)
- Table 46 U.S.: RWE Solutions Market, by component, 2022-2031 (USD Million)
- Table 47 U.S.: RWE Datasets Market, By Type, 2022-2031 (USD Million)
- Table 48 U.S.: RWE Disparate Datasets Market, by Type, 2022-2031 (USD Million)
- Table 49 U.S.: RWE Solutions Market, by Application, 2022-2031 (USD Million)
- Table 50 U.S.: RWE Solutions Market for Drug Development & Approvals, by Therapeutic Area, 2022-2031 (USD Million)
- Table 51 U.S.: RWE Solution, by End User, 2022-2031 (USD Million)
- Table 52 Canada: RWE Solutions Market, by Component, 2022-2031 (USD Million)
- Table 53 Canada: RWE Datasets Market, by Type, 2022-2031 (USD Million)
- Table 54 Canada: RWE Disparate Datasets Market, by Type, 2022-2031 (USD Million)
- Table 55 Canada: RWE Solutions Market, by Application, 2022-2031 (USD Million)
- Table 56 Canada: RWE Solutions Market for Drug Development & Approvals, by Therapeutic Area, 2022-2031 (USD Million)
- Table 57 Canada: RWE Solution, by End User, 2022-2031 (USD Million)
- Table 58 EUROPE: RWE solutions Market, by Country/Region, 2022-2031 (USD Million)
- Table 59 Europe: RWE Solutions Market, by Component, 2022-2031 (USD Million)
- Table 60 Europe: RWE Datasets Market, by Type, 2022-2031 (USD Million)
- Table 61 Europe: RWE Disparate Datasets Market, by Type, 2022-2031 (USD Million)
- Table 62 Europe: RWE Solutions Market, by Application, 2022-2031 (USD Million)
- Table 63 Europe: RWE Solutions Market for Drug Development & Approvals, by Therapeutic Area, 2022-2031 (USD Million)
- Table 64 Europe: RWE Solutions Market, by End User, 2022-2031 (USD Million)
- Table 65 U.K.: Conferences and Workshops on Real-world Evidence Solutions
- Table 66 U.K.: RWE Solutions Market, by Component, 2022-2031 (USD Million)
- Table 67 U.K.: RWE Datasets Market, by Type, 2022-2031 (USD Million)
- Table 68 U.K.: RWE Disparate Datasets Market, By Type, 2022-2031 (USD Million)
- Table 69 U.K.: RWE Solutions Market, by Application, 2022-2031 (USD Million)
- Table 70 U.K.: RWE Solutions Market for Drug Development & Approvals, by Therapeutic Area, 2022-2031 (USD Million)
- Table 71 U.K.: RWE Solutions Market, by End User, 2022-2031 (USD Million)
- Table 72 Conferences, Symposia, and Workshops in Germany
- Table 73 Germany: RWE Solutions Market, by Component, 2022-2031 (USD Million)
- Table 74 Germany: RWE Datasets Market, by Type, 2022-2031 (USD Million)
- Table 75 Germany: RWE Disparate Datasets Market, by Type, 2022-2031 (USD Million)
- Table 76 Germany: RWE Solutions Market, by Application, 2022-2031 (USD Million)
- Table 77 Germany: RWE Solutions Market for Drug Development & Approvals, by Therapeutic Area, 2022-2031 (USD Million)
- Table 78 Germany: RWE Solutions Market, by End User, 2022-2031 (USD Million)
- Table 79 France: RWE Solutions Market, by Component, 2022-2031 (USD Million)
- Table 80 France: RWE Datasets Market, by Type, 2022-2031 (USD Million)
- Table 81 France: RWE Disparate Datasets Market, by Type, 2022-2031 (USD Million)
- Table 82 France: RWE Solutions Market, by Application, 2022-2031 (USD Million)
- Table 83 France: RWE Solutions Market for Drug Development & Approvals, by Therapeutic Area, 2022-2031 (USD Million)
- Table 84 France: RWE Solutions Market, by End User, 2022-2031 (USD Million)
- Table 85 Italy: RWE Solutions Market, by Component, 2022-2031 (USD Million)
- Table 86 Italy: RWE Datasets Market, by Type, 2022-2031 (USD Million)
- Table 87 Italy: RWE Disparate Datasets Market, by Type, 2022-2031 (USD Million)
- Table 88 Italy: RWE Solutions Market, by Application, 2022-2031 (USD Million)
- Table 89 Italy: RWE Solutions Market for Drug Development & Approvals, by Therapeutic Area, 2022-2031 (USD Million)
- Table 90 Italy: RWE Solutions Market, by End User, 2022-2031 (USD Million)
- Table 91 Spain: RWE Solutions Market, by Component, 2022-2031 (USD Million)
- Table 92 Spain: RWE Datasets Market, by Type, 2022-2031 (USD Million)
- Table 93 Spain: RWE Disparate Datasets Market, by Type, 2022-2031 (USD Million)
- Table 94 Spain: RWE Solutions Market, by Application, 2022-2031 (USD Million)
- Table 95 Spain: RWE Solutions Market for Drug Development & Approvals, by Therapeutic Area, 2022-2031 (USD Million)
- Table 96 Spain: RWE Solutions Market, by End User, 2022-2031 (USD Million)
- Table 97 Switzerland: RWE Solutions Market, by Component, 2022-2031 (USD Million)
- Table 98 Switzerland: RWE Datasets Market, by Type, 2022-2031 (USD Million)
- Table 99 Switzerland: RWE Disparate Datasets Market, by Type, 2022-2031 (USD Million)
- Table 100 Switzerland: RWE solutions Market, by Application, 2022-2031 (USD Million)
- Table 101 Switzerland: RWE Solutions Market for Drug Development & Approvals, by Therapeutic Area, 2022-2031 (USD Million)
- Table 102 Switzerland: RWE Solutions Market, by End User, 2022-2031 (USD Million)
- Table 103 Belgium: RWE Solutions Market, by Component, 2022-2031 (USD Million)
- Table 104 Belgium: RWE Datasets Market, by Type, 2022-2031 (USD Million)
- Table 105 Belgium: RWE Disparate Datasets Market, by Type, 2022-2031 (USD Million)
- Table 106 Belgium: RWE Solutions Market, by Application, 2022-2031 (USD Million)
- Table 107 Belgium: RWE Solutions Market For Drug Development & Approvals, by Therapeutic Area, 2022-2031 (USD Million)
- Table 108 Belgium: RWE Solutions Market, by End User, 2022-2031 (USD Million)
- Table 109 Rest of Europe: RWE Solutions Market, by Component, 2022-2031 (USD Million)
- Table 110 Rest of Europe: RWE Datasets Market, by Type, 2022-2031 (USD Million)
- Table 111 Rest of Europe: RWE Disparate Datasets Market, by Type, 2022-2031 (USD Million)
- Table 112 Rest of Europe: RWE Solutions Market, by Application, 2022-2031 (USD Million)
- Table 113 Rest of Europe: RWE Solutions Market for Drug Development & Approvals, BY Therapeutic Area, 2022-2031 (USD Million)
- Table 114 Rest of Europe: RWE Solutions Market, by End User, 2022-2031 (USD Million)
- Table 115 Asia-Pacific: RWE Solutions Market, by Country/Region, 2022-2031 (USD Million)
- Table 116 Asia-Pacific: RWE Solutions Market, by Component, 2022-2031 (USD Million)
- Table 117 Asia-Pacific: RWE Datasets Market, by Type, 2022-2031 (USD Million)
- Table 118 Asia-Pacific: RWE Disparate Datasets Market, By Type, 2022-2031 (USD Million)
- Table 119 Asia-Pacific: RWE Solutions Market, By Application, 2022-2031 (USD Million)
- Table 120 Asia-Pacific: RWE Market for Drug Development & Approvals, By Therapeutic Area, 2022-2031 (USD Million)
- Table 121 Asia-Pacific: RWE Solutions Market, by End User, 2022-2031 (USD Million)
- Table 122 Japan: RWE Solutions Market, by Component, 2022-2031 (USD Million)
- Table 123 Japan: RWE Datasets Market, by Type, 2022-2031 (USD Million)
- Table 124 Japan: RWE Disparate Datasets Market, by Type, 2022-2031 (USD Million)
- Table 125 Japan: RWE Solutions Market, by Application, 2022-2031 (USD Million)
- Table 126 Japan: RWE Market for Drug Development & Approvals, by Therapeutic Area, 2022-2031 (USD Million)
- Table 127 Japan: RWE Solutions Market by End User, 2022-2031 (USD Million)
- Table 128 Diversified Real-world Data Sources in China
- Table 129 China: RWE Solutions Market, by Component, 2022-2031 (USD Million)
- Table 130 China: RWE Datasets Market, by Type, 2022-2031 (USD Million)
- Table 131 China: RWE Disparate Datasets Market, by Type, 2022-2031 (USD Million)
- Table 132 China: RWE Solutions Market, by Application, 2022-2031 (USD Million)
- Table 133 China: RWE Market for Drug Development & Approvals, by Therapeutic Area, 2022-2031 (USD Million)
- Table 134 China: RWE Solutions Market by End User, 2022-2031 (USD Million)
- Table 135 India: RWE Solutions Market, by Component, 2022-2031 (USD Million)
- Table 136 INDIA: RWE Datasets Market, by Type, 2022-2031 (USD Million)
- Table 137 India: RWE Disparate Datasets Market, by Type, 2022-2031 (USD Million)
- Table 138 India: RWE Solutions Market, by Application, 2022-2031 (USD Million)
- Table 139 India: RWE Market for Drug Development & Approvals, By Therapeutic Area, 2022-2031 (USD Million)
- Table 140 India: RWE Solutions Market by End User, 2022-2031 (USD Million)
- Table 141 South Korea: RWE Solutions Market, by Component, 2022-2031 (USD Million)
- Table 142 South Korea: RWE Datasets Market, by Type, 2022-2031 (USD Million)
- Table 143 South Korea: RWE Disparate Datasets Market, by Type, 2022-2031 (USD Million)
- Table 144 South Korea: RWE Solutions Market, by Application, 2022-2031 (USD Million)
- Table 145 South Korea: RWE Market for Drug Development & Approvals, By Therapeutic Area, 2022-2031 (USD Million)
- Table 146 South Korea: RWE Solutions Market by End User, 2022-2031 (USD Million)
- Table 147 Australia: RWE Solutions Market, By Component, 2022-2031 (USD Million)
- Table 148 Australia: RWE Datasets Market, By Type, 2022-2031 (USD Million)
- Table 149 Australia: RWE Disparate Datasets Market, By Type, 2022-2031 (USD Million)
- Table 150 Australia: RWE Solutions Market, By Application, 2022-2031 (USD Million)
- Table 151 Australia: RWE Market for Drug Development & Approvals, By Therapeutic Area, 2022-2031 (USD Million)
- Table 152 Australia: RWE Solutions Market by End User, 2022-2031 (USD Million)
- Table 153 RWE Sources in Taiwan
- Table 154 Taiwan: RWE Solutions Market, By Component, 2022-2031 (USD Million)
- Table 155 TAIWAN: RWE Datasets Market, By Type, 2022-2031 (USD Million)
- Table 156 Taiwan: RWE Disparate Datasets Market, By Type, 2022-2031 (USD Million)
- Table 157 Taiwan: RWE Solutions Market, by Application, 2022-2031 (USD Million)
- Table 158 Taiwan: RWE Market for Drug Development & Approvals, By Therapeutic Area, 2022-2031 (USD Million)
- Table 159 Taiwan: RWE Solutions Market by End User, 2022-2031 (USD Million)
- Table 160 Currently, the Main Sources for Real-world Data (RWD) in Singapore are:
- Table 161 Singapore: RWE Solutions Market, by Component, 2022-2031 (USD Million)
- Table 162 Singapore: RWE Datasets Market, by Type, 2022-2031 (USD Million)
- Table 163 Singapore: RWE Disparate Datasets Market, by Type, 2022-2031 (USD Million)
- Table 164 Singapore: RWE Solutions Market, by Application, 2022-2031 (USD Million)
- Table 165 Singapore: RWE Market for Drug Development & Approvals, by Therapeutic Area, 2022-2031 (USD Million)
- Table 166 Singapore: RWE Solutions Market by End User, 2022-2031 (USD Million)
- Table 167 Estimated Number of New Cancer Cases from 2022 vs 2025
- Table 168 rest OF Asia-Pacific: RWE Solutions Market, By Component, 2022-2031 (USD Million)
- Table 169 Rest of Asia-Pacific: RWE Datasets Market, by Type, 2022-2031 (USD Million)
- Table 170 Rest of Asia-Pacific: RWE Disparate Datasets Market, By Type, 2022-2031 (USD Million)
- Table 171 Rest of Asia-Pacific: RWE Solutions Market, by Application, 2022-2031 (USD Million)
- Table 172 Rest of Asia-Pacific: RWE Market for Drug Development & Approvals, By Therapeutic Area, 2022-2031 (USD Million)
- Table 173 Rest of Asia-Pacific: RWE Market for Drug Development & Approvals, By End User, 2022-2031 (USD Million)
- Table 174 Latin America: RWE Solutions Market, by Country/Region, 2022-2031 (USD Million)
- Table 175 Latin America: RWE Solutions Market, by Component, 2022-2031 (USD Million)
- Table 176 Latin America: RWE Datasets Market, by Type, 2022-2031 (USD Million)
- Table 177 Latin America: RWE Disparate Datasets Market, by Type, 2022-2031 (USD Million)
- Table 178 Latin America: RWE Solutions Market, by application, 2022-2031 (USD Million)
- Table 179 Latin America: RWE Solutions Market for Drug Development & Approvals, by Therapeutic Area, 2022-2031 (USD Million)
- Table 180 Latin America: RWE Solutions Market, by End User, 2022-2031 (USD Million)
- Table 181 Brazil: RWE Solutions Market, by Component, 2022-2031 (USD Million)
- Table 182 Brazil: RWE Datasets Market, by Type, 2022-2031 (USD Million)
- Table 183 Brazil: RWE Disparate Datasets Market, by Type, 2022-2031 (USD Million)
- Table 184 Brazil: RWE Solutions Market, by Application, 2022-2031 (USD Million)
- Table 185 Brazil: RWE Solutions Market for Drug Development & Approvals, by Therapeutic Area, 2022-2031 (USD Million)
- Table 186 Brazil: RWE Solutions Market, by End User, 2022-2031 (USD Million)
- Table 187 Mexico: RWE Solutions Market Size, by Component, 2022-2031 (USD Million)
- Table 188 Mexico: RWE Datasets Market Size, by Type, 2022-2031 (USD Million)
- Table 189 Mexico: RWE Disparate Datasets Market, By Type, 2022-2031 (USD Million)
- Table 190 Mexico: RWE Solutions Market, By Application, 2022-2031 (USD Million)
- Table 191 Mexico: RWE Solutions Market for Drug Development & Approvals, By Therapeutic Area, 2022-2031 (USD Million)
- Table 192 Mexico: RWE Market for Drug Development & Approvals, By End User, 2022-2031 (USD Million)
- Table 193 Rest of Latin America: RWE Solutions Market, By Component, 2022-2031 (USD Million)
- Table 194 Rest of Latin America: RWE Datasets Market, By Type, 2022-2031 (USD Million)
- Table 195 Rest of Latin America: RWE Disparate Datasets Market, By Type, 2022-2031 (USD Million)
- Table 196 Rest of Latin America: RWE Solutions Market, By Application, 2022-2031 (USD Million)
- Table 197 Rest of Latin America: RWE Solutions Market for Drug Development & Approvals, by Therapeutic Area, 2022-2031 (USD Million)
- Table 198 Rest of Latin America: RWE Solutions Market, by End User, 2022-2031 (USD Million)
- Table 199 Middle East & Africa: RWE Solutions Market, by Component, 2022-2031 (USD Million)
- Table 200 Middle East & Africa: RWE Datasets Market, By Type, 2022-2031 (USD Million)
- Table 201 Middle East & Africa: RWE Disparate Datasets Market, by Type, 2022-2031 (USD Million)
- Table 202 Middle East & Africa: RWE Solutions Market Size, By Application, 2022-2031 (USD Million)
- Table 203 Middle East & Africa: RWE Solutions Market size For Drug Development & Approvals, By Therapeutic Area, 2022-2031 (USD Million)
- Table 204 Middle East & Africa: RWE Solutions Market, By End User, 2022-2031 (USD Million)
- Table 205 Recent Developments, By Company, 2021-2024
LIST OF FIGURES
- Figure 1 Research Process
- Figure 2 Secondary Sources Referenced For This Study
- Figure 3 Primary Research Techniques
- Figure 4 Key Executives Interviewed
- Figure 5 Breakdown of Primary Interviews (Supply-side & Demand-side)
- Figure 6 Market Sizing & Growth Forecast Approach
- Figure 7 Global RWE Solutions Market, By Component, 2024 Vs. 2031 (USD Million)
- Figure 8 Global RWE Solutions Market, By Application, 2024 Vs. 2031 (USD Million)
- Figure 9 Global RWE Solutions Market, By End User, 2024 Vs. 2031 (USD Million)
- Figure 10 RWE Solutions Market, By Geography 2024 Vs. 2031 (USD Million)
- Figure 11 Impact Analysis of Market Dynamics
- Figure 12 Personalized Medicines Approved of Total New Molecular Entities, 2015-2022 (%)
- Figure 13 Share of Clinical Trials Conducted Between 2017-2021, By Region (%)
- Figure 14 Global Real-World Solutions Market, By Component, 2024 Vs. 2031 (USD Million)
- Figure 15 Global Real-World Solutions Market, By Application, 2024 Vs. 2031 (USD Million)
- Figure 16 Global Real-World Solutions Market, By End User, 2024 Vs. 2031 (USD Million)
- Figure 17 Global RWE Solutions Market, By Country/Region, 2024 Vs. 2031 (USD Million)
- Figure 18 North America: RWE Solutions Market Snapshot
- Figure 19 U.S: Number of Novel Drug Approvals (2016-2023)
- Figure 20 Europe: RWE Solutions Market Snapshot
- Figure 21 France: Share of Population Aged 65 and Above, 2017-2023
- Figure 22 Spain: Pharmaceutical R&D Expenditure, 2019-2022 (USD Million)
- Figure 23 Switzerland: Pharmaceutical R&D Expenditure, 2019-2022 (USD Million)
- Figure 24 Pharmaceutical Production in Belgium, 2019-2022 (USD Million)
- Figure 25 Asia-Pacific: Real-World Evidence Solutions Market Snapshot
- Figure 26 Latin America: RWE Solutions Market Snapshot
- Figure 27 Key Growth Strategies Adopted By Leading Players, 2021-2024
- Figure 28 Real-World Evidence (RWE) Solutions Market: Competitive Benchmarking, by Component
- Figure 29 Real-World Evidence (RWE) Solutions Market: Competitive Benchmarking, by Region
- Figure 30 Competitive Dashboard: Real-World Evidence (RWE) Solutions Market
- Figure 31 Market Share Analysis: Real-World Evidence (RWE) Solutions Industry, 2023
- Figure 32 IQVIA Holdings, Inc.: Financial Overview (2023)
- Figure 33 ICON plc: Financial Overview (2023)
- Figure 34 Thermo Fisher Scientific, Inc.: Financial Snapshot (2023)
- Figure 35 F. Hoffmann-La Roche Ltd.: Financial Snapshot (2023)
- Figure 36 Oracle Corporation: Financial Snapshot (2023)
- Figure 37 Elevance Health, Inc.: Financial Overview (2023)
- Figure 38 Cognizant Technology Solutions Corporation: Financial Snapshot (2023)
- Figure 39 Revvity, Inc.: Financial Snapshot (2023)
- Figure 40 SAS Institute Inc.: Financial Snapshot (2023)
Real-world Evidence Solutions Market Size, Share, Forecast, & Trends Analysis by Component (Datasets [Clinical, Claims, Pharmacy], Services) Application (Market Access, Drug Development & Approvals, PMS), and End User-Global Forecast to 2031
The global RWE solutions market was valued at $2.62 billion in 2023. This market is expected to reach $6.37 billion by 2031 from an estimated $2.94 billion in 2024, at a CAGR of 11.7% during the forecast period of 2024-2031.
Following a comprehensive primary & secondary study and an in-depth analysis of the market scenario, this report provides the key drivers, constraints, challenges, and opportunities of the industry. This market is driven by the growing incidence of chronic diseases, delays in drug development and the consequent increase in development costs, the rising focus on personalized healthcare, a shift toward value-based care, and the growing adoption of real-world evidence solutions in drug development & commercialization. For instance, IQVIA introduced One Home for Sites in June 2024. This digital platform serves as a dashboard for all the essential systems and tasks needed by a clinical research site to conduct clinical trials.
Furthermore, emerging economies and a rising focus on end-to-end RWE services provide significant growth opportunities for the real-world solutions market. However, the market's expansion may be constrained by the unwillingness to rely on real-world research and the absence of quality control in data collection. Additionally, the lack of standardized methodologies for developing RWE and data privacy and security concerns pose a major challenge for the players operating in this market.
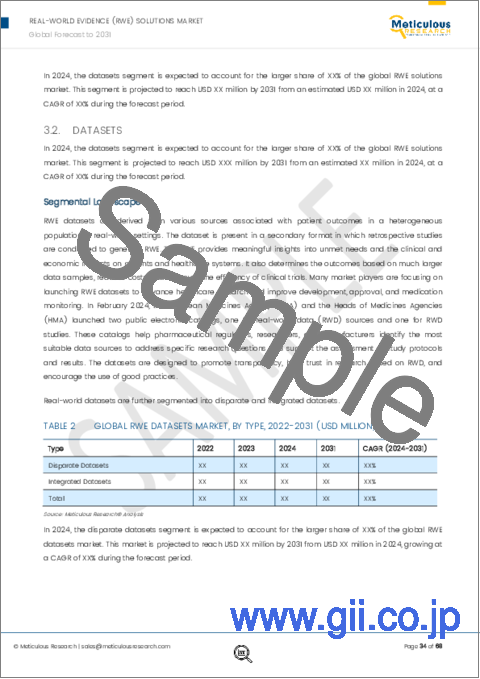
Among components, in 2024, the datasets segment is expected to account for the largest share of the RWE solutions market. RWE datasets originate from a range of sources related to patient outcomes in diverse populations in real-world contexts. With regard to unfulfilled needs and the financial and clinical effects on patients and healthcare systems, this solution offers insightful information. Additionally, it bases results on far larger data sets, lower expenses, and more effective clinical trial management.
Among applications, in 2024, the market access & reimbursement/coverage decisions segment is expected to account for the largest share of the RWE solutions market. Using predictive analysis and data-driven insights, RWE solutions for market access enable a comprehensive assessment of a medical product's efficacy and value, which can support value-based pricing strategies and result in favorable reimbursement outcomes. The significant market share is ascribed to several factors, including escalating healthcare expenses, growing regulatory body acceptance of RWE, expanding significance of clinical value evidence in coverage determinations, and the availability of supplementary data regarding treatment efficacy in routine care environments and heterogeneous patient cohorts.
Among end users, in 2024, the pharmaceutical, biotechnology, and medical device companies segment is expected to account for the largest share of the RWE solutions market. Several variables, including the growing use of RWE to gather real-time post-trial data about medications, monitor drug reactions, and prove the worth of newly created therapies outside of clinical trials, as well as expedited drug trials and extended approvals, are responsible for a substantial share of the segment.
An in-depth analysis of the global RWE solutions market's geographical scenario provides detailed qualitative and quantitative insights for the five major geographies (North America, Europe, Asia-Pacific, the Middle East & Africa, and Latin America). It covers the major countries in each region.
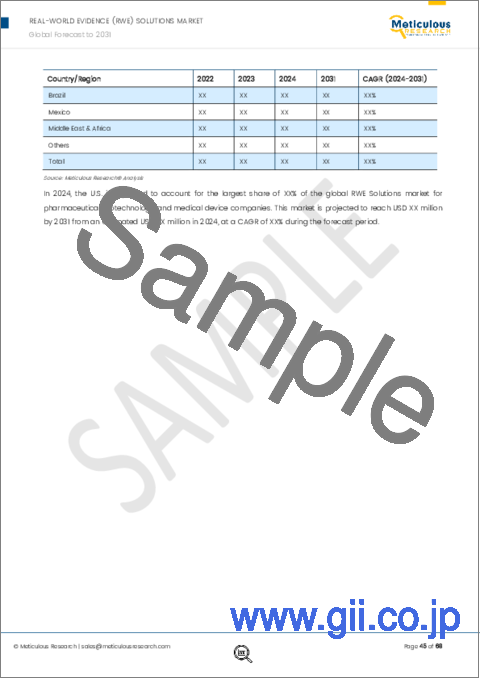
In 2024, North America is expected to account for the largest share of the global RWE solutions market, followed by Europe, Asia-Pacific, Latin America, and the Middle East & Africa. The substantial share of North America can be attributed to various factors, including the rising incidence of chronic illnesses, stricter guidelines for medication approvals, the 21st Century Cures Act, the broad accessibility of electronic datasets, a firmly established healthcare industry, and the growing application of big data in healthcare.
The key players operating in the global RWE solutions market are IQVIA Holdings Inc. (U.S.), Elevance Health, Inc. (U.S.), ICON plc (Ireland), Clinigen Group plc (U.K.), Cognizant Technology Solutions Corporation (U.S.), Revvity, Inc. (U.S.), F. Hoffmann-La Roche Ltd (Switzerland), Thermo Fisher Scientific Inc. (U.S.), Oracle Corporation (U.S.), SAS Institute Inc. (U.S.), Parexel International Corporation (U.S.), and HealthVerity, Inc. (U.S.).
Scope of the Report:
Real-world Evidence Solutions Market Assessment-by Component
- Datasets
- Disparate Datasets
- EMR/EHR/Clinical Data
- Claims & Billing Data
- Pharmacy Data
- Product/Disease Registries Data
- Genomics Data
- Other Disparate Datasets
- Integrated Datasets
- Consulting Services
Note: Other Disparate Datasets include data generated from mobile devices, wearable devices, and social media.
Real-world Evidence Solutions Market Assessment-by Application
- Market Access & Reimbursement/Coverage Decisions
- Drug Development & Approvals
- Oncology
- Neurology
- Immunology
- Cardiovascular Diseases
- Other Therapeutic Areas
- Post Market Surveillance
- Medical Device Development & Approvals
- Other Applications
Note: 1) Other Therapeutic Areas include infectious diseases, musculoskeletal disorders, dermatological diseases, and respiratory diseases.
2) Other Applications include regulatory and clinical decision-making.
Real-world Evidence Solutions Market Assessment-by End User
- Pharmaceutical, Biotechnology, and Medical Device Companies
- Healthcare Payers
- Healthcare Providers
- Other End Users
Note: Other end users include academic & research institutions, patient advocacy groups, regulators, and health technology assessment agencies.
Real-world Evidence Solutions Market Assessment-by Geography
- North America
- U.S.
- Canada
- Europe
- Germany
- France
- U.K
- Italy
- Spain
- Switzerland
- Belgium
- Rest of Europe (RoE)
- Asia-Pacific (APAC)
- China
- Japan
- India
- South Korea
- Taiwan
- Singapore
- Australia
- Rest of Asia-Pacific (RoAPAC)
- Latin America
- Brazil
- Mexico
- Rest of Latin America (RoLATAM)
- Middle East & Africa
TABLE OF CONTENTS
1. Introduction
- 1.1. Market Definition & Scope
- 1.2. Market Ecosystem
- 1.3. Currency & Limitations
- 1.4. Key Stakeholders
2. Research Methodology
- 2.1. Research Process
- 2.2. Data Collection & Validation Process
- 2.2.1. Secondary Research
- 2.2.2. Primary Research/Interviews with Key Opinion Leaders from the Industry
- 2.3. Market Sizing & Forecasting
- 2.3.1. Market Size Estimation Approach
- 2.3.2. Growth Forecast Approach
- 2.3.3. Market Share Analysis
- 2.4. Assumptions For the Study
3. Executive Summary
4. Market Insights
- 4.1. Overview
- 4.2. Factors Affecting Market Growth
- 4.2.1. Market Dynamics
- 4.2.1.1. Drivers
- 4.2.1.1.1. Rising Focus on Personalized Healthcare
- 4.2.1.1.2. Delays in Drug Development and the Consequent Increase in Development Costs
- 4.2.1.1.3. Growing Incidence of Chronic Diseases
- 4.2.1.1.4. Shift toward Value-based Care
- 4.2.1.1.5. Rapidly Growing Big Data in the Healthcare Sector
- 4.2.1.2. Restraints
- 4.2.1.2.1. Reluctance to Rely on Real-world Studies
- 4.2.1.3. Opportunities
- 4.2.1.3.1. Emerging economies
- 4.2.1.3.2. Rising Focus on End-to-End RWE Services
- 4.2.1.4. Challenges
- 4.2.1.4.1. Lack of Standardized Methodologies for Developing RWE
- 4.2.1.1. Drivers
- 4.2.2. Factors Analysis
- 4.2.1. Market Dynamics
- 4.3. Key Market Trends
- 4.3.1. The Incorporation of Artificial Intelligence (AI) in the RWE Industry
- 4.3.1.1. The Adoption of AI Technologies is Growing in the Following Areas:
- 4.3.1.1.1. Clinical Trials Design
- 4.3.1.1.2. Modeling and Forecasting Patient Enrichment & Recruitment
- 4.3.1.1.3. Selecting Investigator Site
- 4.3.1.1.4. Patient Monitoring & Managing and Medication Adherence & Retention
- 4.3.1.1.5. AI-enabled Clinical Trial Analytics
- 4.3.1.1.6. Outsourcing Essential AI Solutions via Strategic Partnerships & Collaborations
- 4.3.1.1.7. Market Access Using AI Solutions
- 4.3.1.1.8. Post-market Surveillance Using AI Solutions
- 4.3.1.1. The Adoption of AI Technologies is Growing in the Following Areas:
- 4.3.2. Growing Adoption of RWE In Drug Development and Commercialization
- 4.3.3. Rising Number of Consolidations
- 4.3.4. Improved Patient Outcomes and Value Creation from Real-World Evidence
- 4.3.1. The Incorporation of Artificial Intelligence (AI) in the RWE Industry
- 4.4. Case Studies For AI-based RWE Solutions
- 4.4.1. AI-based RWE Solutions for Medical Device Post-market Studies - Huma.AI (U.S.)
- 4.4.2. AI-enabled RWE Solutions to Support Clinical Decision-making in Drug Research & Development - Owkin, Inc. (France)
- 4.4.3. AI-integrated RWE Solutions for Market Access - Medaffcon Oy (Finland)
- 4.4.4. Leveraging Real-world Data Insights Using AI & Machine Learning Algorithms - Aetion, Inc. (U.S.) & Quinten Health (France)
- 4.4.5. AI-powered RWE Platform to Track Adverse Events - Data2Life (Israel)
- 4.4.6. AI-powered RWE Solutions to Predict Patients' Health at Critical Care Units - PHASTAR (U.K.)
- 4.5. Regulatory Analysis
- 4.5.1. Overview
- 4.5.2. North America
- 4.5.3. Europe
- 4.5.4. Asia-Pacific
- 4.5.5. Rest of the World
- 4.6. Pricing Models (EMR/Genomic/Integrated Datasets)
- 4.6.1. Overview
- 4.6.2. Pay Per Patient Record (Volume-based Pricing)
- 4.6.3. Pay Per Usage (Value-based Pricing)
- 4.6.4. Annual Subscription
5. Real-World Evidence (RWE) Solutions Market Assessment-by Component
- 5.1. Overview
- 5.2. Datasets
- 5.2.1. Disparate Datasets
- 5.2.1.1. EMR/EHR/Clinical Data
- 5.2.1.2. Claims & Billing Data
- 5.2.1.3. Pharmacy Data
- 5.2.1.4. Product/Disease Registries Data
- 5.2.1.5. Genomics Data
- 5.2.1.6. Other Disparate Datasets
- 5.2.2. Integrated Datasets
- 5.2.1. Disparate Datasets
- 5.3. Consulting & Analytics
6. Real-World Evidence Solutions Market Assessment-by Application
- 6.1. Overview
- 6.2. Market Access & Reimbursement/Coverage Decisions
- 6.3. Drug Development & Approvals
- 6.3.1. Oncology
- 6.3.2. Neurology
- 6.3.3. Immunology
- 6.3.4. Cardiovascular Diseases
- 6.3.5. Other Therapeutic Areas
- 6.4. Post-market Surveillance
- 6.5. Medical Device Development & Approvals
- 6.6. Other Applications
7. Real-World Evidence (RWE) Solutions Market Assessment-by End User
- 7.1. Overview
- 7.2. Pharmaceutical, Biotechnology, and Medical Device Companies
- 7.3. Healthcare Payers
- 7.4. Healthcare Providers
- 7.5. Other End Users
8. Real-world Evidence Solutions Market Assessment-by geography
- 8.1. Overview
- 8.2. North America
- 8.2.1. U.S.
- 8.2.2. Canada
- 8.3. Europe
- 8.3.1. U.K.
- 8.3.2. Germany
- 8.3.3. France
- 8.3.4. Italy
- 8.3.5. Spain
- 8.3.6. Switzerland
- 8.3.7. Belgium
- 8.3.8. Rest of Europe
- 8.4. Asia-Pacific
- 8.4.1. Japan
- 8.4.2. China
- 8.4.3. India
- 8.4.4. South Korea
- 8.4.5. Australia
- 8.4.6. Taiwan
- 8.4.7. Singapore
- 8.4.8. Rest of Asia-Pacific
- 8.5. Latin America
- 8.5.1. Brazil
- 8.5.2. Mexico
- 8.5.3. Rest of Latin America
- 8.6. Middle East & Africa
9. Competitive Landscape
- 9.1. Introduction
- 9.2. Key Growth Strategies
- 9.3. Competitive Benchmarking
- 9.4. Competitive Dashboard
- 9.4.1. Industry Leaders
- 9.4.2. Market Differentiators
- 9.4.3. Vanguards
- 9.4.4. Emerging Companies
- 9.5. Market Share Analysis
- 9.5.1. IQVIA Holdings Inc. (U.S.)
- 9.5.2. Icon plc (IRELAND)
- 9.5.3. Thermo Fisher Scientific Inc. (U.S.)
10. Company Profiles
- 10.1. IQVIA Holdings, Inc.
- 10.2. Icon plc
- 10.3. Thermo Fisher Scientific Inc.
- 10.4. F. Hoffmann-La Roche Ltd
- 10.5. Oracle Corporation
- 10.6. Elevance Health, Inc.
- 10.7. Clinigen Group Plc
- 10.8. Cognizant Technology Solutions Corporation
- 10.9. Revvity, Inc.
- 10.10. SAS Institute Inc.
- 10.11. Parexel International Corporation
- 10.12. Healthverity, Inc.
11. Appendix
- 11.1. Available Customization
- 11.2. Related Reports

