|
|
市場調査レポート
商品コード
1486915
食用昆虫の市場規模、シェア、予測、動向分析:製品別、昆虫タイプ別、用途別、地域別 - 2033年までの世界予測Edible Insects Market Size, Share, Forecast, & Trends Analysis by Product, Insect Type, Application, and Geography - Global Forecast to 2033 |
||||||

|
|||||||
カスタマイズ可能
|
|||||||

| 食用昆虫の市場規模、シェア、予測、動向分析:製品別、昆虫タイプ別、用途別、地域別 - 2033年までの世界予測 |
|
出版日: 2024年05月30日
発行: Meticulous Research
ページ情報: 英文 298 Pages
納期: 即納可能
|

全表示
- 概要
- 図表
- 目次
食用昆虫の市場規模、シェア、予測、製品タイプ別(昆虫全体、昆虫粉末、昆虫ミール、昆虫油)、昆虫タイプ別(コオロギ、ブラックソルジャーフライ、ミールワーム)、用途別(動物飼料、プロテインバー&シェイク、ベーカリー、菓子類、飲料)、地域別の動向分析-2033年までの世界予測
「食用昆虫市場評価:製品タイプ別(昆虫全体、昆虫粉末、昆虫ミール、昆虫油)、昆虫タイプ別(コオロギ、ブラックソルジャーフライ、ミールワーム)、用途別(動物飼料、プロテインバー&シェイク、ベーカリー、菓子類、飲料)、地域別の市場規模、シェア、予測、動向分析-2033年までの世界予測」と題する調査報告書によると、食用昆虫市場は2033年までに179億米ドルに達すると予測されています。2024年から2033年までの予測期間中のCAGRは28.6%で、2033年までに90億米ドルに達すると予測され、量的には、2024年から2033年までのCAGRは36.3%で、2033年までに470万トンに達すると予測されます。当レポートでは、主要5地域の食用昆虫市場を詳細に分析し、現在の市場動向、市場規模、最近の市場開拓、2033年までの予測などをまとめています。
広範な2次調査と1次調査、市場シナリオの詳細な分析を経て、主要産業の促進要因、抑制要因、機会、課題、動向の影響分析を実施しています。食用昆虫市場の成長は、主に畜産・養鶏産業からの温室効果ガス排出量の増加、食用昆虫の高い栄養価、食用昆虫の環境面での利点、動物飼料産業における昆虫タンパク質の需要の高まり、食用昆虫の消費による人獣共通感染症の感染リスクの低さによってもたらされます。さらに、新興経済諸国および先進経済諸国における事業拡大が、この市場で事業を展開するプレーヤーに成長機会をもたらすと期待されています。
しかし、標準化された規制の枠組みがないこと、昆虫を食品として消費することに対する心理的・倫理的障壁、昆虫の消費によるアレルギーのリスクがこの市場の成長を抑制しています。さらに、昆虫食の利点に関する認識不足や生産規模の拡大における限界は、市場成長に影響を与える主要課題です。
食用昆虫市場は、製品別(昆虫全体、昆虫粉末、昆虫ミール、昆虫油)、昆虫タイプ別(コオロギ、黒兵児蝿、ミールワーム、水牛虫、バッタ、アリ、蚕、セミ、その他の食用昆虫)、用途別(食品・飲料、飼料・ペットフード)、最終用途別(人間消費、動物栄養)、地域別に区分されています。また、業界の競合他社を評価し、国レベルの市場も分析しています。
目次
第1章 イントロダクション
第2章 調査手法
第3章 エグゼクティブサマリー
- 概要
- セグメント分析
- 食用昆虫市場評価:製品別
- 食用昆虫市場評価:昆虫タイプ別
- 食用昆虫市場評価:用途別
- 食用昆虫市場評価:最終用途別
- 食用昆虫市場評価:地域別
- 競合情勢と市場競争
第4章 市場洞察
- 市場
- 概要
- 市場成長に影響を与える要因
- 畜産・養鶏産業からの温室効果ガス排出量の増加が代替タンパク質源の必要性を促進
- 食用昆虫の消費を促進する高い栄養価
- 食用昆虫の環境面での利点が普及を後押し
- 飼料産業における昆虫タンパク質の需要増加が市場成長を促進
- 人獣共通感染症を伝播するリスクの低さが食用昆虫の消費を支える
- 標準化された規制枠組みの欠如が市場の成長を抑制
- 食用昆虫の採用を制限する、昆虫を食品として消費することに対する心理的・倫理的障壁
- 昆虫摂取によるアレルギーのリスクが市場成長を妨げる
- 新興経済諸国と発展途上経済諸国における事業拡大が市場参入者に成長機会を提供する見込み
- 昆虫食の利点に関する認識不足が市場成長に影響
- 生産規模拡大の限界が市場プレイヤーの主要課題として残る見込み
- 価格分析
- 概要
- 昆虫全体
- 昆虫粉末
- 昆虫ミール
- 昆虫油
- 規制分析
- 北米
- 欧州
- アジア太平洋
- 世界のその他の地域
- ポーターのファイブフォース分析
第5章 食用昆虫の世界市場評価:製品別
- 概要
- 昆虫全体
- 昆虫粉末
- 昆虫ミール
- 幼虫/昆虫油
第6章 食用昆虫の世界市場評価:昆虫タイプ別
- 概要
- コオロギ
- ブラックソルジャーフライ
- ミールワーム
- バッファローワーム
- バッタ
- アリ
- カイコ
- セミ
- その他の食用昆虫
第7章 食用昆虫の世界市場評価:用途別
- 概要
- 食品・飲料
- 昆虫加工品
- 昆虫粉末加工品
- プロテインバー&プロテインシェイク
- 焼き菓子・スナック
- 昆虫菓子類
- 昆虫飲料
- その他の食品・飲料用途
- 飼料・ペットフード
- 水産養殖用飼料
- 動物用飼料
- ペットフード
第8章 食用昆虫の世界市場評価:最終用途別
- 概要
- 人間消費
- 動物栄養
第9章 食用昆虫の世界市場評価:地域別
- アジア太平洋
- タイ
- 中国
- 韓国
- ベトナム
- 日本
- オーストラリア
- その他アジア太平洋
- 欧州
- オランダ
- ベルギー
- フランス
- デンマーク
- フィンランド
- ドイツ
- その他欧州(RoE)
- 北米
- 米国
- カナダ
- ラテンアメリカ
- メキシコ
- ブラジル
- 中東・アフリカ
第10章 競合分析
- 概要
- 主要成長戦略
- 競合ベンチマーキング
- 競合ダッシュボード
- 業界リーダー
- 市場差別化要因
- 先行企業
- 新興企業
- 世界の食用昆虫市場:各社の市況分析
- 主要企業の生産能力
第11章 企業プロファイル(企業概要、財務概要、製品ポートフォリオ、戦略的展開)
- Protix B.V.
- Ynsect(SAS)
- InnovaFeed SAS
- EnviroFlight, Llc
- Nutrition Technologies Group
- Bioflytech S.L.
- Entomo Farms
- Aspire Food Group
- Global Bugs Asia Co., Ltd.
- Entobel Holding Pte. Ltd.
- Entofood Sdn Bhd
- SFly Comgraf SAS
- Hexafly
- F4F SpA
- Protenga Pte Ltd.
- NextProtein
- Enorm Biofactory A/S
- Hargol FoodTech
- All Things Bugs, Llc
- Beta Hatch
- Armstrong Crickets Georgia
- Jr Unique Foods Ltd.
- TEBRIO
- Hipromine S.A.
(注:上位5社のSWOT分析を掲載)
第12章 新興スタートアップ企業
- Protanica Co. Ltd.
- Pro-Meal (Promeal Animal Feeds)
- CricketOne Asia
- Eat Crawlers
- BugEra
- Entoprotech Ltd
- Insectta
- Entosystem Inc.
- INSECTIFii India Pvt. Ltd.
- Agroloop Hungary Kft.
- Soldier Fly Technologies, Inc.
- Life Origin
- Insectum ApS
- Keetup and Co.
- Loopworm Pvt. Ltd.
- Ento Proteins Private Limited
- UltraNutri
- Insectika Biotech Private Limited (IBPL)
- Freshrooms Lifesciences Private Limited
- Kovai BSF
- Exocycle
- Bioforte Biotechnology (Shenzhen) Co., Ltd.
- Guangzhou Unique Biotechnology Co., Ltd
- Symton Inc.
- Beta Bugs Ltd.
- Snas Bio-Tech
- Farminsect Gmbh
- Hermetia Baruth GmbH
- Volare Solutions
- Nasekomo
- Mutatec
- Nextalim SAS
- Insectum UAB
- Entogreen - Ingredient Odyssey, S.A.
- Cyns
- Illucens Mexico Entobiorrefineria
- Proticycle
- Circa Biotech
- CricketOne
- Flylab Tech Co., Ltd
- Invertapro As
- Prime Insects
- Bulgarian Insect Company
第13章 付録
LIST OF TABLES
- Table 1 Average Selling Prices of Whole Insects, by Country/Region, 2022-2033 (USD/Ton)
- Table 2 Average Selling Prices of Insect Powder, by Country/Region, 2022-2033 (USD/Ton)
- Table 3 Average Selling Prices of Insect Meal, by Country/Region, 2022-2033 (USD/Ton)
- Table 4 Average Selling Prices of Insect Oil, by Country/Region, 2022-2033 (USD/Ton)
- Table 5 Global Edible Insects Market, by Product, 2022-2033 (USD Million)
- Table 6 Global Edible Insects Market, by Product, 2022-2033 (Tons)
- Table 7 Global Whole Edible Insects Market, by Country/Region, 2022-2033 (USD Million)
- Table 8 Global Whole Edible Insects Market, by Country/Region, 2022-2033 (Tons)
- Table 9 Global Edible Insect Powder Market, by Country/Region, 2022-2033 (USD Million)
- Table 10 Global Edible Insect Powder Market, by Country/Region, 2022-2033 (Tons)
- Table 11 Global Insect Meal Market, by Country/Region, 2022-2033 (USD Million)
- Table 12 Global Insect Meal Market, by Country/Region, 2022-2033 (Tons)
- Table 13 Global Edible Insect Oil Market, by Country/Region, 2022-2033 (USD Million)
- Table 14 Global Edible Insect Oil Market, by Country/Region, 2022-2033 (Tons)
- Table 15 Global Edible Insects Market, by Insect Type, 2022-2033 (USD Million)
- Table 16 Cricket Species as Feed for Animals And Pets
- Table 17 Global Crickets Market, by Country/Region, 2022-2033 (USD Million)
- Table 18 Global Black Soldier Flies Market, by Country/Region, 2022-2033 (USD Million)
- Table 19 Global Mealworms Market, by Country/Region, 2022-2033 (USD Million)
- Table 20 Global Buffalo Worms Market, by Country/Region, 2022-2033 (USD Million)
- Table 21 Global Grasshoppers Market, by Country/Region, 2022-2033 (USD Million)
- Table 22 Global Ants Market, by Country/Region, 2022-2033 (USD Million)
- Table 23 Global Silkworms Market, by Country/Region, 2022-2033 (USD Million)
- Table 24 Global Cicadas Market, by Country/Region, 2022-2033 (USD Million)
- Table 25 Global Other Edible Insects Market, by Country/Region, 2022-2033 (USD Million)
- Table 26 Global Edible Insects Market, by Application, 2022-2033 (USD Million)
- Table 27 Global Edible Insects Market for Food & Beverage, by Product Type, 2022-2033 (USD Million)
- Table 28 Global Edible Insects Market for Food & Beverage, by Country/Region,2022-2033 (USD Million)
- Table 29 Global Edible Insects Market for Processed Whole Insects, by Country/Region, 2022-2033 (USD Million)
- Table 30 Global Edible Insects Market for Processed Insect Powder, by Country/Region, 2022-2033 (USD Million)
- Table 31 Global Edible Insects Market for Protein Bars & Protein Shakes, by Country/Region, 2022-2033 (USD Million)
- Table 32 Global Edible Insects Market for Baked Products & Snacks, by Country/Region, 2022-2033 (USD Million)
- Table 33 Global Edible Insects Market for Insect Confectioneries, by Country/Region, 2022-2033 (USD Million)
- Table 34 Global Edible Insects Market for Insect Beverages, by Country/Region,2022-2033 (USD Million)
- Table 35 Global Edible Insects Market for Other Food & Beverage Applications, by Country/Region, 2022-2033 (USD Million)
- Table 36 Global Edible Insects Market for Feed & Pet Food, by Product Type, 2022-2033 (USD Million)
- Table 37 Global Edible Insects Market for Feed & Pet Food, by Country/Region, 2022-2033 (USD Million)
- Table 38 Global Edible Insects Market for Aquaculture Feed, by Country/Region, 2022-2033 (USD Million)
- Table 39 Global Edible Insects Market for Animal Feed, by Country/Region, 2022-2033 (USD Million)
- Table 40 Global Edible Insects Market for Pet Food, by Country/Region, 2022-2033 (USD Million)
- Table 41 Global Edible Insects Market, by End Use, 2022-2033 (USD Million)
- Table 42 Global Edible Insects Market for Human Consumption, by Country/Region, 2022-2033 (USD Million)
- Table 43 Global Edible Insects Market for Animal Nutrition, by Country/Region, 2022-2033 (USD Million)
- Table 44 Global Edible Insects Market, by Region, 2022-2033 (USD Million)
- Table 45 Global Edible Insects Market, by Region, 2022-2033 (Tons)
- Table 46 Asia-Pacific: Edible Insects Market, by Country/Region, 2022-2033 (USD Million)
- Table 47 Asia-Pacific: Edible Insects Market, by Country/Region, 2022-2033 (Tons)
- Table 48 Asia-Pacific: Edible Insects Market, by Product, 2022-2033 (USD Million)
- Table 49 Asia-Pacific: Edible Insects Market, by Product, 2022-2033 (Tons)
- Table 50 Asia-Pacific: Edible Insects Market, by Insect Type, 2022-2033 (USD Million)
- Table 51 Asia-Pacific: Edible Insects Market, by Application, 2022-2033 (USD Million)
- Table 52 Asia-Pacific: Edible Insects Market for Food & Beverage, by Product Type, 2022-2033 (USD Million)
- Table 53 Asia-Pacific: Edible Insects Market for Feed & Pet Food, by Product Type, 2022-2033 (USD Million)
- Table 54 Asia-Pacific: Edible Insects Market, by End Use, 2022-2033 (USD Million)
- Table 55 Thailand: Edible Insects Market, by Product, 2022-2033 (USD Million)
- Table 56 Thailand: Edible Insects Market, by Product, 2022-2033 (Tons)
- Table 57 Thailand: Edible Insects Market, by Insect Type, 2022-2033 (USD Million)
- Table 58 Thailand: Edible Insects Market, by Application, 2022-2033 (USD Million)
- Table 59 Thailand: Edible Insects Market for Food & Beverage, by Product Type, 2022-2033 (USD Million)
- Table 60 Thailand: Edible Insects Market for Feed & Pet Food, by Product Type, 2022-2033 (USD Million)
- Table 61 Thailand: Edible Insects Market, by End Use, 2022-2033 (USD Million)
- Table 62 China: Edible Insects Market, by Product, 2022-2033 (USD Million)
- Table 63 China: Edible Insects Market, by Product, 2022-2033 (Tons)
- Table 64 China: Edible Insects Market, by Insect Type, 2022-2033 (USD Million)
- Table 65 China: Edible Insects Market, by Application, 2022-2033 (USD Million)
- Table 66 China: Edible Insects Market for Food & Beverage, by Product Type, 2022-2033 (USD Million)
- Table 67 China: Edible Insects Market for Feed & Pet Food, by Product Type, 2022-2033 (USD Million)
- Table 68 China: Edible Insects Market, by End Use, 2022-2033 (USD Million)
- Table 69 South Korea: Edible Insects Market, by Product, 2022-2033 (USD Million)
- Table 70 South Korea: Edible Insects Market, by Product, 2022-2033 (Tons)
- Table 71 South Korea: Edible Insects Market, by Insect Type, 2022-2033 (USD Million)
- Table 72 South Korea: Edible Insects Market, by Application, 2022-2033 (USD Million)
- Table 73 South Korea: Edible Insects Market for Food & Beverage, by Product Type, 2022-2033 (USD Million)
- Table 74 South Korea: Edible Insects Market for Feed & Pet Food, by Product Type, 2022-2033 (USD Million)
- Table 75 South Korea: Edible Insects Market, by End Use, 2022-2033 (USD Million)
- Table 76 Vietnam: Edible Insects Market, by Product, 2022-2033 (USD Million)
- Table 77 Vietnam: Edible Insects Market, by Product, 2022-2033 (Tons)
- Table 78 Vietnam: Edible Insects Market, by Insect Type, 2022-2033 (USD Million)
- Table 79 Vietnam: Edible Insects Market, by Application, 2022-2033 (USD Million)
- Table 80 Vietnam: Edible Insects Market for Food & Beverage, by Product Type, 2022-2033 (USD Million)
- Table 81 Vietnam: Edible Insects Market for Feed & Pet Food, by Product Type, 2022-2033 (USD Million)
- Table 82 Vietnam: Edible Insects Market, by End Use, 2022-2033 (USD Million)
- Table 83 Japan: Edible Insects Market, by Product, 2022-2033 (USD Million)
- Table 84 Japan: Edible Insects Market, by Product, 2022-2033 (Tons)
- Table 85 Japan: Edible Insects Market, by Insect Type, 2022-2033 (USD Million)
- Table 86 Japan: Edible Insects Market, by Application, 2022-2033 (USD Million)
- Table 87 Japan: Edible Insects Market for Food & Beverage, by Product Type, 2022-2033 (USD Million)
- Table 88 Japan: Edible Insects Market for Feed & Pet Food, by Product Type, 2022-2033 (USD Million)
- Table 89 Japan: Edible Insects Market, by End Use, 2022-2033 (USD Million)
- Table 90 Australia: Edible Insects Market, by Product, 2022-2033 (USD Million)
- Table 91 Australia: Edible Insects Market, by Product, 2022-2033 (Tons)
- Table 92 Australia: Edible Insects Market, by Insect Type, 2022-2033 (USD Million)
- Table 93 Australia: Edible Insects Market, by Application, 2022-2033 (USD Million)
- Table 94 Australia: Edible Insects Market for Food & Beverage, by Product Type, 2022-2033 (USD Million)
- Table 95 Australia: Edible Insects Market for Feed & Pet Food, by Product Type, 2022-2033 (USD Million)
- Table 96 Australia: Edible Insects Market, by End Use, 2022-2033 (USD Million)
- Table 97 Rest of Asia-Pacific: Edible Insects Market, by Product, 2022-2033 (USD Million)
- Table 98 Rest of Asia-Pacific: Edible Insects Market, by Product, 2022-2033 (Tons)
- Table 99 Rest of Asia-Pacific: Edible Insects Market, by Insect Type, 2022-2033 (USD Million)
- Table 100 Rest of Asia-Pacific: Edible Insects Market, by Application, 2022-2033 (USD Million)
- Table 101 Rest of Asia-Pacific: Edible Insects Market for Food & Beverage, by Product Type, 2022-2033 (USD Million)
- Table 102 Rest of Asia-Pacific: Edible Insects Market for Feed & Pet Food, by Product Type, 2022-2033 (USD Million)
- Table 103 Rest of Asia-Pacific: Edible Insects Market, by End Use, 2022-2033 (USD Million)
- Table 104 Europe: Edible Insects Market, by Country/Region, 2022-2033 (USD Million)
- Table 105 Europe: Edible Insects Market, by Country/Region, 2022-2033 (Tons)
- Table 106 Europe: Edible Insects Market, by Product, 2022-2033 (USD Million)
- Table 107 Europe: Edible Insects Market, by Product, 2022-2033 (Tons)
- Table 108 Europe: Edible Insects Market, by Insect Type, 2022-2033 (USD Million)
- Table 109 Europe: Edible Insects Market, by Application, 2022-2033 (USD Million)
- Table 110 Europe: Edible Insects Market for Food & Beverage, by Product Type, 2022-2033 (USD Million)
- Table 111 Europe: Edible Insects Market for Feed & Pet Food, by Product Type, 2022-2033 (USD Million)
- Table 112 Europe: Edible Insects Market, by End Use, 2022-2033 (USD Million)
- Table 113 Netherlands: Edible Insects Market, by Product, 2022-2033 (USD Million)
- Table 114 Netherlands: Edible Insects Market, by Product, 2022-2033 (Tons)
- Table 115 Netherlands: Edible Insects Market, by Insect Type, 2022-2033 (USD Million)
- Table 116 Netherlands: Edible Insects Market, by Application, 2022-2033 (USD Million)
- Table 117 Netherlands: Edible Insects Market for Food & Beverage, by Product Type, 2022-2033 (USD Million)
- Table 118 Netherlands: Edible Insects Market for Feed & Pet Food, by Product Type, 2022-2033 (USD Million)
- Table 119 Netherlands: Edible Insects Market, by End Use, 2022-2033 (USD Million)
- Table 120 Belgium: Edible Insects Market, by Product, 2022-2033 (USD Million)
- Table 121 Belgium: Edible Insects Market, by Product, 2022-2033 (Tons)
- Table 122 Belgium: Edible Insects Market, by Insect Type, 2022-2033 (USD Million)
- Table 123 Belgium: Edible Insects Market, by Application, 2022-2033 (USD Million)
- Table 124 Belgium: Edible Insects Market for Food & Beverage, by Product Type, 2022-2033 (USD Million)
- Table 125 Belgium: Edible Insects Market for Feed & Pet Food, by Product Type, 2022-2033 (USD Million)
- Table 126 Belgium: Edible Insects Market, by End Use, 2022-2033 (USD Million)
- Table 127 France: Edible Insects Market, by Product, 2022-2033 (USD Million)
- Table 128 France: Edible Insects Market, by Product, 2022-2033 (Tons)
- Table 129 France: Edible Insects Market, by Insect Type, 2022-2033 (USD Million)
- Table 130 France: Edible Insects Market, by Application, 2022-2033 (USD Million)
- Table 131 France: Edible Insects Market for Food & Beverage, by Product Type, 2022-2033 (USD Million)
- Table 132 France: Edible Insects Market for Feed & Pet Food, by Product Type, 2022-2033 (USD Million)
- Table 133 France: Edible Insects Market, by End Use, 2022-2033 (USD Million)
- Table 134 Denmark: Edible Insects Market, by Product, 2022-2033 (USD Million)
- Table 135 Denmark: Edible Insects Market, by Product, 2022-2033 (Tons)
- Table 136 Denmark: Edible Insects Market, by Insect Type, 2022-2033 (USD Million)
- Table 137 Denmark: Edible Insects Market, by Application, 2022-2033 (USD Million)
- Table 138 Denmark: Edible Insects Market for Food & Beverage, by Product Type, 2022-2033 (USD Million)
- Table 139 Denmark: Edible Insects Market for Feed & Pet Food, by Product Type, 2022-2033 (USD Million)
- Table 140 Denmark: Edible Insects Market, by End Use, 2022-2033 (USD Million)
- Table 141 Finland: Edible Insects Market, by Product, 2022-2033 (USD Million)
- Table 142 Finland: Edible Insects Market, by Product, 2022-2033 (Tons)
- Table 143 Finland: Edible Insects Market, by Insect Type, 2022-2033 (USD Million)
- Table 144 Finland: Edible Insects Market, by Application, 2022-2033 (USD Million)
- Table 145 Finland: Edible Insects Market for Food & Beverage, by Product Type, 2022-2033 (USD Million)
- Table 146 Finland: Edible Insects Market for Feed & Pet Food, by Product Type, 2022-2033 (USD Million)
- Table 147 Finland: Edible Insects Market, by End Use, 2022-2033 (USD Million)
- Table 148 Germany: Edible Insects Market, by Product, 2022-2033 (USD Million)
- Table 149 Germany: Edible Insects Market, by Product, 2022-2033 (Tons)
- Table 150 Germany: Edible Insects Market, by Insect Type, 2022-2033 (USD Million)
- Table 151 Germany: Edible Insects Market, by Application, 2022-2033 (USD Million)
- Table 152 Germany: Edible Insects Market for Food & Beverage, by Product Type, 2022-2033 (USD Million)
- Table 153 Germany: Edible Insects Market for Feed & Pet Food, by Product Type, 2022-2033 (USD Million)
- Table 154 Germany: Edible Insects Market, by End Use, 2022-2033 (USD Million)
- Table 155 Rest of Europe: Edible Insects Market, by Product, 2022-2033 (USD Million)
- Table 156 Rest of Europe: Edible Insects Market, by Product, 2022-2033 (Tons)
- Table 157 Rest of Europe: Edible Insects Market, by Insect Type, 2022-2033 (USD Million)
- Table 158 Rest of Europe: Edible Insects Market, by Application, 2022-2033 (USD Million)
- Table 159 Rest of Europe: Edible Insects Market for Food & Beverage, by Product Type, 2022-2033 (USD Million)
- Table 160 Rest of Europe: Edible Insects Market for Feed & Pet Food, by Product Type, 2022-2033 (USD Million)
- Table 161 Rest of Europe: Edible Insects Market, by End Use, 2022-2033 (USD Million)
- Table 162 North America: Edible Insects Market, by Country, 2022-2033 (USD Million)
- Table 163 North America: Edible Insects Market, by Country, 2022-2033 (Tons)
- Table 164 North America: Edible Insects Market, by Product, 2022-2033 (USD Million)
- Table 165 North America: Edible Insects Market, by Product, 2022-2033 (Tons)
- Table 166 North America: Edible Insects Market, by Insect Type, 2022-2033 (USD Million)
- Table 167 North America: Edible Insects Market, by Application, 2022-2033 (USD Million)
- Table 168 North America: Edible Insects Market for Food & Beverage, by Product Type, 2022-2033 (USD Million)
- Table 169 North America: Edible Insects Market for Feed & Pet Food, by Product Type, 2022-2033 (USD Million)
- Table 170 North America: Edible Insects Market, by End Use, 2022-2033 (USD Million)
- Table 171 U.S.: Edible Insects Market, by Product, 2022-2033 (USD Million)
- Table 172 U.S.: Edible Insects Market, by Product, 2022-2033 (Tons)
- Table 173 U.S.: Edible Insects Market, by Insect Type, 2022-2033 (USD Million)
- Table 174 U.S.: Edible Insects Market, by Application, 2022-2033 (USD Million)
- Table 175 U.S.: Edible Insects Market for Food & Beverage, by Product Type, 2022-2033 (USD Million)
- Table 176 U.S.: Edible Insects Market for Feed & Pet Food, by Product Type, 2022-2033 (USD Million)
- Table 177 U.S.: Edible Insects Market, by End Use, 2022-2033 (USD Million)
- Table 178 Canada: Edible Insects Market, by Product, 2022-2033 (USD Million)
- Table 179 Canada: Edible Insects Market, by Product, 2022-2033 (Tons)
- Table 180 Canada: Edible Insects Market, by Insect Type, 2022-2033 (USD Million)
- Table 181 Canada: Edible Insects Market, by Application, 2022-2033 (USD Million)
- Table 182 Canada: Edible Insects Market for Food & Beverage, by Product Type, 2022-2033 (USD Million)
- Table 183 Canada: Edible Insects Market for Feed & Pet Food, by Product Type, 2022-2033 (USD Million)
- Table 184 Canada: Edible Insects Market, by End Use, 2022-2033 (USD Million)
- Table 185 Latin America: Edible Insects Market, by Product, 2022-2033 (USD Million)
- Table 186 Latin America: Edible Insects Market, by Product, 2022-2033 (Tons)
- Table 187 Latin America: Edible Insects Market, by Insect Type, 2022-2033 (USD Million)
- Table 188 Latin America: Edible Insects Market, by Application, 2022-2033 (USD Million)
- Table 189 Latin America: Edible Insects Market for Food & Beverage, by Product Type, 2022-2033 (USD Million)
- Table 190 Latin America: Edible Insects Market for Feed & Pet Food, by Product Type, 2022-2033 (USD Million)
- Table 191 Latin America: Edible Insects Market, by End Use, 2022-2033 (USD Million)
- Table 192 Middle East & Africa: Edible Insects Market, by Product, 2022-2033 (USD Million)
- Table 193 Middle East & Africa: Edible Insects Market, by Product, 2022-2033 (Tons)
- Table 194 Middle East & Africa: Edible Insects Market, by Insect Type, 2022-2033 (USD Million)
- Table 195 Middle East & Africa: Edible Insects Market, by Application, 2022-2033 (USD Million)
- Table 196 Middle East & Africa: Edible Insects Market for Food & Beverage, by Product Type, 2022-2033 (USD Million)
- Table 197 Middle East & Africa: Edible Insects Market for Feed & Pet Food, by Product Type, 2022-2033 (USD Million)
- Table 198 Middle East & Africa: Edible Insects Market, by End Use, 2022-2033 (USD Million)
- Table 199 Total Number of Recent Developments, by Company (2021-2024)
- Table 200 Global Edible Insects Market Position Analysis of Companies, by Major Parameters
- Table 201 Edible Insects Production Capacity, by Key Players
- Table 202 Ynsect: Growth Timeline
LIST OF FIGURES
- Figure 1 Market Ecosystem
- Figure 2 Research Process
- Figure 3 Key Secondary Sources Referenced for This Study
- Figure 4 Primary Research Techniques
- Figure 5 Key Executives Interviewed
- Figure 6 Breakdown of Primary Interviews (Supply-Side & Demand-Side)
- Figure 7 Market Sizing and Growth Forecast
- Figure 8 In 2024, the Whole Insects Segment Is Expected to Dominate the Market
- Figure 9 In 2024, the Crickets Segment Generate the Largest Portion of Revenue in the Edible Insects Market
- Figure 10 Feed And Pet Food Segment to Witness Significant Growth in the Market During 2024-2033
- Figure 11 In 2024, the Human Consumption Segment Is Expected to Dominate the Market
- Figure 12 In 2024, Asia-Pacific is Expected to Dominate the Market
- Figure 13 Impact Analysis of Market Dynamics
- Figure 14 World Population Growth, 2010 Vs. 2050
- Figure 15 Average Greenhouse Gas Emissions From the Production of 1kg of Protein, by Animal Type
- Figure 16 Resources Required: Livestock Farming Vs. Insect Farming
- Figure 17 North America: Regulatory Approval for Insect Use in Animal Feed, 2024
- Figure 18 European Union: Novel Food Authorization Workflow
- Figure 19 Europe: Regulatory Approval for Insect Use in Animal Feed, 2024
- Figure 20 Asia-Pacific: Regulatory Approval for Insect Use in Animal Feed, 2024
- Figure 21 Porter's Five Forces Analysis: Global Edible Insects Market
- Figure 22 Global Edible Insects Market, by Product, 2024 Vs. 2033 (USD Million)
- Figure 23 Global Edible Insects Market, by Product, 2024 Vs. 2033 (Tons)
- Figure 24 Global Edible Insects Market, by Insect Type, 2024 Vs. 2033 (USD Million)
- Figure 25 Global Edible Insects Market, by Application, 2024 Vs. 2033 (USD Million)
- Figure 26 Global Edible Insects Market, by End Use, 2024 Vs. 2033 (USD Million)
- Figure 27 Global Edible Insects Market, by Region, 2024 Vs. 2033 (USD Million)
- Figure 28 Asia-Pacific: Edible Insects Market Snapshot (2024)
- Figure 29 Europe: Edible Insects Market Snapshot (2024)
- Figure 30 North America: Edible Insects Market Snapshot (2024)
- Figure 31 Latin America: Edible Insects Market Snapshot (2024)
- Figure 32 Middle East & Africa: Edible Insects Market Snapshot (2024)
- Figure 33 Key Growth Strategies Adopted by Leading Players (2021-2024)
- Figure 34 Edible Insects Market: Competitive Benchmarking, by Product
- Figure 35 Competitive Dashboard: Edible Insects Market
- Figure 36 Global Edible Insects Market Position Analysis, by Key Companies
- Figure 37 Ynsesct (SAS): Locations
Edible Insects Market Size, Share, Forecast, & Trends Analysis by Product (Whole Insect, Insect Powder, Insect Meal, Insect Oil), Insect Type (Crickets, Black Soldier Fly, Mealworms), Application (Animal Feed, Protein Bar & Shakes, Bakery, Confectionery, Beverages), and Geography-Global Forecast to 2033
According to the research report titled 'Edible Insects Market Size, Share, Forecast, & Trends Analysis by Product (Whole Insect, Insect Powder, Insect Meal, Insect Oil), Insect Type (Crickets, Black Soldier Fly, Mealworms), Application (Animal Feed, Protein Bar & Shakes, Bakery, Confectionery, Beverages), and Geography-Global Forecast to 2033,' the edible insects market is projected to reach $17.9 billion by 2033, at a CAGR of 28.6% during the forecast period of 2024 to 2033, while in terms of volume, the market is expected to reach 4.7 million tons by 2033, at a CAGR of 36.3% from 2024 to 2033. The report provides an in-depth analysis of the edible insects market across five major regions, emphasizing the current market trends, market sizes, recent developments, and forecasts till 2033.
Succeeding extensive secondary and primary research and an in-depth analysis of the market scenario, the report conducts the impact analysis of the key industry drivers, restraints, opportunities, challenges, and trends. The growth of the edible insects market is mainly driven by growing greenhouse gas emissions from the livestock & poultry industries, the high nutritional value of edible insects, the environmental benefits of edible insects, the rising demand for insect protein in the animal feed industry, and the low risk of transmitting zoonotic diseases with the consumption of edible insects. In addition, business expansion in emerging & developed economies is expected to generate growth opportunities for the players operating in this market.
However, the lack of a standardized regulatory framework, psychological & ethical barriers to consuming insects as food, and the risk of allergies due to insect consumption restrain the growth of this market. Furthermore, the lack of awareness regarding the benefits of insect consumption and limitations in scaling up production are major challenges impacting market growth.
The key players operating in the edible insects market are Protix B.V. (Netherlands), Ynsect (SAS) (France), InnovaFeed SAS (France), EnviroFlight, LLC (U.S.), Nutrition Technologies Group (Singapore), Bioflytech S.L. (Spain), Entomo Farms (Canada), Aspire Food Group (U.S.), Global Bugs Asia Co., Ltd. (Thailand), Entobel Holding Pte. Ltd. (Singapore), Entofood Sdn Bhd (Malaysia), SFly Comgraf SAS (France), Hexafly (Ireland), F4F SpA (Chile), Protenga Pte Ltd. (Singapore), nextProtein (France), Enorm Biofactory A/S (Denmark), Hargol FoodTech (Israel), All Things Bugs, Llc (U.S.), Beta Hatch (U.S.), Armstrong Crickets Georgia (U.S.), JR Unique Foods Ltd. (Thailand), Tebrio (Spain), and HiProMine S.A. (Poland).
The edible insects market is segmented by product (whole insects, insect powder, insect meal, insect oil); insect type (crickets, black soldier flies, mealworms, buffalo worms, grasshoppers, ants, silkworms, cicadas, and other edible insects); application (food & beverage and feed & pet food); end use (human consumption and animal nutrition); and geography. The study also evaluates industry competitors and analyzes the country-level markets.
Based on product, the edible insects market is segmented into whole insects, insect powder, insect meal, and insect oil. In terms of value, in 2024, the whole insects segment is expected to account for the largest share of 46.3% of the edible insects market. The large market share of this segment is attributed to the high adoption of whole insects due to their easy availability and lower cost compared to processed insects, the absence of insect processing facilities in some parts of the world, and the high demand for whole insects in the animal feed industry. Moreover, in terms of volume, in 2024, the insect meal segment is expected to account for the largest share of 54.7% of the edible insects market.
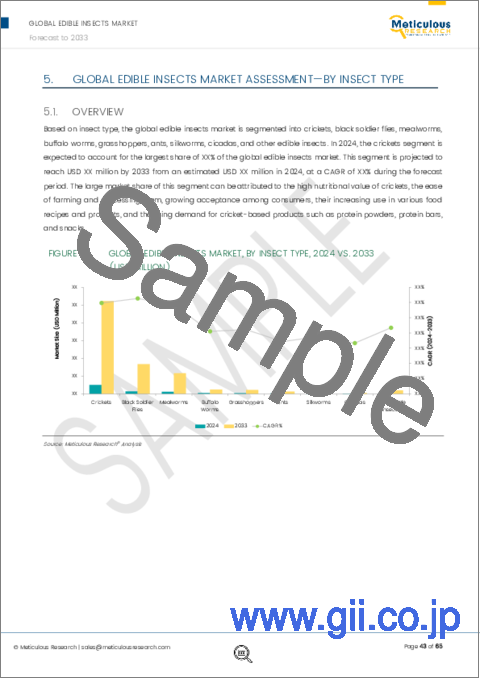
Based on insect type, the edible insects market is segmented into crickets, black soldier flies, mealworms, buffalo worms, grasshoppers, ants, silkworms, cicadas, and other edible insects. In 2024, the crickets segment is expected to account for the largest share of 53.3% of the edible insects market. This segment's large share is attributed to the high nutritional value of crickets, the ease of farming and processing them, growing acceptance among consumers, their increasing use in various food recipes and products, and the rising demand for cricket-based products such as protein powders, protein bars, and snacks.
Based on the application, the edible insects market is mainly segmented into food & beverage and feed & pet food. In 2024, the food & beverages segment is expected to account for the larger share of the edible insects market. This segment is projected to reach USD 8,633.6 million by 2033. However, the feed and pet food segment is expected to register the fastest CAGR of 30.7% during the forecast period. The high growth of this segment is attributed to the growing demand for meat products and the subsequent increase in the demand for protein-rich animal feed, rising soy meal prices, growing adoption of black soldier flies and mealworms in aquaculture feed, and government approval for the use of insects as a feed ingredient.
Based on end use, the edible insects market is segmented into human consumption and animal nutrition. In 2024, the human consumption segment is expected to account for a larger share of 55.4% of the edible insects market. This segment's large market share is attributed to the rising demand for insect-based foods to feed the ever-growing global population, the high nutritional value of insects in human nutrition, and the increasing demand for environmentally friendly alternative sources of protein.
An in-depth geographic analysis of the industry provides detailed qualitative and quantitative insights into the five major regions (North America, Europe, Asia-Pacific, Latin America, and the Middle East & Africa) and the coverage of major countries in each region. In 2024, Asia-Pacific is expected to account for the largest share of 34.8% of the edible insects market. This market is projected to reach USD 5,727.5 million by 2033 during the forecast period. Asia-Pacific's significant market share is attributed to the well-established commercial farming market for edible insects, especially in Thailand, the wide availability of various insects coupled with huge production, the positive attitude towards insects as food & feed, the absence of regulatory barriers to using insects as food & feed, and the presence of key market players in the region.
Key Questions Answered in the Report-
- What is the current revenue generated by edible insects globally?
- At what rate is the edible insects demand projected to grow for the next 7-7 years?
- What are the historical market sizes and growth rates of the edible insects market?
- What are the major factors impacting the growth of this market at the regional and country levels? What are the major opportunities for existing players and new entrants in the market?
- Which segments in terms of product, insect type, application, and end-use are expected to create major traction for the manufacturers in this market?
- What are the key geographical trends in this market? Which regions/countries are expected to offer significant growth opportunities for the manufacturers operating in the edible insects market?
- Who are the major players in the edible insects market? What are their specific product offerings in this market?
- What are the recent strategic developments in the edible insects market? What are the impacts of these strategic developments on the market?
Scope of the Report:
Edible Insects Market Assessment-by Product
- Whole Insects
- Insect Powder
- Insect Meal
- Insect Oil
Edible Insects Market Assessment-by Insect Type
- Crickets
- Black Soldier Flies
- Mealworms
- Buffalo Worms
- Grasshoppers
- Ants
- Silkworms
- Cicadas
- Other Edible Insects
Edible Insects Market Assessment-by Application
- Food & Beverage
- Feed & Pet Food
Edible Insects Market Assessment-by End Use
- Human Consumption
- Animal Nutrition
Edible Insects Market Assessment -by Geography
- North America
- U.S.
- Canada
- Europe
- Netherlands
- Belgium
- France
- Denmark
- Finland
- Germany
- Rest of Europe
- U.K.
- Spain
- Poland
- Ireland
- Sweden
- Italy
- Other European Countries
- Asia-Pacific
- Thailand
- China
- South Korea
- Vietnam
- Japan
- Australia
- Rest of Asia-Pacific
- Malaysia
- India
- Singapore
- Other Countries in RoAPAC
- Latin America
- Middle East & Africa
TABLE OF CONTENTS
1. Introduction
- 1.1. Market Definition & Scope
- 1.2. Market Ecosystem
- 1.3. Currency
- 1.4. Key Stakeholders
2. Research Methodology
- 2.1. Research Approach
- 2.2. Data Collection & Validation
- 2.2.1. Secondary Research
- 2.2.2. Primary Research/Interviews With Key Opinion Leaders from the Industry
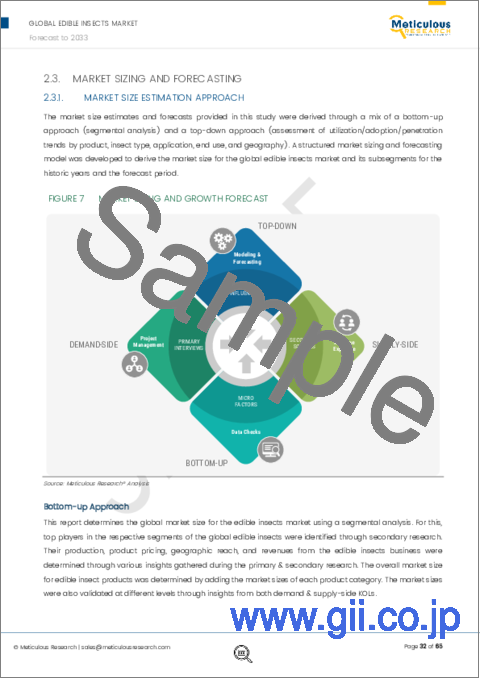
- 2.3. Market Sizing and forecasting
- 2.3.1. Market Size Estimation Approach
- 2.3.2. Growth Forecast Approach
- 2.4. Assumptions for the Study
3. Executive Summary
- 3.1. Overview
- 3.2. Segment Analysis
- 3.2.1. Edible Insects Market, by Product
- 3.2.2. Edible Insects Market, by Insect Type
- 3.2.3. Edible Insects Market, by Application
- 3.2.4. Edible Insects Market, by End Use
- 3.3. Edible Insects Market, by Region
- 3.4. Competitive Landscape & Market Competitors
4. Market Insights
- 4.1. Overview
- 4.2. Factors Affecting Market Growth
- 4.2.1. Growing Greenhouse Gas Emissions from the Livestock & Poultry Industries Driving the Need for Alternative Protein Sources
- 4.2.2. High Nutritional Value Driving the Consumption of Edible Insects
- 4.2.3. Environmental Benefits of Edible Insects Supporting Adoption
- 4.2.4. Rising Demand for Insect Protein in the Animal Feed Industry Driving Market Growth
- 4.2.5. Low Risk of Transmitting Zoonotic Diseases Supporting the Consumption of Edible Insects
- 4.2.6. Lack of A Standardized Regulatory Framework Restraining Market Growth
- 4.2.7. Psychological & Ethical Barriers to Consuming Insects As Food Restricting the Adoption of Edible Insects
- 4.2.8. Risk of Allergies Due to Insect Consumption Hampering Market Growth
- 4.2.9. Business Expansion in Emerging & Developed Economies Expected to Offer Growth Opportunities for Market Players
- 4.2.10. Lack of Awareness Regarding the Benefits of Insect Consumption Impacting Market Growth
- 4.2.11. Limitations in Scaling Up Production Expected to Remain A Major Challenge for Market Players
- 4.3. Pricing Analysis
- 4.3.1. Overview
- 4.3.2. Whole Insects
- 4.3.3. Insect Powder
- 4.3.4. Insect Meal
- 4.3.5. Insect Oil
- 4.4. Regulatory Analysis
- 4.4.1. North America
- 4.4.1.1. U.S.
- 4.4.1.2. Canada
- 4.4.2. Europe
- 4.4.3. Asia-Pacific
- 4.4.4. Rest of the World
- 4.4.1. North America
- 4.5. Porter's Five Forces Analysis
- 4.5.1. Bargaining Power of Suppliers
- 4.5.2. Bargaining Power of Buyers
- 4.5.3. Threat of Substitutes
- 4.5.4. Threat of New Entrants
- 4.5.5. Degree of Competition
5. Global Edible Insects Market Assessment-by Product
- 5.1. Overview
- 5.2. Whole Insects
- 5.3. Insect Powder
- 5.4. Insect Meal
- 5.5. Larvae/Insect Oil
6 Global Edible Insects Market Assessment-by Insect Type
- 6.1. Overview
- 6.2. Crickets
- 6.3. Black Soldier Flies
- 6.4. Mealworms
- 6.5. Buffalo Worms
- 6.6. Grasshoppers
- 6.7. Ants
- 6.8. Silkworms
- 6.9. Cicadas
- 6.10. Ohter Edible Insects
7. Global Edible Insects Market Assessment-by Application
- 7.1. Overview
- 7.2. Food & Beverages
- 7.2.1. Processed Whole Insects
- 7.2.2. Processed Insect Powder
- 7.2.3. Protein Bars & Protein Shakes
- 7.2.4. Baked Products & Snacks
- 7.2.5. Insect Confectioneries
- 7.2.6. Insect Beverages
- 7.2.7. Other Food & Beverage Applications
- 7.3. Feed & Pet Food
- 7.3.1. Aquaculture Feed
- 7.3.2. Animal Feed
- 7.3.3. Pet Food
8. Global Edible Insects Market Assessment-by End Use
- 8.1. Overview
- 8.2. Human Consumption
- 8.3. Animal Nutrition
9. Edible Insects Market Assessment-by Geography
- 9.1. Asia-Pacific
- 9.1.1. Thailand
- 9.1.2. China
- 9.1.3. South Korea
- 9.1.4. Vietnam
- 9.1.5. Japan
- 9.1.6. Australia
- 9.1.7. Rest of Asia-Pacific
- 9.1.7.1. Malaysia
- 9.1.7.2. India
- 9.1.7.3. Singapore
- 9.1.7.4. Other Countries in APAC
- 9.2. Europe
- 9.2.1. Netherlands
- 9.2.2. Belgium
- 9.2.3. France
- 9.2.4. Denmark
- 9.2.5. Finland
- 9.2.6. Germany
- 9.2.7. Rest of Europe (RoE)
- 9.2.7.1. U.K.
- 9.2.7.2. Spain
- 9.2.7.3. Poland
- 9.2.7.4. Ireland
- 9.2.7.5. Sweden
- 9.2.7.6. Italy
- 9.2.7.7. Other European Countries
- 9.3. North America
- 9.3.1. U.S.
- 9.3.2. Canada
- 9.4. Latin America
- 9.4.1. Mexico
- 9.4.2. Brazil
- 9.5. Middle East & Africa
10. Competition Analysis
- 10.1. Overview
- 10.2. Key Growth Strategies
- 10.3. Competitive Benchmarking
- 10.4. Competitive Dashboard
- 10.4.1. Industry Leaders
- 10.4.2. Market Differentiators
- 10.4.3. Vanguards
- 10.4.4. Emerging Companies
- 10.5. Global Edible Insects Market: Company Market Position Analysis
- 10.6. Production Capacity of Key Players
11. Company Profiles (Company Overview, Financial Overview, Product Portfolio, and Strategic Developments)
- 11.1. Protix B.V.
- 11.2. Ynsect (SAS)
- 11.3. InnovaFeed SAS
- 11.4. EnviroFlight, Llc
- 11.5. Nutrition Technologies Group
- 11.6. Bioflytech S.L.
- 11.7. Entomo Farms
- 11.8. Aspire Food Group
- 11.9. Global Bugs Asia Co., Ltd.
- 11.10. Entobel Holding Pte. Ltd.
- 11.11. Entofood Sdn Bhd
- 11.12. SFly Comgraf SAS
- 11.13. Hexafly
- 11.14. F4F SpA
- 11.15. Protenga Pte Ltd.
- 11.16. NextProtein
- 11.17. Enorm Biofactory A/S
- 11.18. Hargol FoodTech
- 11.19. All Things Bugs, Llc
- 11.20. Beta Hatch
- 11.21. Armstrong Crickets Georgia
- 11.22. Jr Unique Foods Ltd.
- 11.23. TEBRIO
- 11.24. Hipromine S.A.
(Note: SWOT analysis of the top 5 companies will be provided.)
12. Emerging Startups
- 12.1. Protanica Co. Ltd.
- 12.2. Pro-Meal (Promeal Animal Feeds)
- 12.3. CricketOne Asia
- 12.4. Eat Crawlers
- 12.5. BugEra
- 12.6. Entoprotech Ltd
- 12.7. Insectta
- 12.8. Entosystem Inc.
- 12.9. INSECTIFii India Pvt. Ltd.
- 12.10. Agroloop Hungary Kft.
- 12.11. Soldier Fly Technologies, Inc.
- 12.12. Life Origin
- 12.13. Insectum ApS
- 12.14. Keetup and Co.
- 12.15. Loopworm Pvt. Ltd.
- 12.16. Ento Proteins Private Limited
- 12.17. UltraNutri
- 12.18. Insectika Biotech Private Limited (IBPL)
- 12.19. Freshrooms Lifesciences Private Limited
- 12.20. Kovai BSF
- 12.21. Exocycle
- 12.22. Bioforte Biotechnology (Shenzhen) Co., Ltd.
- 12.23. Guangzhou Unique Biotechnology Co., Ltd
- 12.24. Symton Inc.
- 12.25. Beta Bugs Ltd.
- 12.26. Snas Bio-Tech
- 12.27. Farminsect Gmbh
- 12.28. Hermetia Baruth GmbH
- 12.29. Volare Solutions
- 12.30. Nasekomo
- 12.31. Mutatec
- 12.32. Nextalim SAS
- 12.33. Insectum UAB
- 12.34. Entogreen - Ingredient Odyssey, S.A.
- 12.35. Cyns
- 12.36. Illucens Mexico Entobiorrefineria
- 12.37. Proticycle
- 12.38. Circa Biotech
- 12.39. CricketOne
- 12.40. Flylab Tech Co., Ltd
- 12.41. Invertapro As
- 12.42. Prime Insects
- 12.43. Bulgarian Insect Company
13. Appendix
- 13.1. Available Customization
- 13.2. Related Reports

