|
|
市場調査レポート
商品コード
1424831
植物性タンパク質市場:タイプ、形態、由来プロセス、用途別 - 2031年までの世界予測Plant-based Protein Market by Type, Form, Source Process, and Application - Global Forecast to 2031 |
||||||
|
|||||||
カスタマイズ可能
|
|||||||

| 植物性タンパク質市場:タイプ、形態、由来プロセス、用途別 - 2031年までの世界予測 |
|
出版日: 2024年02月12日
発行: Meticulous Research
ページ情報: 英文 588 Pages
納期: 即納可能
|

全表示
- 概要
- 図表
- 目次
植物性タンパク質市場:タイプ(大豆タンパク質、小麦タンパク質、エンドウ豆タンパク質、ジャガイモタンパク質)、形態(固体、液体)、由来プロセス(従来型、有機)、用途(飲食品、動物飼料、栄養補助食品)別-2031年までの世界予測
当調査レポートでは、植物性タンパク質市場は予測期間2024-2031年にCAGR 8.4%で、2031年までに264億5,000万米ドルに達すると予測しています。この調査レポートは、主要5地域にわたる世界の植物性タンパク質市場を詳細に分析し、現在の市場動向、市場規模、最近の市場開発、2031年までの予測などをまとめています。
広範な2次調査と1次調査、市場シナリオの詳細な分析に続き、主要産業の促進要因、市場抑制要因、機会、課題、動向の影響分析を実施しています。この市場の成長は、タンパク質が豊富な食事へのニーズの高まり、健康とウェルネスの動向の高まり、代替肉への消費者の注目の高まり、飲食品業界からの需要の高まり、マイクロカプセル化などの成分技術の進歩によってもたらされます。しかし、消費者の動物性食品への嗜好や原料価格の変動は、同市場の成長を阻害すると予想されます。
さらに、消費者の植物性食生活への傾斜の増加、新興経済国、動物性タンパク質に対する不耐性の有病率の上昇は、植物性タンパク質市場で事業を展開するプレーヤーに成長機会をもたらすと予想されます。
目次
第1章 イントロダクション
第2章 調査手法
第3章 エグゼクティブサマリー
- 概要
- セグメント分析
- 植物性タンパク質市場:タイプ別
- 植物性タンパク質市場:形態別
- 植物性タンパク質市場:由来プロセス別
- 植物性タンパク質市場:用途別
- 植物性タンパク質市場:地域別分析
- 競合情勢と市場競争
第4章 市場洞察
- 概要
- 市場成長への影響要因
- 植物性タンパク質の消費を促進するタンパク質豊富な食事へのニーズの高まり
- 植物性タンパク質の需要を牽引する健康とウェルネスの動向の高まり
- 肉代替食品に対する消費者の関心の高まりが市場成長を支える
- 飲食品業界からの需要の高まりによる植物性タンパク質の生産量の増加
- マイクロカプセル化など成分技術の進歩が市場拡大を加速
- 動物性製品に対する消費者の嗜好が植物性タンパク質の需要を制限
- 原材料価格の変動が市場成長を抑制
- 消費者の植物性志向の高まりが植物性タンパク質の消費を促進する見込み
- 新興国が市場プレーヤーに成長機会を提供する見込み
- 動物性タンパク質に対する不耐性の増加が植物性タンパク質市場にプラスの影響を与える見込み
- 大豆不使用・グルテンフリー食品の利点に関する意識の高まりが市場成長に影響
- 主要動向
- 植物性タンパク質の生産を後押しする投資の増加
- 投資と資金調達のシナリオ
- 価格分析
- 概要
- 大豆タンパク質
- 大豆たん白濃縮物
- 大豆蛋白アイソレート
- テクスチャード大豆タンパク質
- その他の大豆タンパク質
- 小麦タンパク質
- バイタル小麦グルテン
- 小麦タンパク質アイソレート
- 加水分解小麦タンパク質
- テクスチャード小麦タンパク質
- エンドウ豆タンパク質
- 黄エンドウ豆タンパク質
- グリーンピースタンパク質
- カノーラタンパク質
- カノーラタンパク質アイソレート
- カノーラタンパク質濃縮物
- その他のカノーラタンパク質
- ポテトタンパク質
- ポテトタンパク質濃縮物
- ポテトタンパク質アイソレート
- コメタンパク質
- コメタンパク質アイソレート
- コメタンパク質濃縮物
- コメタンパク質加水分解物
- トウモロコシタンパク質
- トウモロコシタンパク質アイソレート
- トウモロコシタンパク質濃縮物
- トウモロコシタンパク質加水分解物
- その他の植物性タンパク質
- 生産分析
- 概要
- 大豆タンパク質
- 濃縮大豆たん白
- 分離大豆たん白
- テクスチャード大豆タンパク質
- その他の大豆タンパク質
- 小麦タンパク質
- バイタル小麦グルテン
- 小麦タンパク質アイソレート
- 加水分解小麦タンパク質
- テクスチャード小麦タンパク質
- エンドウ豆タンパク質
- 黄エンドウ豆タンパク質
- グリーンピースタンパク質
- カノーラタンパク質
- カノーラタンパク質アイソレート
- カノーラタンパク質濃縮物
- その他のカノーラタンパク質
- ポテトタンパク質
- ポテトタンパク質濃縮物
- ポテトタンパク質アイソレート
- コメタンパク質
- コメタンパク質アイソレート
- コメタンパク質濃縮物
- コメタンパク質加水分解物
- トウモロコシタンパク質
- トウモロコシタンパク質アイソレート
- トウモロコシタンパク質濃縮物
- トウモロコシタンパク質加水分解物
- その他の植物性タンパク質
- バリューチェーン分析
第5章 植物性タンパク質の世界市場評価:タイプ別
- 概要
- 大豆タンパク質
- 濃縮大豆たん白
- 分離大豆たん白
- テクスチャード大豆タンパク質
- その他の大豆タンパク質
- 小麦タンパク質
- バイタル小麦グルテン
- 小麦タンパク質アイソレート
- 加水分解小麦タンパク質
- テクスチャード小麦タンパク質
- エンドウ豆タンパク質
- 黄エンドウ豆タンパク質
- グリーンピースタンパク質
- カノーラタンパク質
- カノーラタンパク質アイソレート
- カノーラタンパク質濃縮物
- その他のカノーラタンパク質
- ポテトタンパク質
- ポテトタンパク質濃縮物
- ポテトタンパク質アイソレート
- コメタンパク質
- コメタンパク質アイソレート
- コメタンパク質濃縮物
- コメタンパク質加水分解物
- トウモロコシタンパク質
- トウモロコシタンパク質アイソレート
- トウモロコシタンパク質濃縮物
- トウモロコシタンパク質加水分解物
- その他の植物性タンパク質
第6章 植物性タンパク質の世界市場評価:形態別
- 概要
- 固体(乾燥)
- 液体
第7章 植物性タンパク質の世界市場評価:由来プロセス別
- 概要
- 従来植物性タンパク質原料
- 有機植物性タンパク質原料
第8章 植物性タンパク質の世界市場:用途別評価
- 概要
- 飲食品
- 肉、鶏肉、魚介類
- ベーカリー
- 肉類似品
- 代替乳製品
- シリアル&スナック
- 飲料
- その他飲食品
- 飼料
- 栄養・健康補助食品
- 医薬品
- その他の用途
第9章 地域別植物性タンパク質市場評価
- 概要
- 北米
- コメ国
- カナダ
- 欧州
- ドイツ
- フランス
- 英国
- イタリア
- スペイン
- その他欧州(RoE)
- アジア太平洋
- 中国
- インド
- 日本
- オーストラリア
- その他アジア太平洋地域(RoAPAC)
- ラテンアメリカ
- ブラジル
- メキシコ
- アルゼンチン
- その他ラテンアメリカ(RoLATAM)
- 中東・アフリカ
第10章 競合情勢
- 概要
- 主要成長戦略
- 競合ベンチマーキング
- 競合ダッシュボード
- 業界リーダー
- 市場差別化要因
- 先駆企業
- 新興企業
- 世界の植物性タンパク質市場:企業のポジション分析
第11章 企業プロファイル
- Archer Daniels Midland Company
- Cargill, Incorporated
- Roquette Freres
- Ingredion Incorporated
- Kerry Group plc
- International Flavors & Fragrances, Inc.(IFF)
- Now Health Group, Inc.
- Tate & Lyle PLC
- Axiom Foods Inc.
- Amco Proteins
- Burcon Nutrascience Corporation
- Beneo Gmbh(A Part of Sudzucker AG)
- Glico Nutrition Co., Ltd.
- Glanbia Plc
- Cosucragroupe Warcoing SA
- Sotexpro Sa(Part of GEMEF Industries)
- Farbest-Tallman Foods Corporation
- Crespel & Deiters GmbH & Co. KG
- Wilmar International Limited
- CHS Inc.
第12章 付録
- Table 1 Average Selling Prices of Commodities Used in the Production of Plant-Based Proteins, 2015-2022 (USD/Tonne)
- Table 2 Investments, Funding, And Acquisitions in the Plant-Based Proteins & Food Industry
- Table 3 Average Prices of Soy Protein Concentrate, by Country/Region, 2022-2031 (USD/Ton)
- Table 4 Average Prices of Soy Protein Isolate, by Country/Region, 2022-2031 (USD/Ton)
- Table 5 Average Prices of Textured Soy Protein, by Country/Region, 2022-2031 (USD/Ton)
- Table 6 Average Prices of Other Soy Proteins, by Country/Region, 2022-2031 (USD/Ton)
- Table 7 Average Prices of Vital Wheat Gluten, by Country/Region, 2022-2031 (USD/Ton)
- Table 8 Average Prices of Wheat Protein Isolate, by Country/Region, 2022-2031 (USD/Ton)
- Table 9 Average Prices of Hydrolyzed Wheat Protein, by Country/Region, 2022-2031 (USD/Ton)
- Table 10 Average Prices of Textured Wheat Protein, by Country/Region, 2022-2031 (USD/Ton)
- Table 11 Average Prices of Yellow Pea Protein Isolate, by Country/Region, 2022-2031 (USD/Ton)
- Table 12 Average Prices of Yellow Pea Protein Concentrate, by Country/Region, 2022-2031 (USD/Ton)
- Table 13 Average Prices of Textured Yellow Pea Protein, by Country/Region, 2022-2031 (USD/Ton)
- Table 14 Average Prices of Yellow Pea Protein Hydrolysate, by Country/Region, 2022-2031 (USD/Ton)
- Table 15 Average Prices of Yellow Pea Flour, by Country/Region, 2022-2031 (USD/Ton)
- Table 16 Average Prices of Other Yellow Pea Proteins, by Country/Region, 2022-2031 (USD/Ton)
- Table 17 Average Prices of Green Pea Protein Isolate, by Country/Region, 2022-2031 (USD/Ton)
- Table 18 Average Prices of Green Pea Protein Concentrate, by Country/Region, 2022-2031 (USD/Ton)
- Table 19 Average Prices of Textured Green Pea Protein, by Country/Region, 2022-2031 (USD/Ton)
- Table 20 Average Prices of Green Pea Protein Hydrolysate, by Country/Region, 2022-2031 (USD/Ton)
- Table 21 Average Prices of Green Pea Flour, by Country/Region, 2022-2031 (USD/Ton)
- Table 22 Average Prices of Other Green Pea Proteins, by Country/Region, 2022-2031 (USD/Ton)
- Table 23 Average Prices of Canola Protein Isolate, by Country/Region, 2022-2031 (USD/Ton)
- Table 24 Average Prices of Canola Protein Concentrate, by Country/Region, 2022-2031 (USD/Ton)
- Table 25 Average Prices of Other Canola Proteins, by Country/Region, 2022-2031 (USD/Ton)
- Table 26 Average Prices of Potato Protein Concentrate, by Country/Region, 2022-2031 (USD/Ton)
- Table 27 Average Prices of Potato Protein Isolate, by Country/Region, 2022-2031 (USD/Ton)
- Table 28 Average Prices of Rice Protein Isolate, by Country/Region, 2022-2031 (USD/Ton)
- Table 29 Average Prices of Rice Protein Concentrate, by Country/Region, 2022-2031 (USD/Ton)
- Table 30 Average Prices of Rice Protein Hydrolysate, by Country/Region, 2022-2031 (USD/Ton)
- Table 31 Average Prices of Corn Protein Isolate, by Country/Region, 2022-2031 (USD/Ton)
- Table 32 Average Prices of Corn Protein Concentrate, by Country/Region, 2022-2031 (USD/Ton)
- Table 33 Average Prices of Corn Protein Hydrolysate, by Country/Region, 2022-2031 (USD/Ton)
- Table 34 Average Prices of Other Plant Proteins, by Country/Region, 2022-2031 (USD/Ton)
- Table 35 Soy Protein Concentrate Production, by Country/Region, 2023 (In Tons)
- Table 36 Soy Protein Isolate Production, by Country/Region, 2023 (In Tons)
- Table 37 Textured Soy Protein Production, by Country/Region, 2023 (In Tons)
- Table 38 Other Soy Proteins Production, by Country/Region, 2023 (In Tons)
- Table 39 Vital Wheat Gluten Production, by Country/Region, 2023 (In Tons)
- Table 40 Wheat Protein Isolate Production, by Country/Region, 2023 (In Tons)
- Table 41 Hydrolyzed Wheat Protein Production, by Country/Region, 2023 (In Tons)
- Table 42 Textured Wheat Protein Production, by Country/Region, 2023 (In Tons)
- Table 43 Yellow Pea Protein Isolate Production, by Country/Region, 2023 (In Tons)
- Table 44 Yellow Pea Protein Concentrate Production, by Country/Region, 2023 (In Tons)
- Table 45 Textured Yellow Pea Protein Production, by Country/Region, 2023 (In Tons)
- Table 46 Yellow Pea Protein Hydrolysate Production, by Country/Region, 2023 (In Tons)
- Table 47 Yellow Pea Flour Production, by Country/Region, 2023 (In Tons)
- Table 48 Other Yellow Pea Proteins Production, by Country/Region, 2023 (In Tons)
- Table 49 Green Pea Protein Isolate Production, by Country/Region, 2023 (In Tons)
- Table 50 Green Pea Protein Concentrate Production, by Country/Region, 2023 (In Tons)
- Table 51 Textured Green Pea Protein Production, by Country/Region, 2023 (In Tons)
- Table 52 Green Pea Protein Hydrolysate Production, by Country/Region, 2023 (In Tons)
- Table 53 Green Pea Flour Production, by Country/Region, 2023 (In Tons)
- Table 54 Other Green Pea Proteins Production, by Country/Region, 2023 (In Tons)
- Table 55 Canola Protein Isolate Production, by Country/Region, 2023 (In Tons)
- Table 56 Canola Protein Concentrate Production, by Country/Region, 2023 (In Tons)
- Table 57 Other Canola Proteins Production, by Country/Region, 2023 (In Tons)
- Table 58 Potato Protein Concentrate Production, by Country/Region, 2023 (In Tons)
- Table 59 Potato Protein Isolate Production, by Country/Region, 2023 (In Tons)
- Table 60 Rice Protein Isolate Production, by Country/Region, 2023 (In Tons)
- Table 61 Rice Protein Concentrate Production, by Country/Region, 2023 (In Tons)
- Table 62 Rice Protein Hydrolysate Production, by Country/Region, 2023 (In Tons)
- Table 63 Corn Protein Isolate Production, by Country/Region, 2023 (In Tons)
- Table 64 Corn Protein Concentrate Production, by Country/Region, 2023 (In Tons)
- Table 65 Corn Protein Hydrolysate Production, by Country/Region, 2023 (In Tons)
- Table 66 Other Plant Proteins Production, by Country/Region, 2023 (In Tons)
- Table 67 Global Plant-Based Proteins Market, by Type, 2022-2031 (USD Million)
- Table 68 Global Plant Based Protein Supplements Market, by Type, 2022-2031 (Tons)
- Table 69 Global Soy Proteins Market, by Type, 2022-2031 (USD Million)
- Table 70 Global Soy Proteins Market, by Type, 2022-2031 (Tons)
- Table 71 Global Soy Proteins Market, by Country/Region, 2022-2031 (USD Million)
- Table 72 Global Soy Proteins Market, by Country/Region, 2022-2031 (Tons)
- Table 73 Global Soy Protein Concentrates Market, by Country/Region, 2022-2031(USD Million)
- Table 74 Global Soy Protein Concentrates Market, by Country/Region, 2022-2031 (Tons)
- Table 75 Global Soy Protein Isolates Market, by Country/Region, 2022-2031 (USD Million)
- Table 76 Global Soy Protein Isolates Market, by Country/Region, 2022-2031 (Tons)
- Table 77 Global Textured Soy Proteins Market, by Country/Region, 2022-2031 (USD Million)
- Table 78 Global Textured Soy Proteins Market, by Country/Region, 2022-2031 (Tons)
- Table 79 Global Other Soy Proteins Market, by Country/Region, 2022-2031 (USD Million)
- Table 80 Global Other Soy Proteins Market, by Country/Region, 2022-2031 (Tons)
- Table 81 Global Wheat Proteins Market, by Type, 2022-2031 (USD Million)
- Table 82 Global Wheat Proteins Market, by Type, 2022-2031 (Tons)
- Table 83 Global Wheat Proteins Market, by Country/Region, 2022-2031 (USD Million)
- Table 84 Global Wheat Proteins Market, by Country/Region, 2022-2031 (Tons)
- Table 85 Global Vital Wheat Gluten Market, by Country/Region, 2022-2031 (USD Million)
- Table 86 Global Vital Wheat Gluten Market, by Country/Region, 2022-2031 (Tons)
- Table 87 Global Wheat Protein Isolate Market, by Country/Region, 2022-2031 (USD Million)
- Table 88 Global Wheat Protein Isolate Market, by Country/Region, 2022-2031 (Tons)
- Table 89 Global Hydrolyzed Wheat Protein Market, by Country/Region, 2022-2031 (USD Million)
- Table 90 Global Hydrolyzed Wheat Protein Market, by Country/Region, 2022-2031 (Tons)
- Table 91 Global Textured Wheat Protein Market, by Country/Region, 2022-2031 (USD Million)
- Table 92 Global Textured Wheat Protein Market, by Country/Region, 2022-2031 (Tons)
- Table 93 Global Pea Proteins Market, by Type, 2022-2031 (USD Million)
- Table 94 Global Pea Proteins Market, by Type, 2022-2031 (Tons)
- Table 95 Global Pea Proteins Market, by Country/Region, 2022-2031 (USD Million)
- Table 96 Global Pea Proteins Market, by Country/Region, 2022-2031 (Tons)
- Table 97 Global Yellow Pea Proteins Market, by Type, 2022-2031 (USD Million)
- Table 98 Global Yellow Pea Proteins Market, by Type, 2022-2031 (Tons)
- Table 99 Global Yellow Pea Proteins Market, by Country/Region, 2022-2031 (USD Million)
- Table 100 Global Yellow Pea Proteins Market, by Country/Region, 2022-2031 (Tons)
- Table 101 Global Yellow Pea Protein Isolate Market, by Country/Region, 2022-2031 (USD Million)
- Table 102 Global Yellow Pea Protein Isolate Market, by Country/Region, 2022-2031 (Tons)
- Table 103 Global Yellow Pea Protein Concentrate Market, by Country/Region, 2022-2031 (USD Million)
- Table 104 Global Yellow Pea Protein Concentrate Market, by Country/Region, 2022-2031 (Tons)
- Table 105 Global Textured Yellow Pea Protein Market, by Country/Region, 2022-2031 (USD Million)
- Table 106 Global Textured Yellow Pea Protein Market, by Country/Region, 2022-2031 (Tons)
- Table 107 Global Yellow Pea Protein Hydrolysate Market, by Country/Region, 2022-2031 (USD Million)
- Table 108 Global Yellow Pea Protein Hydrolysate Market, by Country/Region, 2022-2031 (Tons)
- Table 109 Global Yellow Pea Flour Market, by Country/Region, 2022-2031 (USD Million)
- Table 110 Global Yellow Pea Flour Market, by Country/Region, 2022-2031 (Tons)
- Table 111 Global Other Yellow Pea Proteins Market, by Country/Region, 2022-2031 (USD Million)
- Table 112 Global Other Yellow Pea Proteins Market, by Country/Region, 2022-2031 (Tons)
- Table 113 Global Green Pea Proteins Market, by Type, 2022-2031 (USD Million)
- Table 114 Global Green Pea Proteins Market, by Type, 2022-2031 (Tons)
- Table 115 Global Green Pea Proteins Market, by Country/Region, 2022-2031 (USD Million)
- Table 116 Global Green Pea Proteins Market, by Country/Region, 2022-2031 (Tons)
- Table 117 Global Green Pea Protein Isolate Market, by Country/Region, 2022-2031 (USD Million)
- Table 118 Global Green Pea Protein Isolate Market, by Country/Region, 2022-2031 (Tons)
- Table 119 Global Green Pea Protein Concentrate Market, by Country/Region, 2022-2031 (USD Million)
- Table 120 Global Green Pea Protein Concentrate Market, by Country/Region, 2022-2031 (Tons)
- Table 121 Global Textured Green Pea Protein Market, by Country/Region, 2022-2031 (USD Million) 1
- Table 122 Global Textured Green Pea Protein Market, by Country/Region, 2022-2031 (Tons)
- Table 123 Global Green Pea Protein Hydrolysate Market, by Country/Region, 2022-2031 (USD Million)
- Table 124 Global Green Pea Protein Hydrolysate Market, by Country/Region, 2022-2031 (Tons)
- Table 125 Global Green Pea Flour Market, by Country/Region, 2022-2031 (USD Million)
- Table 126 Global Green Pea Flour Market, by Country/Region, 2022-2031 (Tons)
- Table 127 Global Other Green Pea Proteins Market, by Country/Region, 2022-2031 (USD Million)
- Table 128 Global Other Green Pea Proteins Market, by Country/Region, 2022-2031 (Tons)
- Table 129 Global Canola Proteins Market, by Type, 2022-2031 (USD Million)
- Table 130 Global Canola Proteins Market, by Type, 2022-2031 (Tons)
- Table 131 Global Canola Proteins Market, by Country/Region, 2022-2031 (USD Million)
- Table 132 Global Canola Proteins Market, by Country/Region, 2022-2031 (Tons)
- Table 133 Global Canola Protein Isolate Market, by Country/Region, 2022-2031 (USD Million)
- Table 134 Global Canola Protein Isolate Market, by Country/Region, 2022-2031 (Tons)
- Table 135 Global Canola Protein Concentrate Market, by Country/Region, 2022-2031 (USD Million)
- Table 136 Global Canola Protein Concentrate Market, by Country/Region, 2022-2031 (Tons)
- Table 137 Global Other Canola Proteins Market, by Country/Region, 2022-2031 (USD Million)
- Table 138 Global Other Canola Proteins Market, by Country/Region, 2022-2031 (Tons)
- Table 139 Global Potato Proteins Market, by Type, 2022-2031 (USD Million)
- Table 140 Global Potato Proteins Market, by Type, 2022-2031 (Tons)
- Table 141 Global Potato Proteins Market, by Country/Region, 2022-2031 (USD Million)
- Table 142 Global Potato Proteins Market, by Country/Region, 2022-2031 (Tons)
- Table 143 Global Potato Protein Concentrate Market, by Country/Region, 2022-2031 (USD Million)
- Table 144 Global Potato Protein Concentrate Market, by Country/Region, 2022-2031 (Tons)
- Table 145 Global Potato Protein Isolate Market, by Country/Region, 2022-2031 (USD Million)
- Table 146 Global Potato Protein Isolate Market, by Country/Region, 2022-2031 (Tons)
- Table 147 Global Rice Proteins Market, by Type, 2022-2031 (USD Million)
- Table 148 Global Rice Proteins Market, by Type, 2022-2031 (Tons)
- Table 149 Global Rice Proteins Market, by Country/Region, 2022-2031 (USD Million)
- Table 150 Global Rice Proteins Market, by Country/Region, 2022-2031 (Tons)
- Table 151 Global Rice Protein Isolate Market, by Country/Region, 2022-2031 (USD Million)
- Table 152 Global Rice Protein Isolate Market, by Country/Region, 2022-2031 (Tons)
- Table 153 Global Rice Protein Concentrate Market, by Country/Region, 2022-2031 (USD Million)
- Table 154 Global Rice Protein Concentrate Market, by Country/Region, 2022-2031 (Tons)
- Table 155 Global Rice Protein Hydrolysate Market, by Country/Region, 2022-2031 (USD Million)
- Table 157 Global Corn Proteins Market, by Type, 2022-2031 (USD Million)
- Table 158 Global Corn Proteins Market, by Type, 2022-2031 (Tons)
- Table 159 Global Corn Proteins Market, by Country/Region, 2022-2031 (USD Million)
- Table 160 Global Corn Proteins Market, by Country/Region, 2022-2031 (Tons)
- Table 161 Global Corn Protein Isolate Market, by Country/Region, 2022-2031 (USD Million)
- Table 162 Global Corn Protein Isolate Market, by Country/Region, 2022-2031 (Tons)
- Table 163 Global Corn Protein Concentrate Market, by Country/Region, 2022-2031 (USD Million)
- Table 164 Global Corn Protein Concentrate Market, by Country/Region, 2022-2031 (Tons)
- Table 165 Global Corn Protein Hydrolysate Market, by Country/Region, 2022-2031 (USD Million)
- Table 166 Global Corn Protein Hydrolysate Market, by Country/Region, 2022-2031 (Tons)
- Table 167 Global Other Plant-Based Proteins Market, by Country/Region, 2022-2031 (USD Million)
- Table 168 Global Other Plant-Based Proteins Market, by Country/Region, 2022-2031 (Tons)
- Table 169 Global Plant-Based Proteins Market, by Form, 2022-2031 (USD Million)
- Table 170 Global Solid (Dry) Plant-Based Proteins Market, by Country/Region, 2022-2031 (USD Million)
- Table 171 Global Liquid Plant-Based Proteins Market, by Country/Region, 2022-2031 (USD Million)
- Table 172 Global Plant-Based Proteins Market, by Source Process, 2022-2031 (USD Million)
- Table 173 Global Conventional Plant-Based Protein Ingredients Market, By Country/Region, 2022-2031 (USD Million)
- Table 174 Global Organic Plant-Based Protein Ingredients Market, by Country/Region, 2022-2031 (USD Million)
- Table 175 Global Plant-Based Proteins Market, by Application, 2022-2031 (USD Million)
- Table 176 Global Plant-Based Proteins Market for Food & Beverage, by Type, 2022-2031 (USD Million)
- Table 177 Global Plant-Based Proteins Market for Food & Beverage, by Country/Region, 2022-2031 (USD Million)
- Table 178 Global Plant-Based Proteins Market for Meat, Poultry, And Seafood, By Country/Region, 2022-2031 (USD Million)
- Table 179 Global Plant-Based Proteins Market for Bakery, by Country/Region, 2022-2031 (USD Million)
- Table 180 Companies Active in the Production of Plant-Based Meat (2023)
- Table 181 Global Plant-Based Proteins Market for Meat Analogs, by Country/Region, 2022-2031 (USD Million)
- Table 182 Global Plant-Based Proteins Market for Dairy Alternatives, by Country/Region, 2022-2031 (USD Million)
- Table 183 Global Plant-Based Proteins Market for Cereals & Snacks, by Country/Region, 2022-2031 (USD Million)
- Table 184 Global Plant-Based Proteins Market for Beverages, by Country/Region, 2022-2031 (USD Million)
- Table 185 Global Plant-Based Proteins Market for Other Food & Beverages, By Country/Region, 2022-2031 (USD Million)
- Table 186 Global Plant-Based Proteins Market for Animal Feed, by Country/Region, 2022-2031 (USD Million)
- Table 187 Global Plant-Based Proteins Market for Nutrition & Health Supplements, by Country/Region, 2022-2031 (USD Million)
- Table 188 Global Plant-Based Proteins Market for Pharmaceuticals, by Country/Region, 2022-2031 (USD Million)
- Table 189 Global Plant-Based Proteins Market for Other Applications, By Country/Region, 2022-2031 (USD Million)
- Table 190 Global Plant-Based Proteins Market, by Country/Region, 2022-2031 (USD Million)
- Table 191 Global Plant-Based Proteins Market, by Country/Region, 2022-2031 (Tons)
- Table 192 North America: Plant-Based Proteins Market, by Country, 2022-2031 (USD Million)
- Table 193 North America: Plant-Based Proteins Market, by Country, 2022-2031 (Tons)
- Table 194 North America: Plant-Based Proteins Market, by Type, 2022-2031 (USD Million)
- Table 195 North America: Plant-Based Proteins Market, by Type, 2022-2031 (Tons)
- Table 196 North America: Soy Proteins Market, by Type, 2022-2031 (USD Million)
- Table 197 North America: Soy Proteins Market, by Type, 2022-2031 (Tons)
- Table 198 North America: Wheat Proteins Market, by Type, 2022-2031 (USD Million)
- Table 199 North America: Wheat Proteins Market, by Type, 2022-2031 (Tons)
- Table 200 North America: Pea Proteins Market, by Type, 2022-2031 (USD Million)
- Table 201 North America: Pea Proteins Market, by Type, 2022-2031 (Tons)
- Table 202 North America: Yellow Pea Proteins Market, by Type, 2022-2031 (USD Million)
- Table 203 North America: Yellow Pea Proteins Market, by Type, 2022-2031 (Tons)
- Table 204 North America: Green Pea Proteins Market, by Type, 2022-2031 (USD Million)
- Table 205 North America: Green Pea Proteins Market, by Type, 2022-2031 (Tons)
- Table 206 North America: Canola Proteins Market, by Type, 2022-2031 (USD Million)
- Table 207 North America: Canola Proteins Market, by Type, 2022-2031 (Tons)
- Table 208 North America: Potato Proteins Market, by Type, 2022-2031 (USD Million)
- Table 209 North America: Potato Proteins Market, by Type, 2022-2031 (Tons)
- Table 210 North America: Rice Proteins Market, by Type, 2022-2031 (USD Million)
- Table 211 North America: Rice Proteins Market, by Type, 2022-2031 (Tons)
- Table 212 North America: Corn Proteins Market, by Type, 2022-2031 (USD Million)
- Table 213 North America: Corn Proteins Market, by Type, 2022-2031 (Tons)
- Table 214 North America: Plant-Based Proteins Market, by Form, 2022-2031 (USD Million)
- Table 215 North America: Plant-Based Proteins Market, by Source Process, 2022-2031 (USD Million)
- Table 216 North America: Plant-Based Proteins Market, by Application, 2022-2031 (USD Million)
- Table 217 North America: Plant-Based Proteins Market for Food & Beverage, by Type, 2022-2031 (USD Million)
- Table 218 U.S.: Plant-Based Proteins Market, by Type, 2022-2031 (USD Million)
- Table 219 U.S.: Plant-Based Proteins Market, by Type, 2022-2031 (Tons)
- Table 220 U.S.: Soy Proteins Market, by Type, 2022-2031 (USD Million)
- Table 221 U.S.: Soy Proteins Market, by Type, 2022-2031 (Tons)
- Table 222 U.S.: Wheat Proteins Market, by Type, 2022-2031 (USD Million)
- Table 223 U.S.: Wheat Proteins Market, by Type, 2022-2031 (Tons)
- Table 224 U.S.: Pea Proteins Market, by Type, 2022-2031 (USD Million)
- Table 225 U.S.: Pea Proteins Market, by Type, 2022-2031 (Tons)
- Table 226 U.S.: Yellow Pea Proteins Market, by Type, 2022-2031 (USD Million)
- Table 227 U.S.: Yellow Pea Proteins Market, by Type, 2022-2031 (Tons)
- Table 228 U.S.: Green Pea Proteins Market, by Type, 2022-2031 (USD Million)
- Table 229 U.S.: Green Pea Proteins Market, by Type, 2022-2031 (Tons)
- Table 230 U.S.: Canola Proteins Market, by Type, 2022-2031 (USD Million)
- Table 231 U.S.: Canola Proteins Market, by Type, 2022-2031 (Tons)
- Table 232 U.S.: Potato Proteins Market, by Type, 2022-2031 (USD Million)
- Table 233 U.S.: Potato Proteins Market, by Type, 2022-2031 (Tons)
- Table 234 U.S.: Rice Proteins Market, by Type, 2022-2031 (USD Million)
- Table 235 U.S.: Rice Proteins Market, by Type, 2022-2031 (Tons)
- Table 236 U.S.: Corn Proteins Market, by Type, 2022-2031 (USD Million)
- Table 237 U.S.: Corn Proteins Market, by Type, 2022-2031 (Tons)
- Table 238 U.S.: Plant-Based Proteins Market, by Form, 2022-2031 (USD Million)
- Table 239 U.S.: Plant-Based Proteins Market, by Source Process, 2022-2031 (USD Million)
- Table 240 U.S.: Plant-Based Proteins Market, by Application, 2022-2031 (USD Million)
- Table 241 U.S.: Plant-Based Proteins Market for Food & Beverage, by Type, 2022-2031 (USD Million)
- Table 242 Canada: Plant-Based Proteins Market, by Type, 2022-2031 (USD Million)
- Table 243 Canada: Plant-Based Proteins Market, by Type, 2022-2031 (Tons)
- Table 244 Canada: Soy Proteins Market, by Type, 2022-2031 (USD Million)
- Table 245 Canada: Soy Proteins Market, by Type, 2022-2031 (Tons)
- Table 246 Canada: Wheat Proteins Market, by Type, 2022-2031 (USD Million)
- Table 247 Canada: Wheat Proteins Market, by Type, 2022-2031 (Tons)
- Table 248 Canada: Pea Proteins Market, by Type, 2022-2031 (USD Million)
- Table 249 Canada: Pea Proteins Market, by Type, 2022-2031 (Tons)
- Table 250 Canada: Yellow Pea Proteins Market, by Type, 2022-2031 (USD Million)
- Table 251 Canada: Yellow Pea Proteins Market, by Type, 2022-2031 (Tons)
- Table 252 Canada: Green Pea Proteins Market, by Type, 2022-2031 (USD Million)
- Table 253 Canada: Green Pea Proteins Market, by Type, 2022-2031 (Tons)
- Table 254 Canada: Canola Proteins Market, by Type, 2022-2031 (USD Million)
- Table 255 Canada: Canola Proteins Market, by Type, 2022-2031 (Tons)
- Table 256 Canada: Potato Proteins Market, by Type, 2022-2031 (USD Million)
- Table 257 Canada: Potato Proteins Market, by Type, 2022-2031 (Tons)
- Table 258 Canada: Rice Proteins Market, by Type, 2022-2031 (USD Million)
- Table 259 Canada: Rice Proteins Market, by Type, 2022-2031 (Tons)
- Table 260 Canada: Corn Proteins Market, by Type, 2022-2031 (USD Million)
- Table 261 Canada: Corn Proteins Market, by Type, 2022-2031 (Tons)
- Table 262 Canada: Plant-Based Proteins Market, by Form, 2022-2031 (USD Million)
- Table 263 Canada: Plant-Based Proteins Market, by Source Process, 2022-2031 (USD Million)
- Table 264 Canada: Plant-Based Proteins Market, by Application, 2022-2031 (USD Million)
- Table 265 Canada: Plant-Based Proteins Market for Food & Beverage, by Type, 2022-2031 (USD Million)
- Table 266 Europe: Plant-Based Proteins Market, by Country/Region, 2022-2031 (USD Million)
- Table 267 Europe: Plant-Based Proteins Market, by Country/Region, 2022-2031 (Tons)
- Table 268 Europe: Plant-Based Proteins Market, by Type, 2022-2031 (USD Million)
- Table 269 Europe: Plant-Based Proteins Market, by Type, 2022-2031 (Tons)
- Table 270 Europe: Soy Proteins Market, by Type, 2022-2031 (USD Million)
- Table 271 Europe: Soy Proteins Market, by Type, 2022-2031 (Tons)
- Table 272 Europe: Wheat Proteins Market, by Type, 2022-2031 (USD Million)
- Table 273 Europe: Wheat Proteins Market, by Type, 2022-2031 (Tons)
- Table 274 Europe: Pea Proteins Market, by Type, 2022-2031 (USD Million)
- Table 275 Europe: Pea Proteins Market, by Type, 2022-2031 (Tons)
- Table 276 Europe: Yellow Pea Proteins Market, by Type, 2022-2031 (USD Million)
- Table 277 Europe: Yellow Pea Proteins Market, by Type, 2022-2031 (Tons)
- Table 278 Europe: Green Pea Proteins Market, by Type, 2022-2031 (USD Million)
- Table 279 Europe: Green Pea Proteins Market, by Type, 2022-2031 (Tons)
- Table 280 Europe: Canola Proteins Market, by Type, 2022-2031 (USD Million)
- Table 281 Europe: Canola Proteins Market, by Type, 2022-2031 (Tons)
- Table 282 Europe: Potato Proteins Market, by Type, 2022-2031 (USD Million)
- Table 283 Europe: Potato Proteins Market, by Type, 2022-2031 (Tons)
- Table 284 Europe: Rice Proteins Market, by Type, 2022-2031 (USD Million)
- Table 285 Europe: Rice Proteins Market, by Type, 2022-2031 (Tons)
- Table 286 Europe: Corn Proteins Market, by Type, 2022-2031 (USD Million)
- Table 287 Europe: Corn Proteins Market, by Type, 2022-2031 (Tons)
- Table 288 Europe: Plant-Based Proteins Market, by Form, 2022-2031 (USD Million)
- Table 289 Europe: Plant-Based Proteins Market, by Source Process, 2022-2031 (USD Million)
- Table 290 Europe: Plant-Based Proteins Market, by Application, 2022-2031 (USD Million)
- Table 291 Europe: Plant-Based Proteins Market for Food & Beverage, by Type, 2022-2031 (USD Million)
- Table 292 Germany: Plant-Based Proteins Market, by Type, 2022-2031 (USD Million)
- Table 293 Germany: Plant-Based Proteins Market, by Type, 2022-2031 (Tons)
- Table 294 Germany: Soy Proteins Market, by Type, 2022-2031 (USD Million)
- Table 295 Germany: Soy Proteins Market, by Type, 2022-2031 (Tons)
- Table 296 Germany: Wheat Proteins Market, by Type, 2022-2031 (USD Million)
- Table 297 Germany: Wheat Proteins Market, by Type, 2022-2031 (Tons)
- Table 298 Germany: Pea Proteins Market, by Type, 2022-2031 (USD Million)
- Table 299 Germany: Pea Proteins Market, by Type, 2022-2031 (Tons)
- Table 300 Germany: Yellow Pea Proteins Market, by Type, 2022-2031 (USD Million)
- Table 301 Germany: Yellow Pea Proteins Market, by Type, 2022-2031 (Tons)
- Table 302 Germany: Green Pea Proteins Market, by Type, 2022-2031 (USD Million)
- Table 303 Germany: Green Pea Proteins Market, by Type, 2022-2031 (Tons)
- Table 304 Germany: Canola Proteins Market, by Type, 2022-2031 (USD Million)
- Table 305 Germany: Canola Proteins Market, by Type, 2022-2031 (Tons)
- Table 306 Germany: Potato Proteins Market, by Type, 2022-2031 (USD Million)
- Table 307 Germany: Potato Proteins Market, by Type, 2022-2031 (Tons)
- Table 308 Germany: Rice Proteins Market, by Type, 2022-2031 (USD Million)
- Table 309 Germany: Rice Proteins Market, by Type, 2022-2031 (Tons)
- Table 310 Germany: Corn Proteins Market, by Type, 2022-2031 (USD Million)
- Table 311 Germany: Corn Proteins Market, by Type, 2022-2031 (Tons)
- Table 312 Germany: Plant-Based Proteins Market, by Form, 2022-2031 (USD Million)
- Table 313 Germany: Plant-Based Proteins Market, by Source Process, 2022-2031 (USD Million)
- Table 314 Germany: Plant-Based Proteins Market, by Application, 2022-2031 (USD Million)
- Table 315 Germany: Plant-Based Proteins Market for Food & Beverage, by Type, 2022-2031 (USD Million)
- Table 316 France: Plant-Based Proteins Market, by Type, 2022-2031 (USD Million)
- Table 317 France: Plant-Based Proteins Market, by Type, 2022-2031 (Tons)
- Table 318 France: Soy Proteins Market, by Type, 2022-2031 (USD Million)
- Table 319 France: Soy Proteins Market, by Type, 2022-2031 (Tons)
- Table 320 France: Wheat Proteins Market, by Type, 2022-2031 (USD Million)
- Table 321 France: Wheat Proteins Market, by Type, 2022-2031 (Tons)
- Table 322 France: Pea Proteins Market, by Type, 2022-2031 (USD Million)
- Table 323 France: Pea Proteins Market, by Type, 2022-2031 (Tons)
- Table 324 France: Yellow Pea Proteins Market, by Type, 2022-2031 (USD Million)
- Table 325 France: Yellow Pea Proteins Market, by Type, 2022-2031 (Tons)
- Table 326 France: Green Pea Proteins Market, by Type, 2022-2031 (USD Million)
- Table 327 France: Green Pea Proteins Market, by Type, 2022-2031 (Tons)
- Table 328 France: Canola Proteins Market, by Type, 2022-2031 (USD Million)
- Table 329 France: Canola Proteins Market, by Type, 2022-2031 (Tons)
- Table 330 France: Potato Proteins Market, by Type, 2022-2031 (USD Million)
- Table 331 France: Potato Proteins Market, by Type, 2022-2031 (Tons)
- Table 332 France: Rice Proteins Market, by Type, 2022-2031 (USD Million)
- Table 333 France: Rice Proteins Market, by Type, 2022-2031 (Tons)
- Table 334 France: Corn Proteins Market, by Type, 2022-2031 (USD Million)
- Table 335 France: Corn Proteins Market, by Type, 2022-2031 (Tons)
- Table 336 France: Plant-Based Proteins Market, by Form, 2022-2031 (USD Million)
- Table 337 France: Plant-Based Proteins Market, by Source Process, 2022-2031 (USD Million)
- Table 338 France: Plant-Based Proteins Market, by Application, 2022-2031 (USD Million)
- Table 339 France: Plant-Based Proteins Market for Food & Beverage, by Type, 2022-2031 (USD Million)
- Table 340 U.K.: Plant-Based Proteins Market, by Type, 2022-2031 (USD Million)
- Table 341 U.K.: Plant-Based Proteins Market, by Type, 2022-2031 (Tons)
- Table 342 U.K.: Soy Proteins Market, by Type, 2022-2031 (USD Million)
- Table 343 U.K.: Soy Proteins Market, by Type, 2022-2031 (Tons)
- Table 344 U.K.: Wheat Proteins Market, by Type, 2022-2031 (USD Million)
- Table 345 U.K.: Wheat Proteins Market, by Type, 2022-2031 (Tons)
- Table 346 U.K.: Pea Proteins Market, by Type, 2022-2031 (USD Million)
- Table 347 U.K.: Pea Proteins Market, by Type, 2022-2031 (Tons)
- Table 348 U.K.: Yellow Pea Proteins Market, by Type, 2022-2031 (USD Million)
- Table 349 U.K.: Yellow Pea Proteins Market, by Type, 2022-2031 (Tons)
- Table 350 U.K.: Green Pea Proteins Market, by Type, 2022-2031 (USD Million)
- Table 351 U.K.: Green Pea Proteins Market, by Type, 2022-2031 (Tons)
- Table 352 U.K.: Canola Proteins Market, by Type, 2022-2031 (USD Million)
- Table 353 U.K.: Canola Proteins Market, by Type, 2022-2031 (Tons)
- Table 354 U.K.: Potato Proteins Market, by Type, 2022-2031 (USD Million)
- Table 355 U.K.: Potato Proteins Market, by Type, 2022-2031 (Tons)
- Table 356 U.K.: Rice Proteins Market, by Type, 2022-2031 (USD Million)
- Table 357 U.K.: Rice Proteins Market, by Type, 2022-2031 (Tons)
- Table 358 U.K.: Corn Proteins Market, by Type, 2022-2031 (USD Million)
- Table 359 U.K.: Corn Proteins Market, by Type, 2022-2031 (Tons)
- Table 360 U.K.: Plant-Based Proteins Market, by Form, 2022-2031 (USD Million)
- Table 361 U.K.: Plant-Based Proteins Market, by Source Process, 2022-2031 (USD Million)
- Table 362 U.K.: Plant-Based Proteins Market, by Application, 2022-2031 (USD Million)
- Table 363 U.K.: Plant-Based Proteins Market for Food & Beverage, by Type, 2022-2031 (USD Million)
- Table 364 Italy: Plant-Based Proteins Market, by Type, 2022-2031 (USD Million)
- Table 365 Italy: Plant-Based Proteins Market, by Type, 2022-2031 (Tons)
- Table 366 Italy: Soy Proteins Market, by Type, 2022-2031 (USD Million)
- Table 367 Italy: Soy Proteins Market, by Type, 2022-2031 (Tons)
- Table 368 Italy: Wheat Proteins Market, by Type, 2022-2031 (USD Million)
- Table 369 Italy: Wheat Proteins Market, by Type, 2022-2031 (Tons)
- Table 370 Italy: Pea Proteins Market, by Type, 2022-2031 (USD Million)
- Table 371 Italy: Pea Proteins Market, by Type, 2022-2031 (Tons)
- Table 372 Italy: Yellow Pea Proteins Market, by Type, 2022-2031 (USD Million)
- Table 373 Italy: Yellow Pea Proteins Market, by Type, 2022-2031 (Tons)
- Table 374 Italy: Green Pea Proteins Market, by Type, 2022-2031 (USD Million)
- Table 375 Italy: Green Pea Proteins Market, by Type, 2022-2031 (Tons)
- Table 376 Italy: Canola Proteins Market, by Type, 2022-2031 (USD Million)
- Table 377 Italy: Canola Proteins Market, by Type, 2022-2031 (Tons)
- Table 378 Italy: Potato Proteins Market, by Type, 2022-2031 (USD Million)
- Table 379 Italy: Potato Proteins Market, by Type, 2022-2031 (Tons)
- Table 380 Italy: Rice Proteins Market, by Type, 2022-2031 (USD Million)
- Table 381 Italy: Rice Proteins Market, by Type, 2022-2031 (Tons)
- Table 382 Italy: Corn Proteins Market, by Type, 2022-2031 (USD Million)
- Table 383 Italy: Corn Proteins Market, by Type, 2022-2031 (Tons)
- Table 384 Italy: Plant-Based Proteins Market, by Form, 2022-2031 (USD Million)
- Table 385 Italy: Plant-Based Proteins Market, by Source Process, 2022-2031 (USD Million)
- Table 386 Italy: Plant-Based Proteins Market, by Application, 2022-2031 (USD Million)
- Table 387 Italy: Plant-Based Proteins Market for Food & Beverage, by Type, 2022-2031 (USD Million)
- Table 388 Spain: Plant-Based Proteins Market, by Type, 2022-2031 (USD Million)
- Table 389 Spain: Plant-Based Proteins Market, by Type, 2022-2031 (Tons)
- Table 390 Spain: Soy Proteins Market, by Type, 2022-2031 (USD Million)
- Table 391 Spain: Soy Proteins Market, by Type, 2022-2031 (Tons)
- Table 392 Spain: Wheat Proteins Market, by Type, 2022-2031 (USD Million)
- Table 393 Spain: Wheat Proteins Market, by Type, 2022-2031 (Tons)
- Table 394 Spain: Pea Proteins Market, by Type, 2022-2031 (USD Million)
- Table 395 Spain: Pea Proteins Market, by Type, 2022-2031 (Tons)
- Table 396 Spain: Yellow Pea Proteins Market, by Type, 2022-2031 (USD Million)
- Table 397 Spain: Yellow Pea Proteins Market, by Type, 2022-2031 (Tons)
- Table 398 Spain: Green Pea Proteins Market, by Type, 2022-2031 (USD Million)
- Table 399 Spain: Green Pea Proteins Market, by Type, 2022-2031 (Tons)
- Table 400 Spain: Canola Proteins Market, by Type, 2022-2031 (USD Million)
- Table 401 Spain: Canola Proteins Market, by Type, 2022-2031 (Tons)
- Table 402 Spain: Potato Proteins Market, by Type, 2022-2031 (USD Million)
- Table 403 Spain: Potato Proteins Market, by Type, 2022-2031 (Tons)
- Table 404 Spain: Rice Proteins Market, by Type, 2022-2031 (USD Million)
- Table 405 Spain: Rice Proteins Market, by Type, 2022-2031 (Tons)
- Table 406 Spain: Corn Proteins Market, by Type, 2022-2031 (USD Million)
- Table 407 Spain: Corn Proteins Market, by Type, 2022-2031 (Tons)
- Table 408 Spain: Plant-Based Proteins Market, by Form, 2022-2031 (USD Million)
- Table 409 Spain: Plant-Based Proteins Market, by Source Process, 2022-2031 (USD Million)
- Table 410 Spain: Plant-Based Proteins Market, by Application, 2022-2031 (USD Million)
- Table 411 Spain: Plant-Based Proteins Market for Food & Beverage, by Type, 2022-2031 (USD Million)
- Table 412 Rest of Europe: Plant-Based Proteins Market, by Type, 2022-2031 (USD Million)
- Table 413 Rest of Europe: Plant-Based Proteins Market, by Type, 2022-2031 (Tons)
- Table 414 Rest of Europe: Soy Proteins Market, by Type, 2022-2031 (USD Million)
- Table 415 Rest of Europe: Soy Proteins Market, by Type, 2022-2031 (Tons)
- Table 416 Rest of Europe: Wheat Proteins Market, by Type, 2022-2031 (USD Million)
- Table 417 Rest of Europe: Wheat Proteins Market, by Type, 2022-2031 (Tons)
- Table 418 Rest of Europe: Pea Proteins Market, by Type, 2022-2031 (USD Million)
- Table 419 Rest of Europe: Pea Proteins Market, by Type, 2022-2031 (Tons)
- Table 420 Rest of Europe: Yellow Pea Proteins Market, by Type, 2022-2031 (USD Million)
- Table 421 Rest of Europe: Yellow Pea Proteins Market, by Type, 2022-2031 (Tons)
- Table 422 Rest of Europe: Green Pea Proteins Market, by Type, 2022-2031 (USD Million)
- Table 423 Rest of Europe: Green Pea Proteins Market, by Type, 2022-2031 (Tons)
- Table 424 Rest of Europe: Canola Proteins Market, by Type, 2022-2031 (USD Million)
- Table 425 Rest of Europe: Canola Proteins Market, by Type, 2022-2031 (Tons)
- Table 426 Rest of Europe: Potato Proteins Market, by Type, 2022-2031 (USD Million)
- Table 427 Rest of Europe: Potato Proteins Market, by Type, 2022-2031 (Tons)
- Table 428 Rest of Europe: Rice Proteins Market, by Type, 2022-2031 (USD Million)
- Table 429 Rest of Europe: Rice Proteins Market, by Type, 2022-2031 (Tons)
- Table 430 Rest of Europe: Corn Proteins Market, by Type, 2022-2031 (USD Million)
- Table 431 Rest of Europe: Corn Proteins Market, by Type, 2022-2031 (Tons)
- Table 432 Rest of Europe: Plant-Based Proteins Market, by Form, 2022-2031 (USD Million)
- Table 433 Rest of Europe: Plant-Based Proteins Market, by Source Process, 2022-2031 (USD Million)
- Table 434 Rest of Europe: Plant-Based Proteins Market, by Application, 2022-2031 (USD Million)
- Table 435 Rest of Europe: Plant-Based Proteins Market for Food & Beverage, by Type, 2022-2031 (USD Million)
- Table 436 Asia-Pacific: Plant-Based Proteins Market, by Country/Region, 2022-2031 (USD Million)
- Table 437 Asia-Pacific: Plant-Based Proteins Market, by Country/Region, 2022-2031 (Tons)
- Table 438 Asia-Pacific: Plant-Based Proteins Market, by Type, 2022-2031 (USD Million)
- Table 439 Asia-Pacific: Plant-Based Proteins Market, by Type, 2022-2031 (Tons)
- Table 440 Asia-Pacific: Soy Proteins Market, by Type, 2022-2031 (USD Million)
- Table 441 Asia-Pacific: Soy Proteins Market, by Type, 2022-2031 (Tons)
- Table 442 Asia-Pacific: Wheat Proteins Market, by Type, 2022-2031 (USD Million)
- Table 443 Asia-Pacific: Wheat Proteins Market, by Type, 2022-2031 (Tons)
- Table 444 Asia-Pacific: Pea Proteins Market, by Type, 2022-2031 (USD Million)
- Table 445 Asia-Pacific: Pea Proteins Market, by Type, 2022-2031 (Tons)
- Table 446 Asia-Pacific: Yellow Pea Proteins Market, by Type, 2022-2031 (USD Million)
- Table 447 Asia-Pacific: Yellow Pea Proteins Market, by Type, 2022-2031 (Tons)
- Table 448 Asia-Pacific: Green Pea Proteins Market, by Type, 2022-2031 (USD Million)
- Table 449 Asia-Pacific: Green Pea Proteins Market, by Type, 2022-2031 (Tons)
- Table 450 Asia-Pacific: Canola Proteins Market, by Type, 2022-2031 (USD Million)
- Table 451 Sia-Pacific: Canola Proteins Market, by Type, 2022-2031 (Tons)
- Table 452 Asia-Pacific: Potato Proteins Market, by Type, 2022-2031 (USD Million)
- Table 453 Asia-Pacific: Potato Proteins Market, by Type, 2022-2031 (Tons)
- Table 454 Asia-Pacific: Rice Proteins Market, by Type, 2022-2031 (USD Million)
- Table 455 Asia-Pacific: Rice Proteins Market, by Type, 2022-2031 (Tons)
- Table 456 Asia-Pacific: Corn Proteins Market, by Type, 2022-2031 (USD Million)
- Table 457 Asia-Pacific: Corn Proteins Market, by Type, 2022-2031 (Tons)
- Table 458 Asia-Pacific: Plant-Based Proteins Market, by Form, 2022-2031 (USD Million)
- Table 459 Asia-Pacific: Plant-Based Proteins Market, by Source Process, 2022-2031 (USD Million)
- Table 460 Asia-Pacific: Plant-Based Proteins Market, by Application, 2022-2031 (USD Million)
- Table 461 Asia-Pacific: Plant-Based Proteins Market for Food & Beverage, by Type, 2022-2031 (USD Million)
- Table 462 China: Plant-Based Proteins Market, by Type, 2022-2031 (USD Million)
- Table 463 China: Plant-Based Proteins Market, by Type, 2022-2031 (Tons)
- Table 464 China: Soy Proteins Market, by Type, 2022-2031 (USD Million)
- Table 465 China: Soy Proteins Market, by Type, 2022-2031 (Tons)
- Table 466 China: Wheat Proteins Market, by Type, 2022-2031 (USD Million)
- Table 467 China: Wheat Proteins Market, by Type, 2022-2031 (Tons)
- Table 468 China: Pea Proteins Market, by Type, 2022-2031 (USD Million)
- Table 469 China: Pea Proteins Market, by Type, 2022-2031 (Tons)
- Table 470 China: Yellow Pea Proteins Market, by Type, 2022-2031 (USD Million)
- Table 471 China: Yellow Pea Proteins Market, by Type, 2022-2031 (Tons)
- Table 472 China: Green Pea Proteins Market, by Type, 2022-2031 (USD Million)
- Table 473 China: Green Pea Proteins Market, by Type, 2022-2031 (Tons)
- Table 474 China: Canola Proteins Market, by Type, 2022-2031 (USD Million)
- Table 475 China: Canola Proteins Market, by Type, 2022-2031 (Tons)
- Table 476 China: Potato Proteins Market, by Type, 2022-2031 (USD Million)
- Table 477 China: Potato Proteins Market, by Type, 2022-2031 (Tons)
- Table 478 China: Rice Proteins Market, by Type, 2022-2031 (USD Million)
- Table 479 China: Rice Proteins Market, by Type, 2022-2031 (Tons)
- Table 480 China: Corn Proteins Market, by Type, 2022-2031 (USD Million)
- Table 481 China: Corn Proteins Market, by Type, 2022-2031 (Tons)
- Table 482 China: Plant-Based Proteins Market, by Form, 2022-2031 (USD Million)
- Table 483 China: Plant-Based Proteins Market, by Source Process, 2022-2031 (USD Million)
- Table 484 China: Plant-Based Proteins Market, by Application, 2022-2031 (USD Million)
- Table 485 China: Plant-Based Proteins Market for Food & Beverage, by Type, 2022-2031 (USD Million)
- Table 486 India: Plant-Based Proteins Market, by Type, 2022-2031 (USD Million)
- Table 487 India: Plant-Based Proteins Market, by Type, 2022-2031 (Tons)
- Table 488 India: Soy Proteins Market, by Type, 2022-2031 (USD Million)
- Table 489 India: Soy Proteins Market, by Type, 2022-2031 (Tons)
- Table 490 India: Wheat Proteins Market, by Type, 2022-2031 (USD Million)
- Table 491 India: Wheat Proteins Market, by Type, 2022-2031 (Tons)
- Table 492 India: Pea Proteins Market, by Type, 2022-2031 (USD Million)
- Table 493 India: Pea Proteins Market, by Type, 2022-2031 (Tons)
- Table 494 India: Yellow Pea Proteins Market, by Type, 2022-2031 (USD Million)
- Table 495 India: Yellow Pea Proteins Market, by Type, 2022-2031 (Tons)
- Table 496 India: Green Pea Proteins Market, by Type, 2022-2031 (USD Million)
- Table 497 India: Green Pea Proteins Market, by Type, 2022-2031 (Tons)
- Table 498 India: Canola Proteins Market, by Type, 2022-2031 (USD Million)
- Table 499 India: Canola Proteins Market, by Type, 2022-2031 (Tons)
- Table 500 India: Potato Proteins Market, by Type, 2022-2031 (USD Million)
- Table 501 India: Potato Proteins Market, by Type, 2022-2031 (Tons)
- Table 502 India: Rice Proteins Market, by Type, 2022-2031 (USD Million)
- Table 503 India: Rice Proteins Market, by Type, 2022-2031 (Tons)
- Table 504 India: Corn Proteins Market, by Type, 2022-2031 (USD Million)
- Table 505 India: Corn Proteins Market, by Type, 2022-2031 (Tons)
- Table 506 India: Plant-Based Proteins Market, by Form, 2022-2031 (USD Million)
- Table 507 India: Plant-Based Proteins Market, by Source Process, 2022-2031 (USD Million)
- Table 508 India: Plant-Based Proteins Market, by Application, 2022-2031 (USD Million)
- Table 509 India: Plant-Based Proteins Market for Food & Beverage, by Type, 2022-2031 (USD Million)
- Table 510 Japan: Plant-Based Proteins Market, by Type, 2022-2031 (USD Million)
- Table 511 Japan: Plant-Based Proteins Market, by Type, 2022-2031 (Tons)
- Table 512 Japan: Soy Proteins Market, by Type, 2022-2031 (USD Million)
- Table 513 Japan: Soy Proteins Market, by Type, 2022-2031 (Tons)
- Table 514 Japan: Wheat Proteins Market, by Type, 2022-2031 (USD Million)
- Table 515 Japan: Wheat Proteins Market, by Type, 2022-2031 (Tons)
- Table 516 Japan: Pea Proteins Market, by Type, 2022-2031 (USD Million)
- Table 517 Japan: Pea Proteins Market, by Type, 2022-2031 (Tons)
- Table 518 Japan: Yellow Pea Proteins Market, by Type, 2022-2031 (USD Million)
- Table 519 Japan: Yellow Pea Proteins Market, by Type, 2022-2031 (Tons)
- Table 520 Japan: Green Pea Proteins Market, by Type, 2022-2031 (USD Million)
- Table 521 Japan: Green Pea Proteins Market, by Type, 2022-2031 (Tons)
- Table 522 Japan: Canola Proteins Market, by Type, 2022-2031 (USD Million)
- Table 523 Japan: Canola Proteins Market, by Type, 2022-2031 (Tons)
- Table 524 Japan: Potato Proteins Market, by Type, 2022-2031 (USD Million)
- Table 525 Japan: Potato Proteins Market, by Type, 2022-2031 (Tons)
- Table 526 Japan: Rice Proteins Market, by Type, 2022-2031 (USD Million)
- Table 527 Japan: Rice Proteins Market, by Type, 2022-2031 (Tons)
- Table 528 Japan: Corn Proteins Market, by Type, 2022-2031 (USD Million)
- Table 529 Japan: Corn Proteins Market, by Type, 2022-2031 (Tons)
- Table 530 Japan: Plant-Based Proteins Market, by Form, 2022-2031 (USD Million)
- Table 531 Japan: Plant-Based Proteins Market, by Source Process, 2022-2031 (USD Million)
- Table 532 Japan: Plant-Based Proteins Market, by Application, 2022-2031 (USD Million)
- Table 533 Japan: Plant-Based Proteins Market for Food & Beverage, by Type, 2022-2031 (USD Million)
- Table 534 Australia: Plant-Based Proteins Market, by Type, 2022-2031 (USD Million)
- Table 535 Australia: Plant-Based Proteins Market, by Type, 2022-2031 (Tons)
- Table 536 Australia: Soy Proteins Market, by Type, 2022-2031 (USD Million)
- Table 537 Australia: Soy Proteins Market, by Type, 2022-2031 (Tons)
- Table 538 Australia: Wheat Proteins Market, by Type, 2022-2031 (USD Million)
- Table 539 Australia: Wheat Proteins Market, by Type, 2022-2031 (Tons)
- Table 540 Australia: Pea Proteins Market, by Type, 2022-2031 (USD Million)
- Table 541 Australia: Pea Proteins Market, by Type, 2022-2031 (Tons)
- Table 542 Australia: Yellow Pea Proteins Market, by Type, 2022-2031 (USD Million)
- Table 543 Australia: Yellow Pea Proteins Market, by Type, 2022-2031 (Tons)
- Table 544 Australia: Green Pea Proteins Market, by Type, 2022-2031 (USD Million)
- Table 545 Australia: Green Pea Proteins Market, by Type, 2022-2031 (Tons)
- Table 546 Australia: Canola Proteins Market, by Type, 2022-2031 (USD Million)
- Table 547 Australia: Canola Proteins Market, by Type, 2022-2031 (Tons)
- Table 548 Australia: Potato Proteins Market, by Type, 2022-2031 (USD Million)
- Table 549 Australia: Potato Proteins Market, by Type, 2022-2031 (Tons)
- Table 550 Australia: Rice Proteins Market, by Type, 2022-2031 (USD Million)
- Table 551 Australia: Rice Proteins Market, by Type, 2022-2031 (Tons)
- Table 552 Australia: Corn Proteins Market, by Type, 2022-2031 (USD Million)
- Table 553 Australia: Corn Proteins Market, by Type, 2022-2031 (Tons)
- Table 554 Australia: Plant-Based Proteins Market, by Form, 2022-2031 (USD Million)
- Table 555 Australia: Plant-Based Proteins Market, by Source Process, 2022-2031 (USD Million)
- Table 556 Australia: Plant-Based Proteins Market, by Application, 2022-2031 (USD Million)
- Table 557 Australia: Plant-Based Proteins Market for Food & Beverage, by Type, 2022-2031 (USD Million)
- Table 558 Rest of Asia-Pacific: Plant-Based Proteins Market, by Type, 2022-2031 (USD Million)
- Table 559 Rest of Asia-Pacific: Plant-Based Proteins Market, by Type, 2022-2031 (Tons)
- Table 560 Rest of Asia-Pacific: Soy Proteins Market, by Type, 2022-2031 (USD Million)
- Table 561 Rest of Asia-Pacific: Soy Proteins Market, by Type, 2022-2031 (Tons)
- Table 562 Rest of Asia-Pacific: Wheat Proteins Market, by Type, 2022-2031 (USD Million)
- Table 563 Rest of Asia-Pacific: Wheat Proteins Market, by Type, 2022-2031 (Tons)
- Table 564 Rest of Asia-Pacific: Pea Proteins Market, by Type, 2022-2031 (USD Million)
- Table 565 Rest of Asia-Pacific: Pea Proteins Market, by Type, 2022-2031 (Tons)
- Table 566 Rest of Asia-Pacific: Yellow Pea Proteins Market, by Type, 2022-2031 (USD Million)
- Table 567 Rest of Asia-Pacific: Yellow Pea Proteins Market, by Type, 2022-2031 (Tons)
- Table 568 Rest of Asia-Pacific: Green Pea Proteins Market, by Type, 2022-2031 (USD Million)
- Table 569 Rest of Asia-Pacific: Green Pea Proteins Market, by Type, 2022-2031 (Tons)
- Table 570 Rest of Asia-Pacific: Canola Proteins Market, by Type, 2022-2031 (USD Million)
- Table 571 Rest of Asia-Pacific: Canola Proteins Market, by Type, 2022-2031 (Tons)
- Table 572 Rest of Asia-Pacific: Potato Proteins Market, by Type, 2022-2031 (USD Million)
- Table 573 Rest of Asia-Pacific: Potato Proteins Market, by Type, 2022-2031 (Tons)
- Table 574 Rest of Asia-Pacific: Rice Proteins Market, by Type, 2022-2031 (USD Million)
- Table 575 Rest of Asia-Pacific: Rice Proteins Market, by Type, 2022-2031 (Tons)
- Table 576 Rest of Asia-Pacific: Corn Proteins Market, by Type, 2022-2031 (USD Million)
- Table 577 Rest of Asia-Pacific: Corn Proteins Market, by Type, 2022-2031 (Tons)
- Table 578 Rest of Asia-Pacific: Plant-Based Proteins Market, by Form, 2022-2031 (USD Million)
- Table 579 Rest of Asia-Pacific: Plant-Based Proteins Market, by Source Process, 2022-2031 (USD Million)
- Table 580 Rest of Asia-Pacific: Plant-Based Proteins Market, by Application, 2022-2031 (USD Million)
- Table 581 Rest of Asia-Pacific: Plant-Based Proteins Market for Food & Beverage, by Type, 2022-2031 (USD Million)
- Table 582 Latin America: Plant-Based Proteins Market, by Country/Region, 2022-2031 (USD Million)
- Table 583 Latin America: Plant-Based Proteins Market, by Country/Region, 2022-2031 (Tons)
- Table 584 Latin America: Plant-Based Proteins Market, by Type, 2022-2031 (USD Million)
- Table 585 Latin America: Plant-Based Proteins Market, by Type, 2022-2031 (Tons)
- Table 586 Latin America: Soy Proteins Market, by Type, 2022-2031 (USD Million)
- Table 587 Latin America: Soy Proteins Market, by Type, 2022-2031 (Tons)
- Table 588 Latin America: Wheat Proteins Market, by Type, 2022-2031 (USD Million)
- Table 589 Latin America: Wheat Proteins Market, by Type, 2022-2031 (Tons)
- Table 590 Latin America: Pea Proteins Market, by Type, 2022-2031 (USD Million)
- Table 591 Latin America: Pea Proteins Market, by Type, 2022-2031 (Tons)
- Table 592 Latin America: Yellow Pea Proteins Market, by Type, 2022-2031 (USD Million)
- Table 593 Latin America: Yellow Pea Proteins Market, by Type, 2022-2031 (Tons)
- Table 594 Latin America: Green Pea Proteins Market, by Type, 2022-2031 (USD Million)
- Table 595 Latin America: Green Pea Proteins Market, by Type, 2022-2031 (Tons)
- Table 596 Latin America: Canola Proteins Market, by Type, 2022-2031 (USD Million)
- Table 597 Latin America: Canola Proteins Market, by Type, 2022-2031 (Tons)
- Table 598 Latin America: Potato Proteins Market, by Type, 2022-2031 (USD Million)
- Table 599 Latin America: Potato Proteins Market, by Type, 2022-2031 (Tons)
- Table 600 Latin America: Rice Proteins Market, by Type, 2022-2031 (USD Million)
- Table 601 Latin America: Rice Proteins Market, by Type, 2022-2031 (Tons)
- Table 602 Latin America: Corn Proteins Market, by Type, 2022-2031 (USD Million)
- Table 603 Latin America: Corn Proteins Market, by Type, 2022-2031 (Tons)
- Table 604 Latin America: Plant-Based Proteins Market, by Form, 2022-2031 (USD Million)
- Table 605 Latin America: Plant-Based Proteins Market, by Source Process, 2022-2031 (USD Million)
- Table 606 Latin America: Plant-Based Proteins Market, by Application, 2022-2031 (USD Million)
- Table 607 Latin America: Plant-Based Proteins Market for Food & Beverage, by Type, 2022-2031 (USD Million)
- Table 608 Brazil: Plant-Based Proteins Market, by Type, 2022-2031 (USD Million)
- Table 609 Brazil: Plant-Based Proteins Market, by Type, 2022-2031 (Tons)
- Table 610 Brazil: Soy Proteins Market, by Type, 2022-2031 (USD Million)
- Table 611 Brazil: Soy Proteins Market, by Type, 2022-2031 (Tons)
- Table 612 Brazil: Wheat Proteins Market, by Type, 2022-2031 (USD Million)
- Table 613 Brazil: Wheat Proteins Market, by Type, 2022-2031 (Tons)
- Table 614 Brazil: Pea Proteins Market, by Type, 2022-2031 (USD Million)
- Table 615 Brazil: Pea Proteins Market, by Type, 2022-2031 (Tons)
- Table 616 Brazil: Yellow Pea Proteins Market, by Type, 2022-2031 (USD Million)
- Table 617 Brazil: Yellow Pea Proteins Market, by Type, 2022-2031 (Tons)
- Table 618 Brazil: Green Pea Proteins Market, by Type, 2022-2031 (USD Million)
- Table 619 Brazil: Green Pea Proteins Market, by Type, 2022-2031 (Tons)
- Table 620 Brazil: Canola Proteins Market, by Type, 2022-2031 (USD Million)
- Table 621 Brazil: Canola Proteins Market, by Type, 2022-2031 (Tons)
- Table 622 Brazil: Potato Proteins Market, by Type, 2022-2031 (USD Million)
- Table 623 Brazil: Potato Proteins Market, by Type, 2022-2031 (Tons)
- Table 624 Brazil: Rice Proteins Market, by Type, 2022-2031 (USD Million)
- Table 625 Brazil: Rice Proteins Market, by Type, 2022-2031 (Tons)
- Table 626 Brazil: Corn Proteins Market, by Type, 2022-2031 (USD Million)
- Table 627 Brazil: Corn Proteins Market, by Type, 2022-2031 (Tons)
- Table 628 Brazil: Plant-Based Proteins Market, by Form, 2022-2031 (USD Million)
- Table 629 Brazil: Plant-Based Proteins Market, by Source Process, 2022-2031 (USD Million)
- Table 630 Brazil: Plant-Based Proteins Market, by Application, 2022-2031 (USD Million)
- Table 631 Brazil: Plant-Based Proteins Market for Food & Beverage, by Type, 2022-2031 (USD Million)
- Table 632 Mexico: Plant-Based Proteins Market, by Type, 2022-2031 (USD Million)
- Table 633 Mexico: Plant-Based Proteins Market, by Type, 2022-2031 (Tons)
- Table 634 Mexico: Soy Proteins Market, by Type, 2022-2031 (USD Million)
- Table 635 Mexico: Soy Proteins Market, by Type, 2022-2031 (Tons)
- Table 636 Mexico: Wheat Proteins Market, by Type, 2022-2031 (USD Million)
- Table 637 Mexico: Wheat Proteins Market, by Type, 2022-2031 (Tons)
- Table 638 Mexico: Pea Proteins Market, by Type, 2022-2031 (USD Million)
- Table 639 Mexico: Pea Proteins Market, by Type, 2022-2031 (Tons)
- Table 640 Mexico: Yellow Pea Proteins Market, by Type, 2022-2031 (USD Million)
- Table 641 Mexico: Yellow Pea Proteins Market, by Type, 2022-2031 (Tons)
- Table 642 Mexico: Green Pea Proteins Market, by Type, 2022-2031 (USD Million)
- Table 643 Mexico: Green Pea Proteins Market, by Type, 2022-2031 (Tons)
- Table 644 Mexico: Canola Proteins Market, by Type, 2022-2031 (USD Million)
- Table 645 Mexico: Canola Proteins Market, by Type, 2022-2031 (Tons)
- Table 646 Mexico: Potato Proteins Market, by Type, 2022-2031 (USD Million)
- Table 647 Mexico: Potato Proteins Market, by Type, 2022-2031 (Tons)
- Table 648 Mexico: Rice Proteins Market, by Type, 2022-2031 (USD Million)
- Table 649 Mexico: Rice Proteins Market, by Type, 2022-2031 (Tons)
- Table 650 Mexico: Corn Proteins Market, by Type, 2022-2031 (USD Million)
- Table 651 Mexico: Corn Proteins Market, by Type, 2022-2031 (Tons)
- Table 652 Mexico: Plant-Based Proteins Market, by Form, 2022-2031 (USD Million)
- Table 653 Mexico: Plant-Based Proteins Market, by Source Process, 2022-2031 (USD Million)
- Table 654 Mexico: Plant-Based Proteins Market, by Application, 2022-2031 (USD Million)
- Table 655 Mexico: Plant-Based Proteins Market for Food & Beverage, by Type, 2022-2031 (USD Million)
- Table 656 Argentina: Plant-Based Proteins Market, by Type, 2022-2031 (USD Million)
- Table 657 Argentina: Plant-Based Proteins Market, by Type, 2022-2031 (Tons)
- Table 658 Argentina: Soy Proteins Market, by Type, 2022-2031 (USD Million)
- Table 659 Argentina: Soy Proteins Market, by Type, 2022-2031 (Tons)
- Table 660 Argentina: Wheat Proteins Market, by Type, 2022-2031 (USD Million)
- Table 661 Argentina: Wheat Proteins Market, by Type, 2022-2031 (Tons)
- Table 662 Argentina: Pea Proteins Market, by Type, 2022-2031 (USD Million)
- Table 663 Argentina: Pea Proteins Market, by Type, 2022-2031 (Tons)
- Table 664 Argentina: Yellow Pea Proteins Market, by Type, 2022-2031 (USD Million)
- Table 665 Argentina: Yellow Pea Proteins Market, by Type, 2022-2031 (Tons)
- Table 666 Argentina: Green Pea Proteins Market, by Type, 2022-2031 (USD Million)
- Table 667 Argentina: Green Pea Proteins Market, by Type, 2022-2031 (Tons)
- Table 668 Argentina: Canola Proteins Market, by Type, 2022-2031 (USD Million)
- Table 669 Argentina: Canola Proteins Market, by Type, 2022-2031 (Tons)
- Table 670 Argentina: Potato Proteins Market, by Type, 2022-2031 (USD Million)
- Table 671 Argentina: Potato Proteins Market, by Type, 2022-2031 (Tons)
- Table 672 Argentina: Rice Proteins Market, by Type, 2022-2031 (USD Million)
- Table 673 Argentina: Rice Proteins Market, by Type, 2022-2031 (Tons)
- Table 674 Argentina: Corn Proteins Market, by Type, 2022-2031 (USD Million)
- Table 675 Argentina: Corn Proteins Market, by Type, 2022-2031 (Tons)
- Table 676 Argentina: Plant-Based Proteins Market, by Form, 2022-2031 (USD Million)
- Table 677 Argentina: Plant-Based Proteins Market, by Source Process, 2022-2031 (USD Million)
- Table 678 Argentina: Plant-Based Proteins Market, by Application, 2022-2031 (USD Million)
- Table 679 Argentina: Plant-Based Proteins Market for Food & Beverage, by Type, 2022-2031 (USD Million)
- Table 680 Rest of Latin America: Plant-Based Proteins Market, by Type, 2022-2031 (USD Million)
- Table 681 Rest of Latin America: Plant-Based Proteins Market, by Type, 2022-2031 (Tons)
- Table 682 Rest of Latin America: Soy Proteins Market, by Type, 2022-2031 (USD Million)
- Table 683 Rest of Latin America: Soy Proteins Market, by Type, 2022-2031 (Tons)
- Table 684 Rest of Latin America: Wheat Proteins Market, by Type, 2022-2031 (USD Million)
- Table 685 Rest of Latin America: Wheat Proteins Market, by Type, 2022-2031 (Tons)
- Table 686 Rest of Latin America: Pea Proteins Market, by Type, 2022-2031 (USD Million)
- Table 687 Rest of Latin America: Pea Proteins Market, by Type, 2022-2031 (Tons)
- Table 688 Rest of Latin America: Yellow Pea Proteins Market, by Type, 2022-2031 (USD Million)
- Table 689 Rest of Latin America: Yellow Pea Proteins Market, by Type, 2022-2031 (Tons)
- Table 690 Rest of Latin America: Green Pea Proteins Market, by Type, 2022-2031 (USD Million)
- Table 691 Rest of Latin America: Green Pea Proteins Market, by Type, 2022-2031 (Tons)
- Table 692 Rest of Latin America: Canola Proteins Market, by Type, 2022-2031 (USD Million)
- Table 693 Rest of Latin America: Canola Proteins Market, by Type, 2022-2031 (Tons)
- Table 694 Rest of Latin America: Potato Proteins Market, by Type, 2022-2031 (USD Million)
- Table 695 Rest of Latin America: Potato Proteins Market, by Type, 2022-2031 (Tons)
- Table 696 Rest of Latin America: Rice Proteins Market, by Type, 2022-2031 (USD Million)
- Table 697 Rest of Latin America: Rice Proteins Market, by Type, 2022-2031 (Tons)
- Table 698 Rest of Latin America: Corn Proteins Market, by Type, 2022-2031 (USD Million)
- Table 699 Rest of Latin America: Corn Proteins Market, by Type, 2022-2031 (Tons)
- Table 700 Rest of Latin America: Plant-Based Proteins Market, by Form, 2022-2031 (USD Million)
- Table 701 Rest of Latin America: Plant-Based Proteins Market, by Source Process, 2022-2031 (USD Million)
- Table 702 Rest of Latin America: Plant-Based Proteins Market, by Application, 2022-2031 (USD Million)
- Table 703 Rest of Latin America: Plant-Based Proteins Market for Food & Beverage, By Type, 2022-2031 (USD Million)
- Table 704 Middle East & Africa: Plant-Based Proteins Market, by Type, 2022-2031 (USD Million)
- Table 705 Middle East & Africa: Plant-Based Proteins Market, by Type, 2022-2031 (Tons)
- Table 706 Middle East & Africa: Soy Proteins Market, by Type, 2022-2031 (USD Million)
- Table 707 Middle East & Africa: Soy Proteins Market, by Type, 2022-2031 (Tons)
- Table 708 Middle East & Africa: Wheat Proteins Market, by Type, 2022-2031 (USD Million)
- Table 709 Middle East & Africa: Wheat Proteins Market, by Type, 2022-2031 (Tons)
- Table 710 Middle East & Africa: Pea Proteins Market, by Type, 2022-2031 (USD Million)
- Table 711 Middle East & Africa: Pea Proteins Market, by Type, 2022-2031 (Tons)
- Table 712 Middle East & Africa: Yellow Pea Proteins Market, by Type, 2022-2031 (USD Million)
- Table 713 Middle East & Africa: Yellow Pea Proteins Market, by Type, 2022-2031 (Tons)
- Table 714 Middle East & Africa: Green Pea Proteins Market, by Type, 2022-2031 (USD Million)
- Table 715 Middle East & Africa: Green Pea Proteins Market, by Type, 2022-2031 (Tons)
- Table 716 Middle East & Africa: Canola Proteins Market, by Type, 2022-2031 (USD Million)
- Table 717 Middle East & Africa: Canola Proteins Market, by Type, 2022-2031 (Tons)
- Table 718 Middle East & Africa: Potato Proteins Market, by Type, 2022-2031 (USD Million)
- Table 719 Middle East & Africa: Potato Proteins Market, by Type, 2022-2031 (Tons)
- Table 720 Middle East & Africa: Rice Proteins Market, by Type, 2022-2031 (USD Million)
- Table 721 Middle East & Africa: Rice Proteins Market, by Type, 2022-2031 (Tons)
- Table 722 Middle East & Africa: Corn Proteins Market, by Type, 2022-2031 (USD Million)
- Table 723 Middle East & Africa: Corn Proteins Market, by Type, 2022-2031 (Tons)
- Table 724 Middle East & Africa: Plant-Based Proteins Market, by Form, 2022-2031 (USD Million)
- Table 725 Middle East & Africa: Plant-Based Proteins Market, by Source Process, 2022-2031 (USD Million)
- Table 726 Middle East & Africa: Plant-Based Proteins Market, by Application, 2022-2031 (USD Million)
- Table 727 Middle East & Africa: Plant-Based Proteins Market for Food & Beverage, by Type, 2022-2031 (USD Million)
- Table 728 Total Number of Recent Developments, by Company (2020-2023)
- Table 729 Global Plant Proteins Market Position Analysis of Companies, by Major Parameters
LIST OF FIGURES
- Figure 1 Research Process
- Figure 2 Key Secondary Sources Referenced for This Study
- Figure 3 Primary Research Techniques
- Figure 4 Key Executives Interviewed
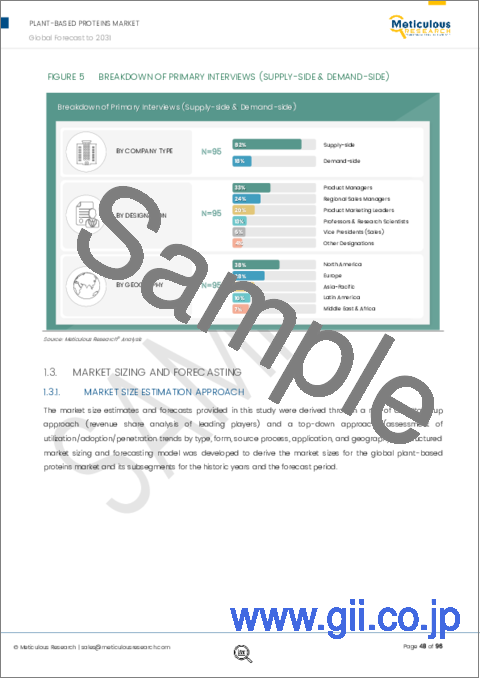
- Figure 5 Breakdown of Primary Interviews (Supply-Side & Demand-Side)
- Figure 6 Market Sizing And Growth Forecast
- Figure 7 The Soy Proteins Segment is Expected to Account for the Largest Share of the Market in 2024
- Figure 8 The Solid (Dry) Segment is Projected to Witness Significant Growth in the Market During 2024-2031
- Figure 9 The Organic Plant-Based Protein Ingredients Segment is Projected to Witness Significant Growth in the Market During 2024-2031
- Figure 10 The Food & Beverage Segment is Expected to Account for the Largest Share of the Market in 2024
- Figure 11 In 2024, North America is Expected to Dominate the Market
- Figure 12 Impact Analysis of Market Dynamics
- Figure 13 Value Chain Analysis: Plant-Based Proteins
- Figure 14 Global Plant-Based Proteins Market, by Type, 2024 Vs. 2031 (USD Million)
- Figure 15 Global Plant-Based Proteins Market, by Type, 2024 Vs. 2031 (Tons)
- Figure 16 Global Plant-Based Proteins Market, by Form, 2024 Vs. 2031 (USD Million)
- Figure 17 Global Plant-Based Proteins Market, by Source Process, 2024 Vs. 2031 (USD Million)
- Figure 18 Global Plant-Based Proteins Market, by Application, 2024 Vs. 2031 (USD Million)
- Figure 19 Health Benefits of Dairy Alternatives
- Figure 20 Key Trends Driving the Pet Food Products Market
- Figure 21 Global Plant-Based Proteins Market, by Region, 2024 Vs. 2031 (USD Million)
- Figure 22 Global Plant-Based Proteins Market, by Region, 2024 Vs. 2031 (Tons)
- Figure 23 North America: Landscape for Plant-Based Proteins Market (2023)
- Figure 24 North America: Plant-Based Proteins Market Snapshot
- Figure 25 U.S.: Plant-Based Proteins Market Dynamics
- Figure 26 U.S.: Factors Influencing the Buying Decision of Plant-Based Products
- Figure 27 Canada: Key Market Drivers
- Figure 28 Canada: Population Share, by Vegetarian Vs. Others, 2021 (%)
- Figure 29 Europe: Plant-Based Proteins Market Dynamics
- Figure 30 Europe: Plant-Based Proteins Market Snapshot
- Figure 31 Germany: Key Market Drivers
- Figure 32 France: Key Market Drivers
- Figure 33 U.K.: Plant-Based Proteins Industry Insights
- Figure 34 Asia-Pacific: Plant-Based Proteins Market Snapshot
- Figure 35 Latin America: Plant-Based Proteins Market Snapshot
- Figure 36 Middle East & Africa: Plant-Based Proteins Market Snapshot
- Figure 37 Key Growth Strategies Adopted by Leading Players (2020-2024)
- Figure 38 Plant-Based Proteins Market: Competitive Benchmarking, by Type
- Figure 39 Competitive Dashboard: Global Plant-Based Proteins Market
- Figure 40 Global Plant Proteins Market Position Analysis, by Key Companies
- Figure 41 Archer Daniels Midland Company: Financial Overview (2022)
- Figure 42 Cargill, Incorporated: Financial Overview (2023)
- Figure 43 Roquette Freres: Financial Overview (2023)
- Figure 44 Ingredion Incorporated: Financial Overview (2022)
- Figure 45 Kerry Group plc: Financial Overview (2022)
- Figure 46 International Flavors & Fragrances, Inc.: Financial Overview (2022)
- Figure 47 Tate & Lyle PLC: Financial Overview (2023)
- Figure 48 Burcon NutraScience Corporation: Financial Overview (2023)
- Figure 49 Sudzucker AG: Financial Overview (2023)
- Figure 50 Ezaki Glico Co., Ltd.: Financial Overview (2022)
- Figure 51 Glanbia Plc: Financial Overview (2022)
- Figure 52 Wilmar International Limited: Financial Overview (2022)
- Figure 53 CHS Inc.: Financial Overview (2022)
Plant-based Proteins Market By Type (Soy Proteins, Wheat Proteins, Pea Proteins, Potato Proteins), Form (Solid, Liquid), Source Process (Conventional, Organic), and Application (Food and Beverages, Animal Feed, Nutritional Supplements)-Global Forecast to 2031
According to the research report titled, 'Plant-based Proteins Market by Type (Soy Proteins, Wheat Proteins, Pea Proteins, Potato Proteins), Form (Solid, Liquid), Source Process (Conventional, Organic), and Application (Food and Beverages, Animal Feed, Nutritional Supplements)-Global Forecast to 2031,' the plant-based proteins market is projected to reach $26.45 billion by 2031, at a CAGR of 8.4% during the forecast period 2024-2031. The report provides an in-depth analysis of the global plant-based proteins market across five major regions, emphasizing the current market trends, market sizes, recent developments, and forecasts till 2031.
Following extensive secondary and primary research and an in-depth analysis of the market scenario, the report conducts the impact analysis of the key industry drivers, restraints, opportunities, challenges, and trends. The growth of this market is driven by the rising need for protein-rich diets, growing health and wellness trends, increasing consumer focus on meat alternatives, rising demand from the food & beverage industry, and advancements in ingredient technologies, such as microencapsulation. However, consumers' preference for animal-based products and fluctuating raw material prices are expected to hinder the growth of this market.
Furthermore, consumers' increasing inclination toward plant-based diets, emerging economies, and rising prevalence of intolerance to animal proteins are expected to generate growth opportunities for the players operating in the plant-based proteins market.
The key players operating in the global plant-based proteins market are Archer-Daniels-Midland Company (U.S.), Cargill, Incorporated (U.S.), Roquette Freres (France), Ingredion Incorporated (U.S.), Kerry Group plc (Ireland), International Flavors & Fragrances, Inc. (IFF) (U.S.), Now Health Group, Inc. (U.S.), Tate & Lyle Plc (U.K.), Axiom Foods Inc. (U.S.), AMCO Protein (U.S.), Burcon NutraScience Corporation (Canada), BENEO GmbH (A Part of Sudzucker AG) (Germany), Glico Nutrition Co., Ltd (Japan), Glanbia Plc (Ireland), Cosucra Groupe Warcoing SA (Belgium), Sotexpro (France), Farbest-Tallman Foods Corporation (U.S.), Crespel & Deiters GmbH & Co. KG (Germany), Wilmar International (Singapore), and CHS Inc. (U.S.).
The global plant-based proteins market is segmented by type (soy proteins [soy protein concentrate, soy protein isolate, textured soy protein, and other soy proteins], wheat proteins [vital wheat gluten, wheat protein isolate, hydrolyzed wheat protein, and textured wheat protein], pea proteins [yellow pea protein {yellow pea protein isolate, yellow pea protein concentrate, yellow textured pea protein, yellow pea protein hydrolysate, yellow pea flour, and other yellow pea proteins}, green pea protein {green pea protein isolate, green pea protein concentrate, green textured pea protein, green pea protein hydrolysate, green pea flour, and other green pea proteins}], canola proteins [canola protein isolate, canola protein concentrate, and other canola proteins], potato proteins [potato protein concentrate and potato protein isolate], rice proteins [rice protein isolate, rice protein concentrate, and rice protein hydrolysate], corn proteins [corn protein isolate, corn protein concentrate, and other corn proteins], and other plant proteins), form (solid and liquid), source process (conventional plant-based protein ingredients and organic plant-based protein ingredients), application (food & beverage [meat, poultry, and seafood; bakery, meat analogs, dairy alternatives, cereals & snacks, beverages, and other food & beverage applications], animal feed, nutrition & health supplements, pharmaceuticals, and other plant protein-based applications), and geography. The study also evaluates industry competitors and analyzes the market at the regional and country levels.
Based on type, the global plant-based proteins market is segmented into soy proteins, wheat proteins, pea proteins, canola proteins, potato proteins, rice proteins, corn proteins, and other types. In 2024, the soy proteins segment is expected to account for the largest share of the global plant-based proteins market. The large market share of this segment is mainly attributed to its easy availability, lower price of soy protein than other protein sources, increased demand for meat protein alternatives, a wide range of applications in various products, greater consumer awareness, and multiple health benefits.
Based on form, the global plant-based proteins market is categorized into solid (dry) and liquid. In 2024, the solid segment is expected to account for the larger share of the global plant-based proteins market. The large market share of this segment is attributed to the increasing demand for powdered plant-based protein due to its benefits, such as ease of handling and transport, comparatively lower costs, low chances of formulation errors, and ingredient stability. This segment is also expected to register the highest CAGR during the forecast period.
Based on source process, the global plant-based proteins market is broadly segmented into conventional plant-based protein ingredients and organic plant-based protein ingredients. In 2024, the conventional plant-based protein ingredients segment is expected to account for the larger share of the global plant-based proteins market. The large market share of this segment is attributed to the widespread availability of crops cultivated through traditional harvesting methods (utilizing chemical fertilizers), the easy accessibility to cost-effective conventional plant-based protein ingredients, the extended shelf life of these proteins, and the availability of a diverse range of crop varieties. However, the organic plant-based protein ingredients segment is expected to register the highest CAGR during the forecast period.
Based on application, the global plant-based proteins market is segmented into food & beverage, animal feed, nutrition & health supplements, pharmaceuticals, and other applications. In 2024, the food & beverage segment is expected to account for the largest share of the global plant-based proteins market. However, the nutrition & health supplements segment is expected to record a CAGR during the forecast period of 2024-2031. The growth of this segment is mainly attributed to changing lifestyles, growing health & wellness trends, and the increasing prevalence of diseases.
An in-depth geographic analysis of the industry provides detailed qualitative and quantitative insights into the five major regions (North America, Europe, Asia-Pacific, Latin America, and the Middle East & Africa) and the coverage of major countries in each region. Asia-Pacific is projected to register the highest CAGR during the forecast period. The growth of this regional market is driven by the increasing awareness about the importance of consuming protein-rich diets, the increasing health consciousness among consumers, the growth in the food & beverages industry, rapid economic growth and urbanization, and the large vegan population in the region.
Key Questions Answered in the Report-
- What is the current revenue generated by plant-based proteins globally?
- At what rate is the global demand for plant-based proteins projected to grow for the next 5-7 years?
- What are the historical market sizes and growth rates of the global plant-based proteins market?
- What are the major factors impacting the growth of this market at the regional and country levels? What are the major opportunities for existing players and new entrants in the market?
- Which segments in terms of type, form, source, process, and application are expected to create major traction for the manufacturers in this market?
- What are the key geographical trends in this market? Which regions/countries are expected to offer significant growth opportunities for the manufacturers operating in the global plant-based proteins market?
- Who are the major players in the global plant-based proteins market? What are their specific product offerings in this market?
- What are the recent strategic developments in the global plant-based proteins market? What are the impacts of these strategic developments on the market?
Scope of the Report:
Plant-based Proteins Market Assessment-by Type
- Soy Proteins
- Soy Protein Concentrate
- Soy Protein Isolate
- Textured Soy Protein
- Other Soy Proteins
- Wheat Proteins
- Vital Wheat Gluten
- Wheat Protein Isolate
- Hydrolyzed Wheat Protein
- Textured Wheat Protein
- Pea Proteins
- Yellow Pea Proteins
- Yellow Pea Protein Isolates
- Yellow Pea Protein Concentrates
- Textured Yellow Pea Protein
- Yellow Pea Protein Hydrolysate
- Yellow Pea Flour
- Other Yellow Pea Protein Types
- Green Pea Proteins
- Green Pea Protein Isolates
- Green Pea Protein Concentrates
- Textured Green Pea Protein
- Green Pea Protein Hydrolysate
- Green Pea Flour
- Other Green Pea Protein Types
- Canola Proteins
- Canola Protein Isolate
- Canola Protein Concentrate
- Other Canola Proteins
- Potato Proteins
- Potato Protein Concentrate
- Potato Protein Isolate
- Rice Proteins
- Rice Protein Isolate
- Rice Protein Concentrate
- Rice Protein Hydrolysate
- Corn Proteins
- Corn Protein Isolate
- Corn Protein Concentrate
- Corn Protein Hydrolysate
- Other plant-based proteins
Plant-based Proteins Market Assessment-by Form
- Solid (Dry)
- Liquid
Plant-based Proteins Market Assessment-by Source Process
- Conventional Plant-Based Protein Ingredients
- Organic Plant-Based Protein Ingredients
Plant-based Proteins Market Assessment-by Application
- Food & Beverage
- Animal Feed
- Nutrition & Health Supplements
- Pharmaceuticals
- Other Plant Protein-based Applications
Plant-based Proteins Market Assessment-by Geography
- North America
- U.S.
- Canada
- Europe
- Germany
- France
- U.K.
- Italy
- Spain
- Rest of Europe
- Asia-Pacific
- China
- India
- Japan
- Australia
- Rest of Asia-Pacific
- Latin America
- Brazil
- Mexico
- Argentina
- Rest of Latin America
- Middle East & Africa
TABLE OF CONTENTS
1. Introduction
- 1.1. Market Definition & Scope
- 1.2. Market Ecosystem
- 1.3. Currency
- 1.4. Key Stakeholders
2. Research Methodology
- 2.1. Research Approach
- 2.2. Data Collection & Validation
- 2.2.1. Secondary Research
- 2.2.2. Primary Research/Interviews With Key Opinion Leaders From the Industry
- 2.3. Market Sizing and Forecasting
- 2.3.1. Market Size Estimation Approach
- 2.3.2. Growth Forecast Approach
- 2.4. Assumptions for the Study
3. Executive Summary
- 3.1. Overview
- 3.2. Segment Analysis
- 3.2.1. Plant-Based Proteins Market, by Type
- 3.2.2. Plant-Based Proteins Market, by Form
- 3.2.3. Plant-Based Proteins Market, by Source Process
- 3.2.4. Plant-Based Proteins Market, by Application
- 3.3. Plant-Based Proteins Market, Regional Analysis
- 3.4. Competitive Landscape & Market Competitors
4. Market Insights
- 4.1. Overview
- 4.2. Factors Affecting Market Growth
- 4.2.1. Rising Need for Protein-Rich Diets Driving the Consumption of Plant-Based Proteins
- 4.2.2. Growing Health And Wellness Trends Driving the Demand for Plant-Based Proteins
- 4.2.3. Increasing Consumer Focus on Meat Alternatives Supporting Market Growth
- 4.2.4. Rising Demand From the Food & Beverage Industry Increasing the Production of Plant-Based Proteins
- 4.2.5. Advancements in Ingredient Technologies, Such as Microencapsulation Accelerating Market Expansion
- 4.2.6. Consumer Preference for Animal-Based Products Limiting the Demand for Plant-Based Proteins
- 4.2.7. Fluctuating Raw Material Prices Restraining Market Growth
- 4.2.8. Consumers' Increasing Inclination Toward Plant-Based Diets Expected to Drive the Consumption of Plant Proteins
- 4.2.9. Emerging Economies Expected to Offer Growth Opportunities for Market Players
- 4.2.10. Rising Prevalence of Intolerance to Animal Proteins Expected to Positively Influence the Plant-Based Proteins Market
- 4.2.11. Rising Awareness About the Benefits of Soy-Free And Gluten-Free Foods Impacting Market Growth
- 4.3. Key Trends
- 4.3.1. Increasing Investments Boosting the Production of Plant-Based Proteins
- 4.4. Investment And Funding Scenario
- 4.5. Pricing Analysis
- 4.5.1. Overview
- 4.5.2. Soy Proteins
- 4.5.2.1. Soy Protein Concentrate
- 4.5.2.2. Soy Protein Isolate
- 4.5.2.3. Textured Soy Protein
- 4.5.2.4. Other Soy Proteins
- 4.5.3. Wheat Proteins
- 4.5.3.1. Vital Wheat Gluten
- 4.5.3.2. Wheat Protein Isolate
- 4.5.3.3. Hydrolyzed Wheat Protein
- 4.5.3.4. Textured Wheat Protein
- 4.5.4. Pea Proteins
- 4.5.4.1. Yellow Pea Proteins
- 4.5.4.1.1. Yellow Pea Protein Isolate
- 4.5.4.1.2. Yellow Pea Protein Concentrate
- 4.5.4.1.3. Textured Yellow Pea Protein
- 4.5.4.1.4. Yellow Pea Protein Hydrolysate
- 4.5.4.1.5. Yellow Pea Flour
- 4.5.4.1.6. Other Yellow Pea Proteins
- 4.5.4.2. Green Pea Proteins
- 4.5.4.2.1. Green Pea Protein Isolate
- 4.5.4.2.2. Green Pea Protein Concentrate
- 4.5.4.2.3. Textured Green Pea Protein
- 4.5.4.2.4. Green Pea Protein Hydrolysate
- 4.5.4.2.5. Green Pea Flour
- 4.5.4.2.6. Other Green Pea Proteins
- 4.5.4.1. Yellow Pea Proteins
- 4.5.5. Canola Proteins
- 4.5.5.1. Canola Protein Isolate
- 4.5.5.2. Canola Protein Concentrate
- 4.5.5.3. Other Canola Proteins
- 4.5.6. Potato Proteins
- 4.5.6.1. Potato Protein Concentrate
- 4.5.6.2. Potato Protein Isolate
- 4.5.7. Rice Proteins
- 4.5.7.1. Rice Protein Isolate
- 4.5.7.2. Rice Protein Concentrate
- 4.5.7.3. Rice Protein Hydrolysate
- 4.5.8. Corn Proteins
- 4.5.8.1. Corn Protein Isolate
- 4.5.8.2. Corn Protein Concentrate
- 4.5.8.3. Corn Protein Hydrolysate
- 4.5.9. Other Plant Proteins
- 4.6. Production Analysis
- 4.6.1. Overview
- 4.6.2. Soy Proteins
- 4.6.2.1. Soy Protein Concentrate
- 4.6.2.2. Soy Protein Isolate
- 4.6.2.3. Textured Soy Protein
- 4.6.2.4. Other Soy Proteins
- 4.6.3. Wheat Proteins
- 4.6.3.1. Vital Wheat Gluten
- 4.6.3.2. Wheat Protein Isolate
- 4.6.3.3. Hydrolyzed Wheat Protein
- 4.6.3.4. Textured Wheat Protein
- 4.6.4. Pea Proteins
- 4.6.4.1. Yellow Pea Proteins
- 4.6.4.1.1. Yellow Pea Protein Isolate
- 4.6.4.1.2. Yellow Pea Protein Concentrate
- 4.6.4.1.3. Textured Yellow Pea Protein
- 4.6.4.1.4. Yellow Pea Protein Hydrolysate
- 4.6.4.1.5. Yellow Pea Flour
- 4.6.4.1.6. Other Yellow Pea Proteins
- 4.6.4.2. Green Pea Proteins
- 4.6.4.2.1. Green Pea Protein Isolate
- 4.6.4.2.2. Green Pea Protein Concentrate
- 4.6.4.2.3. Textured Green Pea Protein
- 4.6.4.2.4. Green Pea Protein Hydrolysate
- 4.6.4.2.5. Green Pea Flour
- 4.6.4.2.6. Other Green Pea Proteins
- 4.6.4.1. Yellow Pea Proteins
- 4.6.5. Canola Proteins
- 4.6.5.1. Canola Protein Isolate
- 4.6.5.2. Canola Protein Concentrate
- 4.6.5.3. Other Canola Proteins
- 4.6.6. Potato Proteins
- 4.6.6.1. Potato Protein Concentrate
- 4.6.6.2. Potato Protein Isolate
- 4.6.7. Rice Proteins
- 4.6.7.1. Rice Protein Isolate
- 4.6.7.2. Rice Protein Concentrate
- 4.6.7.3. Rice Protein Hydrolysate
- 4.6.8. Corn Proteins
- 4.6.8.1. Corn Protein Isolate
- 4.6.8.2. Corn Protein Concentrate
- 4.6.8.3. Corn Protein Hydrolysate
- 4.6.9. Other Plant Proteins
- 4.7. Value Chain Analysis
5. Global Plant-Based Proteins Market Assessment-by Type
- 5.1. Overview
- 5.2. Soy Proteins
- 5.2.1. Soy Protein Concentrates
- 5.2.2. Soy Protein Isolates
- 5.2.3. Textured Soy Proteins
- 5.2.4. Other Soy Proteins
- 5.3. Wheat Proteins
- 5.3.1. Vital Wheat Gluten
- 5.3.2. Wheat Protein Isolate
- 5.3.3. Hydrolyzed Wheat Protein
- 5.3.4. Textured Wheat Protein
- 5.4. Pea Proteins
- 5.4.1. Yellow Pea Proteins
- 5.4.1.1. Yellow Pea Protein Isolate
- 5.4.1.2. Yellow Pea Protein Concentrate
- 5.4.1.3. Textured Yellow Pea Protein
- 5.4.1.4. Yellow Pea Protein Hydrolysate
- 5.4.1.5. Yellow Pea Flour
- 5.4.1.6. Other Yellow Pea Proteins
- 5.4.2. Green Pea Proteins
- 5.4.2.1. Green Pea Protein Isolate
- 5.4.2.2. Green Pea Protein Concentrate
- 5.4.2.3. Textured Green Pea Protein
- 5.4.2.4. Green Pea Protein Hydrolysate
- 5.4.2.5. Green Pea Flour
- 5.4.2.6. Other Green Pea Proteins
- 5.4.1. Yellow Pea Proteins
- 5.5. Canola Proteins
- 5.5.1. Canola Protein Isolate
- 5.5.2. Canola Protein Concentrate
- 5.5.3. Other Canola Proteins
- 5.6. Potato Proteins
- 5.6.1. Potato Protein Concentrate
- 5.6.2. Potato Protein Isolate
- 5.7. Rice Proteins
- 5.7.1. Rice Protein Isolate
- 5.7.2. Rice Protein Concentrate
- 5.7.3. Rice Protein Hydrolysate
- 5.8. Corn Proteins
- 5.8.1. Corn Protein Isolate
- 5.8.2. Corn Protein Concentrate
- 5.8.3. Corn Protein Hydrolysate
- 5.9. Other Plant-Based Proteins
6. Global Plant-Based Proteins Market Assessment-by Form
- 6.1. Overview
- 6.2. Solid (Dry)
- 6.3. Liquid
7. Global Plant-Based Proteins Market Assessment-by Source Process
- 7.1. Overview
- 7.2. Conventional Plant-Based Protein Ingredients
- 7.3. Organic Plant-Based Protein Ingredients
8. Global Plant-Based Proteins Market Assessment-by Application
- 8.1. Overview
- 8.2. Food & Beverage
- 8.2.1. Meat, Poultry, And Seafood
- 8.2.2. Bakery
- 8.2.3. Meat Analogs
- 8.2.4. Dairy Alternatives
- 8.2.5. Cereals & Snacks
- 8.2.6. Beverages
- 8.2.7. Other Food & Beverages
- 8.3. Animal Feed
- 8.4. Nutrition & Health Supplements
- 8.5. Pharmaceuticals
- 8.6. Other Applications
9. Plant-Based Proteins Market Assessment-by Geography
- 9.1. Overview
- 9.2. North America
- 9.2.1. U.S.
- 9.2.2. Canada
- 9.3. Europe
- 9.3.1. Germany
- 9.3.2. France
- 9.3.3. U.K.
- 9.3.4. Italy
- 9.3.5. Spain
- 9.3.6. Rest of Europe (RoE)
- 9.4. Asia-Pacific
- 9.4.1. China
- 9.4.2. India
- 9.4.3. Japan
- 9.4.4. Australia
- 9.4.5. Rest of Asia-Pacific (RoAPAC)
- 9.5. Latin America
- 9.5.1. Brazil
- 9.5.2. Mexico
- 9.5.3. Argentina
- 9.5.4. Rest of Latin America (RoLATAM)
- 9.6. Middle East & Africa
10. Competitive Landscape
- 10.1. Overview
- 10.2. Key Growth Strategies
- 10.3. Competitive Benchmarking
- 10.4. Competitive Dashboard
- 10.4.1. Industry Leaders
- 10.4.2. Market Differentiators
- 10.4.3. Vanguards
- 10.4.4. Emerging Companies
- 10.5. Global Plant-Based Proteins Market: Company Market Position Analysis
11. Company Profiles
- 11.1. Archer Daniels Midland Company
- 11.2. Cargill, Incorporated
- 11.3. Roquette Freres
- 11.4. Ingredion Incorporated
- 11.5. Kerry Group plc
- 11.6. International Flavors & Fragrances, Inc. (IFF)
- 11.7. Now Health Group, Inc.
- 11.8. Tate & Lyle PLC
- 11.9. Axiom Foods Inc.
- 11.10. Amco Proteins
- 11.11. Burcon Nutrascience Corporation
- 11.12. Beneo Gmbh (A Part of Sudzucker AG)
- 11.13. Glico Nutrition Co., Ltd.
- 11.14. Glanbia Plc
- 11.15. Cosucragroupe Warcoing SA
- 11.16. Sotexpro Sa (Part of GEMEF Industries)
- 11.17. Farbest-Tallman Foods Corporation
- 11.18. Crespel & Deiters GmbH & Co. KG
- 11.19. Wilmar International Limited
- 11.20. CHS Inc.
12. Appendix
- 12.1. Available Customization
- 12.2. Related Reports

