|
|
市場調査レポート
商品コード
1386909
地域熱供給の世界市場:熱源別、プラントタイプ別、用途別、地域別-2028年までの予測District Heating Market by Heat Source (Coal, Natural Gas, Geothermal, Biomass & Biofuel, Solar, Oil & Petroleum Products), Component (Boiler, Heat Exchanger, Heat Pumps), Plant Type (CHP, Boiler), Application and Region - Global Forecast to 2028 |
||||||
|
|
|||||||
カスタマイズ可能
|
|||||||


| 地域熱供給の世界市場:熱源別、プラントタイプ別、用途別、地域別-2028年までの予測 |
|
出版日: 2023年11月20日
発行: MarketsandMarkets
ページ情報: 英文 222 Pages
納期: 即納可能
|

- 全表示
- 概要
- 目次
| 調査範囲 | |
|---|---|
| 調査対象年 | 2023年~2028年 |
| 基準年 | 2022年 |
| 予測期間 | 2023年~2028年 |
| 検討単位 | 金額(10億米ドル) |
| セグメント別 | 熱源別、プラントタイプ別、用途別 |
| 対象地域 | 南北アメリカ、欧州、アジア太平洋 |
世界の地域熱供給の市場規模は、2023年に1,915億米ドルと予測され、2028年には2,421億米ドルに達すると予測されています。
同市場は、2023年~2028年にかけて、4.8%のCAGRで拡大すると見込まれています。都市化と工業化の動向の高まりは、特に人口密度の高い都市中心部や工業拠点において、さまざまな分野でのエネルギー需要の増加を促しています。地域熱供給システムは、暖房を必要とする建物が集中し、産業運営における熱需要が大きいという特徴を持つこれらの地域に適したソリューションとして浮上しています。この集中型アプローチは、信頼できる暖房サービスを保証するだけでなく、公害やエネルギー消費全体の削減にも大きく貢献します。都市化は顕著な世界的メガトレンドとして際立っており、進行中の都市開発によって地域熱供給の需要が高まっています。農村部から都市部への人口シフトは、公共支出の顕著な増加をもたらしました。この人口動態の変化が、暖房需要の一貫した増加に拍車をかけ、地域熱供給部門への大規模な投資を促しています。都市部の成長は組織的なインフラ整備を促進し、地域熱供給ソリューションの導入に適した環境を作り出しています。
地域熱供給市場における再生可能エネルギー分野は、地熱、バイオマス&バイオ燃料、太陽光や風力などの熱源を含み、持続可能で環境に優しいエネルギーソリューションに対する世界の重点の高まりにより、CAGRが最も高くなっています。気候変動に対する懸念が強まるにつれ、再生可能エネルギーが環境にもたらす利点に対する認識が高まっています。世界中の政府や産業界は、自然の力を利用する技術への投資を増やし、地域熱供給システムへの再生可能エネルギーの統合を推進しています。二酸化炭素排出量の削減、エネルギー安全保障の強化、信頼性の高い安定した熱供給など、再生可能エネルギー固有の利点が、この分野の急成長を後押ししています。さらに、再生可能エネルギー技術の進歩は、支援政策やインセンティブと相まって、地域熱供給市場内の再生可能エネルギーセグメントで観察された収益の成長にさらに貢献しています。
ボイラープラントは、コスト効率が高く効率的な熱生成を提供するために広く採用され汎用性があるため、地域熱供給市場におけるプラントタイプ別シェアで2位を確保しています。ボイラーは、化石燃料やバイオマスを含む様々な熱源を利用できる、確立され理解された技術です。その適応性により、地域熱供給システムにおける多様な用途に適しており、さまざまな運転規模に対応しています。ボイラープラントは、信頼性が高く制御可能な熱生産手段を提供し、住宅と産業両方の消費者の需要を満たします。ボイラープラントの身近さ、手頃な価格、実証された性能は、世界的に地域熱供給ソリューションの優先的な選択肢となり、その顕著な市場地位の一因となっています。
欧州は、主に歴史的なインフラ整備、厳しい環境規制、持続可能なエネルギー慣行へのコミットメントの組み合わせにより、地域別地域熱供給市場を独占し、最大のシェアを主張しています。欧州の多くの国々には、数十年前から地域熱供給システムを導入してきた伝統があり、これが地域熱供給の普及に向けた強固な基盤となっています。加えて、この地域の気候変動対策への積極的な取り組みが、よりクリーンで効率的な暖房ソリューションへのシフトを後押ししています。厳しい排出基準と野心的な再生可能エネルギー目標が、再生可能な熱源と廃熱源を組み合わせて利用する地域熱供給ネットワークの拡大と近代化を後押ししています。欧州地域は、二酸化炭素排出量の削減とエネルギー効率の向上に取り組んでおり、確立された地域熱供給インフラと相まって、世界市場のリーダーとしての地位を確立しています。
当レポートでは、世界の地域熱供給市場について調査し、熱源別、プラントタイプ別、用途別、地域別動向、および市場に参入する企業のプロファイルなどをまとめています。
目次
第1章 イントロダクション
第2章 調査手法
第3章 エグゼクティブサマリー
第4章 重要考察
第5章 市場概要
- イントロダクション
- 市場力学
- バリューチェーン分析
- エコシステム分析
- 顧客のビジネスに影響を与える動向/混乱
- 価格分析
- 技術分析
- ポーターのファイブフォース分析
- 主要な利害関係者と購入基準
- 地域熱供給への主な投資
- ケーススタディ分析
- 貿易分析
- 特許分析、2020年~2023年
- 2024~2025年の主要な会議とイベント
- 規制状況と基準
第6章 地域熱供給製品のコンポーネント
- イントロダクション
- ボイラー
- 断熱パイプライン
- ヒートポンプ
- 熱交換器
- ヒートメーター
第7章 地域熱供給市場、熱源別
- イントロダクション
- 石炭
- 天然ガス
- 再生可能エネルギー
- 石油および石油製品
- その他
第8章 地域熱供給市場、プラントタイプ別
- イントロダクション
- ボイラープラント
- 熱電併給プラント
- その他
第9章 地域熱供給市場、用途別
- イントロダクション
- 住宅
- 商業
- 産業
第10章 地域熱供給市場、地域別
- イントロダクション
- 米国
- 欧州
- アジア太平洋
第11章 競合情勢
- 概要
- 主要参入企業が採用した戦略
- 市場シェア分析、2022年
- 収益分析、2018~2022年
- 企業評価マトリックス、2022年
- スタートアップ/中小企業(SMES)の評価マトリックス、2022年
- 競争シナリオと動向
第12章 企業プロファイル
- 主要参入企業
- FORTUM
- VATTENFALL
- ENGIE
- DANFOSS
- STATKRAFT
- LOGSTOR DENMARK HOLDING APS
- VITAL ENERGI
- KELAG ENERGIE & WARME
- SHINRYO CORPORATION
- VEOLIA
- GENERAL ELECTRIC
- UNIPER SE
- その他の企業
- GOTEBORG ENERGI
- FVB ENERGY INC.
- ALFA LAVAL
- RAMBOLL
- SAVON VOIMA
- ENWAVE ENERGY CORPORATION
- ?RSTED A/S
- HELEN LTD
- KEPPEL CORPORATION LIMITED
- STEAG GMBH
- HAFSLUND AS
- CLEARWAY ENERGY GROUP LLC
- DALL ENERGY
第13章 付録
Report Description
| Scope of the Report | |
|---|---|
| Years Considered for the Study | 2023-2028 |
| Base Year | 2022 |
| Forecast Period | 2023-2028 |
| Units Considered | Value (USD Billion) |
| Segments | By Heat Source, By Plant Type, By Application |
| Regions covered | Americas, Europe, APAC |
The global district heating market is expected to be valued at USD 191.5 billion in 2023 and is projected to reach USD 242.1 billion by 2028; it is expected to grow at a CAGR of 4.8% from 2023 to 2028. The increasing trends of urbanization and industrialization are propelling an increased need for energy across various sectors, particularly in densely populated urban centers and industrial hubs. District heating systems emerge as a fitting solution for these areas, characterized by a concentration of buildings requiring heating and a substantial demand for heat in industrial operations. This centralized approach not only ensures dependable heating services but also contributes significantly to the reduction of pollution and overall energy consumption. Urbanization stands out as a prominent global megatrend, with ongoing urban development driving a heightened demand for district heating. The shift in population from rural to urban areas has resulted in a notable increase in public expenditures. This demographic shift has, in turn, spurred a consistent rise in the demand for heating, prompting substantial investments in the district heating sector. The growth of urban areas facilitates organized infrastructure development, creating a conducive environment for the implementation of district heating solutions.
"Renewables heat sources are growing at highest CAGR in district heating market"
The renewables segment in the district heating market, encompassing sources such as geothermal, biomass & biofuel, and others like solar and wind, is experiencing the highest CAGR due to an escalating global emphasis on sustainable and eco-friendly energy solutions. As concerns about climate change intensify, there is a growing recognition of the environmental benefits offered by renewable energy sources. Governments and industries worldwide are increasingly investing in technologies that harness the power of nature, promoting the integration of renewable energy into district heating systems. The inherent advantages of renewables, including their ability to reduce carbon emissions, enhance energy security, and provide a reliable and consistent heat supply, are driving this segment's rapid growth. Additionally, advancements in renewable energy technologies, coupled with supportive policies and incentives, further contribute to the revenue growth observed in the renewables segment within the district heating market.
"Boiler plants accounts for second-largest share in district heating market"
Boiler plants secure the second-largest share in the district heating market by plant type due to their widespread adoption and versatility in providing cost-effective and efficient heat generation. Boilers are established and well-understood technologies with the capability to use various heat sources, including fossil fuels and biomass. Their adaptability makes them suitable for diverse applications in district heating systems, accommodating different scales of operation. Boiler plants offer a reliable and controllable means of producing heat, meeting the demands of both residential and industrial consumers. The familiarity, affordability, and proven performance of boiler plants contribute to their prominent market position, making them a preferred choice for district heating solutions globally.
"Europe holds largest market share in district heating market."
Europe dominates the district heating market by region, claiming the largest share, primarily due to a combination of historical infrastructure development, stringent environmental regulations, and a commitment to sustainable energy practices. Many European countries have a long-standing tradition of district heating systems, dating back decades, which has laid a robust foundation for their widespread adoption. Additionally, the region's proactive approach to combatting climate change has driven a shift towards cleaner and more efficient heating solutions. Stringent emissions standards and ambitious renewable energy targets have incentivized the expansion and modernization of district heating networks, utilizing a mix of renewable and waste heat sources. The European region's commitment to reducing carbon emissions and enhancing energy efficiency, coupled with a well-established district heating infrastructure, positions it as a leader in the global market.
The study contains insights from various industry experts, ranging from component suppliers to Tier 1 companies and OEMs. The break-up of the primaries is as follows:
- By Company Type: Tier 1 - 10%, Tier 2 - 20%, and Tier 3 - 70%
- By Designation: C-level Executives - 40%, Directors - 30%, and Others - 30%
- By Region: Americas - 40%, Europe - 40%, Asia Pacific - 20%
The key players operating in the district heating market are Fortum (Finland), Vattenfall (Sweden), ENGIE (France), Danfoss (Denmark), Statkraft (Norway) among others.
Research Coverage:
The research reports the District Heating Market, By Heat Source (Coal, Natural Gas, Renewables (Geothermal, Biomass & Biofuel, and Others), Oil & Petroleum Products, Others), By Plant Type (Boiler Plants, Combined Heat and Power, and Others), Application (Residential, Commercial, and Industrial), and Region (Americas, Europe, and Asia Pacific). The scope of the report covers detailed information regarding the major factors, such as drivers, restraints, challenges, and opportunities, influencing the growth of the district heating market. A detailed analysis of the key industry players has been done to provide insights into their business overviews, products, key strategies, Contracts, partnerships, and agreements. New product & service launches, mergers and acquisitions, and recent developments associated with the district heating market. Competitive analysis of upcoming startups in the district heating market ecosystem is covered in this report.
Key Benefits of Buying the Report
- Analysis of key drivers (Rising focus on energy-efficient and cost-effective heating systems
- Rapid growth in urbanization and industrialization propelling demand for sustainable heating services, Increasing shift towards renewable sources in district heating, Lower operating costs as compared with in-building heating systems, Increasing policy initiatives by governments and associations, Carbon tax and emissions reduction driving adoption of district heating solutions), restraints (High investment costs of district heating infrastructure, Unsuitability of large district heating network for small heat loads, and Regulatory and permitting hurdles), opportunities (Increasing focus on waste heat recovery for district heating, Rising number of initiatives related to clean energy production, Integration of multiple energy sources in heat generation, and Digitalization in district heating networks), and challenges (Necessity of robust transportation infrastructure and equipment, Load prediction and better utilization challenges of heating systems, and Limited availability of district heating networks in waste heat recovery) influencing the growth of the district heating market.
- Product Development/Innovation: Detailed insights on upcoming technologies, research & development activities, and new product launches in the district heating market
- Market Development: Comprehensive information about lucrative markets - the report analyses the district heating market across varied regions.
- Market Diversification: Exhaustive information about new products/services, untapped geographies, recent developments, and investments in the district heating market
- Competitive Assessment: In-depth assessment of market shares, growth strategies, and service offerings of leading players like Fortum (Finland), Vattenfall (Sweden), ENGIE (France), Danfoss (Denmark), Statkraft (Norway), among others in the district heating market.
TABLE OF CONTENTS
1 INTRODUCTION
- 1.1 STUDY OBJECTIVES
- 1.2 MARKET DEFINITION
- 1.2.1 INCLUSIONS AND EXCLUSIONS
- 1.3 STUDY SCOPE
- 1.3.1 MARKETS COVERED
- FIGURE 1 DISTRICT HEATING MARKET: SEGMENTATION
- 1.3.2 REGIONAL SCOPE
- 1.3.3 YEARS CONSIDERED
- 1.4 CURRENCY CONSIDERED
- 1.5 LIMITATIONS
- 1.6 UNIT CONSIDERED
- 1.7 STAKEHOLDERS
- 1.8 SUMMARY OF CHANGES
- 1.8.1 RECESSION IMPACT
2 RESEARCH METHODOLOGY
- 2.1 RESEARCH APPROACH
- FIGURE 2 DISTRICT HEATING MARKET: RESEARCH DESIGN
- 2.1.1 SECONDARY AND PRIMARY RESEARCH
- 2.1.2 SECONDARY DATA
- 2.1.2.1 List of major secondary sources
- 2.1.2.2 Key data from secondary sources
- 2.1.3 PRIMARY DATA
- 2.1.3.1 List of key interview participants
- 2.1.3.2 Breakdown of primaries
- 2.1.3.3 Key data from primary sources
- 2.1.3.4 Key industry insights
- 2.2 MARKET SIZE ESTIMATION
- FIGURE 3 PROCESS FLOW OF MARKET SIZE ESTIMATION
- 2.2.1 BOTTOM-UP APPROACH
- 2.2.1.1 Approach to derive market size using bottom-up analysis (demand side)
- FIGURE 4 DISTRICT HEATING MARKET: BOTTOM-UP APPROACH
- 2.2.2 TOP-DOWN APPROACH
- 2.2.2.1 Approach to derive market size using top-down analysis (supply side)
- FIGURE 5 DISTRICT HEATING MARKET: TOP-DOWN APPROACH
- 2.2.3 SUPPLY-SIDE ANALYSIS
- FIGURE 6 MARKET SIZE ESTIMATION METHODOLOGY (SUPPLY-SIDE ANALYSIS): REVENUES GENERATED BY COMPANIES FROM SALES OF DISTRICT HEATING SYSTEMS
- 2.3 DATA TRIANGULATION
- FIGURE 7 DATA TRIANGULATION
- 2.4 RESEARCH ASSUMPTIONS
- 2.5 RESEARCH LIMITATIONS
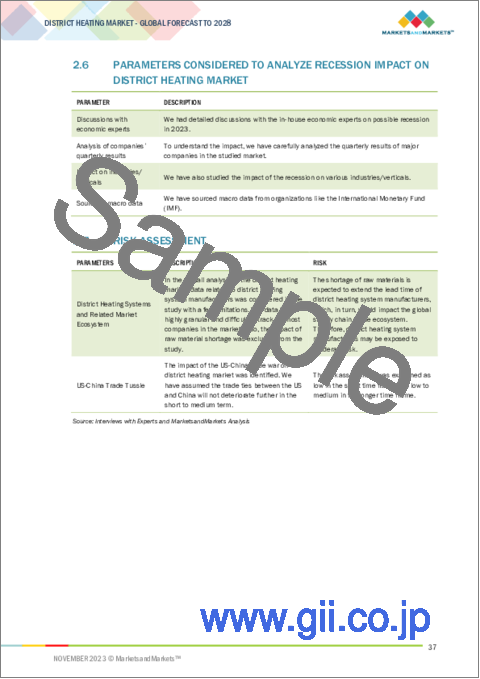
- 2.6 PARAMETERS CONSIDERED TO ANALYZE RECESSION IMPACT ON DISTRICT HEATING MARKET
- 2.7 RISK ASSESSMENT
3 EXECUTIVE SUMMARY
- FIGURE 8 RENEWABLE HEAT SOURCES TO WITNESS HIGHEST CAGR DURING FORECAST PERIOD
- FIGURE 9 COMBINED AND HEAT POWER PLANTS TO HOLD LARGEST MARKET SHARE IN 2028
- FIGURE 10 RESIDENTIAL APPLICATION IN DISTRICT HEATING MARKET TO WITNESS HIGHEST CAGR DURING FORECAST PERIOD
- FIGURE 11 EUROPE TO HOLD LARGEST MARKET SHARE IN GLOBAL DISTRICT HEATING MARKET THROUGHOUT FORECAST PERIOD
4 PREMIUM INSIGHTS
- 4.1 ATTRACTIVE GROWTH OPPORTUNITIES FOR PLAYERS IN DISTRICT HEATING MARKET
- FIGURE 12 RAPID URBANIZATION AND INDUSTRIALIZATION TO PROPEL DEMAND FOR SUSTAINABLE HEATING SERVICES
- 4.2 DISTRICT HEATING MARKET, BY PLANT TYPE
- FIGURE 13 COMBINED HEAT AND POWER PLANT SEGMENT TO HOLD LARGEST MARKET SHARE FROM 2023 TO 2028
- 4.3 DISTRICT HEATING MARKET, BY APPLICATION
- FIGURE 14 RESIDENTIAL APPLICATION TO DOMINATE MARKET THROUGHOUT FORECAST PERIOD
- 4.4 DISTRICT HEATING MARKET IN EUROPE, BY INDUSTRY AND COUNTRY
- FIGURE 15 RESIDENTIAL SEGMENT AND GERMANY HELD LARGEST SHARES OF EUROPEAN DISTRICT HEATING MARKET IN 2022
- 4.5 DISTRICT HEATING MARKET, BY COUNTRY
- FIGURE 16 CHINA TO RECORD HIGHEST CAGR IN GLOBAL DISTRICT HEATING MARKET DURING FORECAST PERIOD
5 MARKET OVERVIEW
- 5.1 INTRODUCTION
- 5.2 MARKET DYNAMICS
- FIGURE 17 DISTRICT HEATING MARKET: DRIVERS, RESTRAINTS, OPPORTUNITIES, AND CHALLENGES
- 5.2.1 DRIVERS
- FIGURE 18 DISTRICT HEATING MARKET: IMPACT ANALYSIS OF DRIVERS
- 5.2.1.1 High demand for energy-efficient and cost-effective heating systems
- 5.2.1.2 Rapid urbanization and industrialization
- 5.2.1.3 Increased use of renewable sources to run district heating systems
- 5.2.1.4 Relatively low operating costs of district heating systems than in-building heating systems
- 5.2.1.5 Government-led incentives and subsidies offered for low-carbon technology-based products
- 5.2.1.6 Enforcement of carbon tax on fossil fuel-powered heating solutions
- 5.2.2 RESTRAINTS
- FIGURE 19 DISTRICT HEATING MARKET: IMPACT ANALYSIS OF RESTRAINTS
- 5.2.2.1 Need for high initial investment
- 5.2.2.2 Barriers to district heating network deployment in small-scale projects
- 5.2.2.3 Time-consuming and complex regulatory approval processes
- 5.2.3 OPPORTUNITIES
- FIGURE 20 DISTRICT HEATING MARKET: IMPACT ANALYSIS OF OPPORTUNITIES
- 5.2.3.1 Increasing focus on waste heat recovery for district heating
- 5.2.3.2 Enforcement of policies boosting renewable energy production
- 5.2.3.3 Integration of multiple energy sources in heat generation
- 5.2.3.4 Utilization of digital technology in district heating networks
- 5.2.4 CHALLENGES
- FIGURE 21 DISTRICT HEATING MARKET: IMPACT ANALYSIS OF CHALLENGES
- 5.2.4.1 Requirement for smart meters to prevent heat loss during heat distribution process
- 5.2.4.2 Need for precise load planning and better utilization of heating systems
- 5.2.4.3 Limited number of district heating networks to harness waste heat
- 5.3 VALUE CHAIN ANALYSIS
- FIGURE 22 DISTRICT HEATING MARKET: VALUE CHAIN ANALYSIS
- 5.4 ECOSYSTEM ANALYSIS
- FIGURE 23 ECOSYSTEM ANALYSIS
- TABLE 1 COMPANIES AND THEIR ROLES IN DISTRICT HEATING ECOSYSTEM
- 5.5 TRENDS/DISRUPTIONS IMPACTING CUSTOMERS' BUSINESSES
- FIGURE 24 TRENDS/DISRUPTIONS IMPACTING CUSTOMERS' BUSINESSES
- 5.6 PRICING ANALYSIS
- 5.6.1 AVERAGE SELLING PRICE (ASP) TREND OF DISTRICT HEATING SYSTEMS OFFERED BY TOP THREE KEY PLAYERS
- FIGURE 25 AVERAGE SELLING PRICE (ASP) TREND OF DISTRICT HEATING SYSTEMS OFFERED BY TOP THREE KEY PLAYERS
- TABLE 2 AVERAGE SELLING PRICE (ASP) TREND OF DISTRICT HEATING PRODUCTS OFFERED BY KEY PLAYERS (USD/MWH)
- 5.6.2 AVERAGE SELLING PRICE (ASP) TREND OF DISTRICT HEATING PRODUCTS, BY APPLICATION
- FIGURE 26 AVERAGE SELLING PRICE (ASP) TREND OF DISTRICT HEATING PRODUCTS, BY APPLICATION (USD/MWH)
- 5.6.3 AVERAGE SELLING PRICE (ASP) TREND OF DISTRICT HEATING PRODUCTS, BY REGION
- FIGURE 27 AVERAGE SELLING PRICE (ASP) TREND OF DISTRICT HEATING PRODUCTS, BY REGION (USD/MWH)
- 5.7 TECHNOLOGY ANALYSIS
- 5.7.1 USE OF BIOFUELS FOR DISTRICT HEATING
- 5.7.2 GEOTHERMAL ENERGY IN DISTRICT HEATING
- 5.7.3 USAGE OF WASTE HEAT FROM HYDROGEN PRODUCTION
- 5.7.4 FIFTH-GENERATION DISTRICT HEATING
- 5.7.5 USE OF NUCLEAR ENERGY FOR DISTRICT HEATING
- 5.7.6 SMART DISTRICT HEATING
- 5.7.7 CARBON CAPTURE AND UTILIZATION (CCU)
- 5.8 PORTER'S FIVE FORCES ANALYSIS
- TABLE 3 DISTRICT HEATING MARKET: PORTER'S FIVE FORCES ANALYSIS
- FIGURE 28 PORTER'S FIVE FORCES ANALYSIS
- 5.8.1 THREAT OF NEW ENTRANTS
- 5.8.2 THREAT OF SUBSTITUTES
- 5.8.3 BARGAINING POWER OF SUPPLIERS
- 5.8.4 BARGAINING POWER OF BUYERS
- 5.8.5 INTENSITY OF COMPETITIVE RIVALRY
- 5.9 KEY STAKEHOLDERS AND BUYING CRITERIA
- 5.9.1 KEY STAKEHOLDERS IN BUYING PROCESS
- FIGURE 29 KEY STAKEHOLDERS IN BUYING PROCESS FOR TOP THREE APPLICATIONS
- TABLE 4 INFLUENCE OF STAKEHOLDERS ON BUYING PROCESS FOR TOP THREE APPLICATIONS
- 5.9.2 BUYING CRITERIA
- FIGURE 30 KEY BUYING CRITERIA FOR TOP THREE APPLICATION
- TABLE 5 KEY BUYING CRITERIA FOR TOP THREE APPLICATIONS
- 5.10 KEY INVESTMENTS IN DISTRICT HEATING
- 5.11 CASE STUDY ANALYSIS
- 5.11.1 FORTUM PARTNERS WITH MICROSOFT TO ACHIEVE CARBON-NEUTRAL HEATING USING DATA CENTER WASTE HEAT RECOVERY
- 5.11.2 DANFOSS CONSTRUCTS DISTRICT HEATING SYSTEMS AT TEKNOPARK, ISTANBUL, TO ADDRESS COMPLEX REQUIREMENTS OF PROJECT
- 5.11.3 FYN CONSULTS RAMBOLI TO DEVELOP HEAT PUMP SYSTEM THAT TRANSFERS SURPLUS ENERGY FROM FACEBOOK DATA CENTER TO DISTRICT HEATING NETWORK OF ODENSE
- 5.11.4 VITAL ENERGI PROVIDES LOW-CARBON AND HOT WATER TO CAMDEN LOCKS VIA BURIED DISTRICT HEATING AND COOLING NETWORK
- 5.12 TRADE ANALYSIS
- 5.12.1 IMPORT SCENARIO
- TABLE 6 IMPORT DATA FOR HS CODE 841861-COMPLIANT PRODUCTS, BY COUNTRY, 2018-2022 (USD MILLION)
- 5.12.2 EXPORT SCENARIO
- TABLE 7 EXPORT DATA FOR HS CODE 841861-COMPLIANT PRODUCTS, BY COUNTRY, 2018-2022 (USD MILLION)
- 5.12.3 TARIFFS
- TABLE 8 MFN TARIFF FOR HS CODE 841861-COMPLIANT PRODUCTS EXPORTED BY CHINA
- TABLE 9 MFN TARIFF FOR HS CODE 841861-COMPLIANT PRODUCTS EXPORTED BY FRANCE
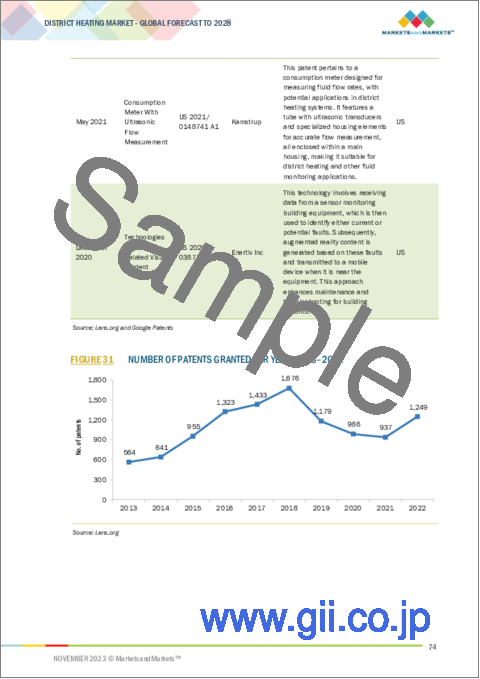
- 5.13 PATENT ANALYSIS, 2020-2023
- TABLE 10 DISTRICT HEATING MARKET: LIST OF PATENTS, 2020-2023
- FIGURE 31 NUMBER OF PATENTS GRANTED PER YEAR, 2013-2022
- TABLE 11 NUMBER OF PATENTS REGISTERED IN LAST 10 YEARS
- FIGURE 32 TOP 10 COMPANIES WITH HIGHEST NUMBER OF PATENT APPLICATIONS IN LAST 10 YEARS
- 5.14 KEY CONFERENCES AND EVENTS, 2024-2025
- TABLE 12 DISTRICT HEATING MARKET: LIST OF CONFERENCES AND EVENTS
- 5.15 REGULATORY LANDSCAPE AND STANDARDS
- 5.15.1 REGULATORY BODIES, GOVERNMENT AGENCIES, AND OTHER ORGANIZATIONS
- TABLE 13 AMERICAS: LIST OF REGULATORY BODIES, GOVERNMENT AGENCIES, AND OTHER ORGANIZATIONS
- TABLE 14 EUROPE: LIST OF REGULATORY BODIES, GOVERNMENT AGENCIES, AND OTHER ORGANIZATIONS
- TABLE 15 ASIA PACIFIC: LIST OF REGULATORY BODIES, GOVERNMENT AGENCIES, AND OTHER ORGANIZATIONS
- 5.15.2 STANDARDS AND REGULATIONS
- 5.15.2.1 Standards
- 5.15.2.2 Regulations
6 COMPONENTS OF DISTRICT HEATING PRODUCTS
- 6.1 INTRODUCTION
- 6.2 BOILERS
- 6.2.1 ABILITY TO CONVERT HEAT SOURCES INTO USABLE THERMAL ENERGY TO BOOST DEMAND
- 6.3 INSULATED PIPELINES
- 6.3.1 REDUCED ENERGY WASTAGE AND MINIMIZED HEAT LOSSES DURING TRANSIT TO FUEL MARKET GROWTH
- 6.4 HEAT PUMPS
- 6.4.1 ABILITY TO UTILIZE LOW-GRADE HEAT SOURCES TO DRIVE DEMAND
- 6.4.2 AIR-TO-AIR HEAT PUMPS
- 6.4.2.1 Potential energy-efficient alternative to traditional heating systems to accelerate demand
- 6.4.3 AIR-TO-WATER HEAT PUMPS
- 6.4.3.1 Ability to exhibit high performance in cold climates to support market growth
- 6.4.4 WATER SOURCE HEAT PUMPS
- 6.4.4.1 Significant contribution to reduced energy consumption and environmental impact to drive market
- 6.4.5 GEOTHERMAL HEAT PUMPS
- 6.4.5.1 Ongoing advancements in geothermal heat pump technology to boost demand
- 6.4.6 HYBRID HEAT PUMPS
- 6.4.6.1 Enhanced system resilience and optimized energy utilization to drive market
- 6.5 HEAT EXCHANGERS
- 6.5.1 OPTIMIZED ENERGY EXCHANGE PROCESS AND ENHANCED OVERALL SYSTEM PERFORMANCE TO FOSTER SEGMENTAL GROWTH
- 6.6 HEAT METERS
- 6.6.1 ADOPTION OF SMART METERING TECHNOLOGIES TO OFFER LUCRATIVE GROWTH OPPORTUNITIES TO PLAYERS
7 DISTRICT HEATING MARKET, BY HEAT SOURCE
- 7.1 INTRODUCTION
- FIGURE 33 RENEWABLES SEGMENT TO DISPLAY HIGHEST CAGR DURING FORECAST PERIOD
- TABLE 16 DISTRICT HEATING MARKET, BY HEAT SOURCE, 2019-2022 (USD BILLION)
- TABLE 17 DISTRICT HEATING MARKET, BY HEAT SOURCE, 2023-2028 (USD BILLION)
- 7.2 COAL
- 7.2.1 GROWING ADOPTION OF CLEAN COAL TECHNOLOGIES TO MITIGATE ENVIRONMENTAL IMPACT TO BOOST DEMAND
- TABLE 18 COAL: DISTRICT HEATING MARKET, BY REGION, 2019-2022 (USD BILLION)
- TABLE 19 COAL: DISTRICT HEATING MARKET, BY REGION, 2023-2028 (USD BILLION)
- 7.3 NATURAL GAS
- 7.3.1 RISING INVESTMENTS IN NATURAL GAS INFRASTRUCTURE DEVELOPMENT TO DRIVE MARKET
- TABLE 20 NATURAL GAS: DISTRICT HEATING MARKET, BY REGION, 2019-2022 (USD BILLION)
- TABLE 21 NATURAL GAS: DISTRICT HEATING MARKET, BY REGION, 2023-2028 (USD BILLION)
- 7.4 RENEWABLES
- 7.4.1 GOVERNMENT INCENTIVES TO PROMOTE RENEWABLE ENERGY SOURCES TO BOOST DEMAND
- TABLE 22 RENEWABLES: DISTRICT HEATING MARKET, BY ENERGY TYPE, 2019-2022 (USD BILLION)
- TABLE 23 RENEWABLES: DISTRICT HEATING MARKET, BY ENERGY TYPE, 2023-2028 (USD BILLION)
- TABLE 24 RENEWABLES: DISTRICT HEATING MARKET, BY REGION, 2019-2022 (USD BILLION)
- TABLE 25 RENEWABLES: DISTRICT HEATING MARKET, BY REGION, 2023-2028 (USD BILLION)
- 7.4.2 GEOTHERMAL
- 7.4.2.1 Increased exploration of geothermal resources for power generation to fuel demand
- 7.4.3 BIOMASS AND BIOFUEL
- 7.4.3.1 Increasing shift toward waste reduction and renewable energy production to drive segmental growth
- 7.4.4 OTHER ENERGY TYPES
- 7.5 OIL AND PETROLEUM PRODUCTS
- 7.5.1 REGIONS WITH LIMITED RENEWABLE ENERGY SOURCES TO GENERATE SIGNIFICANT DEMAND
- TABLE 26 OIL AND PETROLEUM PRODUCTS: DISTRICT HEATING MARKET, BY REGION, 2019-2022 (USD BILLION)
- TABLE 27 OIL AND PETROLEUM PRODUCTS: DISTRICT HEATING MARKET, BY REGION, 2023-2028 (USD BILLION)
- 7.6 OTHER HEAT SOURCES
- TABLE 28 OTHER HEAT SOURCES: DISTRICT HEATING MARKET, BY REGION, 2019-2022 (USD BILLION)
- TABLE 29 OTHER HEAT SOURCES: DISTRICT HEATING MARKET, BY REGION, 2023-2028 (USD BILLION)
8 DISTRICT HEATING MARKET, BY PLANT TYPE
- 8.1 INTRODUCTION
- FIGURE 34 COMBINED HEAT AND POWER PLANTS TO EXHIBIT HIGHEST CAGR DURING FORECAST PERIOD
- TABLE 30 DISTRICT HEATING MARKET, BY PLANT TYPE, 2019-2022 (USD BILLION)
- TABLE 31 DISTRICT HEATING MARKET, BY PLANT TYPE, 2023-2028 (USD BILLION)
- 8.2 BOILER PLANTS
- 8.2.1 INTEGRATION OF CLEANER FUELS WITH BOILERS TO FOSTER SEGMENTAL GROWTH
- TABLE 32 BOILER PLANTS: DISTRICT HEATING MARKET, BY REGION, 2019-2022 (USD BILLION)
- TABLE 33 BOILER PLANTS: DISTRICT HEATING MARKET, BY REGION, 2023-2028 (USD BILLION)
- 8.3 COMBINED HEAT AND POWER PLANTS
- 8.3.1 ABILITY TO GENERATE ELECTRICITY AND THERMAL ENERGY FROM SINGLE SOURCE TO DRIVE MARKET
- TABLE 34 COMBINED HEAT AND POWER PLANTS: DISTRICT HEATING MARKET, BY REGION, 2019-2022 (USD BILLION)
- TABLE 35 COMBINED HEAT AND POWER PLANTS: DISTRICT HEATING MARKET, BY REGION, 2023-2028 (USD BILLION)
- 8.4 OTHER PLANT TYPES
- TABLE 36 OTHER PLANT TYPES: DISTRICT HEATING MARKET, BY REGION, 2019-2022 (USD BILLION)
- TABLE 37 OTHER PLANT TYPES: DISTRICT HEATING MARKET, BY REGION, 2023-2028 (USD BILLION)
9 DISTRICT HEATING MARKET, BY APPLICATION
- 9.1 INTRODUCTION
- FIGURE 35 RESIDENTIAL SEGMENT TO DOMINATE MARKET THROUGHOUT FORECAST PERIOD
- TABLE 38 DISTRICT HEATING MARKET, BY APPLICATION, 2019-2022 (USD BILLION)
- TABLE 39 DISTRICT HEATING MARKET, BY APPLICATION, 2023-2028 (USD BILLION)
- 9.2 RESIDENTIAL
- 9.2.1 INCREASING BUILDING RETROFITTING FOR EFFECTIVE UTILIZATION OF ENERGY TO BOOST DEMAND
- TABLE 40 RESIDENTIAL: DISTRICT HEATING MARKET, BY REGION, 2019-2022 (USD BILLION)
- TABLE 41 RESIDENTIAL: DISTRICT HEATING MARKET, BY REGION, 2023-2028 (USD BILLION)
- 9.3 COMMERCIAL
- 9.3.1 GROWING ADOPTION OF GREEN BUILDING PRACTICES IN COMMERCIAL SECTOR TO FOSTER SEGMENTAL GROWTH
- TABLE 42 COMMERCIAL: DISTRICT HEATING MARKET, BY REGION, 2019-2022 (USD BILLION)
- TABLE 43 COMMERCIAL: DISTRICT HEATING MARKET, BY REGION, 2023-2028 (USD BILLION)
- 9.4 INDUSTRIAL
- 9.4.1 REDUCED OPERATIONAL COSTS WITH BETTER ROI TO ATTRACT MAJOR PLAYERS
- TABLE 44 RESIDENTIAL: DISTRICT HEATING MARKET, BY REGION, 2019-2022 (USD BILLION)
- TABLE 45 RESIDENTIAL: DISTRICT HEATING MARKET, BY REGION, 2023-2028 (USD BILLION)
10 DISTRICT HEATING MARKET, BY REGION
- 10.1 INTRODUCTION
- FIGURE 36 ASIA PACIFIC TO RECORD HIGHEST CAGR DURING FORECAST PERIOD
- TABLE 46 DISTRICT HEATING MARKET, BY REGION, 2019-2022 (USD BILLION)
- TABLE 47 DISTRICT HEATING MARKET, BY REGION, 2023-2028 (USD BILLION)
- 10.2 AMERICAS
- FIGURE 37 AMERICAS: DISTRICT HEATING MARKET SNAPSHOT
- TABLE 48 AMERICAS: DISTRICT HEATING MARKET, BY GEOGRAPHY, 2019-2022 (USD BILLION)
- TABLE 49 AMERICAS: DISTRICT HEATING MARKET, BY GEOGRAPHY, 2023-2028 (USD BILLION)
- TABLE 50 AMERICAS: DISTRICT HEATING MARKET, BY HEAT SOURCE, 2019-2022 (USD BILLION)
- TABLE 51 AMERICAS: DISTRICT HEATING MARKET, BY HEAT SOURCE, 2023-2028 (USD BILLION)
- TABLE 52 AMERICAS: DISTRICT HEATING MARKET, BY PLANT TYPE, 2019-2022 (USD BILLION)
- TABLE 53 AMERICAS: DISTRICT HEATING MARKET, BY PLANT TYPE, 2023-2028 (USD BILLION)
- TABLE 54 AMERICAS: DISTRICT HEATING MARKET, BY APPLICATION, 2019-2022 (USD BILLION)
- TABLE 55 AMERICAS: DISTRICT HEATING MARKET, BY APPLICATION, 2023-2028 (USD BILLION)
- 10.2.1 US
- 10.2.1.1 Government-led initiatives encouraging adoption of clean energy sources to drive demand
- TABLE 56 US: DISTRICT HEATING MARKET, BY APPLICATION, 2019-2022 (USD BILLION)
- TABLE 57 US: DISTRICT HEATING MARKET, BY APPLICATION, 2023-2028 (USD BILLION)
- 10.2.2 CANADA
- 10.2.2.1 Growing government investments in sustainable solutions to boost demand
- TABLE 58 CANADA: DISTRICT HEATING MARKET, BY APPLICATION, 2019-2022 (USD BILLION)
- TABLE 59 CANADA: DISTRICT HEATING MARKET, BY APPLICATION, 2023-2028 (USD BILLION)
- 10.2.3 SOUTH AMERICA
- 10.2.3.1 Increasing focus of public-private partnerships on developing advanced district heating systems to drive market
- TABLE 60 SOUTH AMERICA: DISTRICT HEATING MARKET, BY APPLICATION, 2019-2022 (USD BILLION)
- TABLE 61 SOUTH AMERICA: DISTRICT HEATING MARKET, BY APPLICATION, 2023-2028 (USD BILLION)
- 10.2.4 AMERICAS: RECESSION IMPACT
- 10.3 EUROPE
- FIGURE 38 EUROPE: DISTRICT HEATING MARKET SNAPSHOT
- TABLE 62 EUROPE: DISTRICT HEATING MARKET, BY COUNTRY, 2019-2022 (USD BILLION)
- TABLE 63 EUROPE: DISTRICT HEATING MARKET, BY COUNTRY, 2023-2028 (USD BILLION)
- TABLE 64 EUROPE: DISTRICT HEATING MARKET, BY HEAT SOURCE, 2019-2022 (USD BILLION)
- TABLE 65 EUROPE: DISTRICT HEATING MARKET, BY HEAT SOURCE, 2023-2028 (USD BILLION)
- TABLE 66 EUROPE: DISTRICT HEATING MARKET, BY PLANT TYPE, 2019-2022 (USD BILLION)
- TABLE 67 EUROPE: DISTRICT HEATING MARKET, BY PLANT TYPE, 2023-2028 (USD BILLION)
- TABLE 68 EUROPE: DISTRICT HEATING MARKET, BY APPLICATION, 2019-2022 (USD BILLION)
- TABLE 69 EUROPE: DISTRICT HEATING MARKET, BY APPLICATION, 2023-2028 (USD BILLION)
- 10.3.1 GERMANY
- 10.3.1.1 Technological advancements and digitalization of district heating services to drive market
- TABLE 70 GERMANY: DISTRICT HEATING MARKET, BY APPLICATION, 2019-2022 (USD BILLION)
- TABLE 71 GERMANY: DISTRICT HEATING MARKET, BY APPLICATION, 2023-2028 (USD BILLION)
- 10.3.2 POLAND
- 10.3.2.1 Increasing focus on achieving climate-neutrality goal to boost demand
- TABLE 72 POLAND: DISTRICT HEATING MARKET, BY APPLICATION, 2019-2022 (USD BILLION)
- TABLE 73 POLAND: DISTRICT HEATING MARKET, BY APPLICATION, 2023-2028 (USD BILLION)
- 10.3.3 FINLAND
- 10.3.3.1 Rising focus on decarbonization and investments in sustainable waste heat solutions to support market
- TABLE 74 FINLAND: DISTRICT HEATING MARKET, BY APPLICATION, 2019-2022 (USD BILLION)
- TABLE 75 FINLAND: DISTRICT HEATING MARKET, BY APPLICATION, 2023-2028 (USD BILLION)
- 10.3.4 FRANCE
- 10.3.4.1 Emphasis of residential sector on achieving net-zero energy building to promote deployment of district heating solutions
- TABLE 76 FRANCE: DISTRICT HEATING MARKET, BY APPLICATION, 2019-2022 (USD BILLION)
- TABLE 77 FRANCE: DISTRICT HEATING MARKET, BY APPLICATION, 2023-2028 (USD BILLION)
- 10.3.5 CZECH REPUBLIC
- 10.3.5.1 Implementation of favorable government schemes to support EU Green Deal objectives to accelerate demand
- TABLE 78 CZECH REPUBLIC: DISTRICT HEATING MARKET, BY APPLICATION, 2019-2022 (USD BILLION)
- TABLE 79 CZECH REPUBLIC: DISTRICT HEATING MARKET, BY APPLICATION, 2023-2028 (USD BILLION)
- 10.3.6 AUSTRIA
- 10.3.6.1 Strong focus to achieving climate neutrality using district heating systems to boost demand
- TABLE 80 AUSTRIA: DISTRICT HEATING MARKET, BY APPLICATION, 2019-2022 (USD BILLION)
- TABLE 81 AUSTRIA: DISTRICT HEATING MARKET, BY APPLICATION, 2023-2028 (USD BILLION)
- 10.3.7 SLOVAKIA
- 10.3.7.1 Modernization and enhancement of existing district heating infrastructure to propel demand
- TABLE 82 SLOVAKIA: DISTRICT HEATING MARKET, BY APPLICATION, 2019-2022 (USD BILLION)
- TABLE 83 SLOVAKIA: DISTRICT HEATING MARKET, BY APPLICATION, 2023-2028 (USD BILLION)
- 10.3.8 UK
- 10.3.8.1 Government initiatives toward achieving net-zero greenhouse gas emissions to drive market
- TABLE 84 UK: DISTRICT HEATING MARKET, BY APPLICATION, 2019-2022 (USD BILLION)
- TABLE 85 UK: DISTRICT HEATING MARKET, BY APPLICATION, 2023-2028 (USD BILLION)
- 10.3.9 SCANDINAVIAN
- 10.3.9.1 Increased use of CHP plants to contribute to market growth
- TABLE 86 SCANDINAVIAN: DISTRICT HEATING MARKET, BY APPLICATION, 2019-2022 (USD BILLION)
- TABLE 87 SCANDINAVIAN: DISTRICT HEATING MARKET, BY APPLICATION, 2023-2028 (USD BILLION)
- 10.3.10 BALKANS
- 10.3.10.1 Financial aid by European Commission to encourage application of renewable heating sources to drive market
- TABLE 88 BALKANS: DISTRICT HEATING MARKET, BY APPLICATION, 2019-2022 (USD BILLION)
- TABLE 89 BALKANS: DISTRICT HEATING MARKET, BY APPLICATION, 2023-2028 (USD BILLION)
- 10.3.11 BALTICS
- 10.3.11.1 Investments to modernize and optimize district heating infrastructure to boost demand
- TABLE 90 BALTICS: DISTRICT HEATING MARKET, BY APPLICATION, 2019-2022 (USD BILLION)
- TABLE 91 BALTICS: DISTRICT HEATING MARKET, BY APPLICATION, 2023-2028 (USD BILLION)
- 10.3.12 REST OF EUROPE
- TABLE 92 REST OF EUROPE: DISTRICT HEATING MARKET, BY APPLICATION, 2019-2022 (USD BILLION)
- TABLE 93 REST OF EUROPE: DISTRICT HEATING MARKET, BY APPLICATION, 2023-2028 (USD BILLION)
- 10.3.13 EUROPE: RECESSION IMPACT
- 10.4 ASIA PACIFIC
- FIGURE 39 ASIA PACIFIC: DISTRICT HEATING MARKET SNAPSHOT
- TABLE 94 ASIA PACIFIC: DISTRICT HEATING MARKET, BY COUNTRY, 2019-2022 (USD BILLION)
- TABLE 95 ASIA PACIFIC: DISTRICT HEATING MARKET, BY COUNTRY, 2023-2028 (USD BILLION)
- TABLE 96 ASIA PACIFIC: DISTRICT HEATING MARKET, BY HEAT SOURCE, 2019-2022 (USD BILLION)
- TABLE 97 ASIA PACIFIC: DISTRICT HEATING MARKET, BY HEAT SOURCE, 2023-2028 (USD BILLION)
- TABLE 98 ASIA PACIFIC: DISTRICT HEATING MARKET, BY PLANT TYPE, 2019-2022 (USD BILLION)
- TABLE 99 ASIA PACIFIC: DISTRICT HEATING MARKET, BY PLANT TYPE, 2023-2028 (USD BILLION)
- TABLE 100 ASIA PACIFIC: DISTRICT HEATING MARKET, BY APPLICATION, 2019-2022 (USD BILLION)
- TABLE 101 ASIA PACIFIC: DISTRICT HEATING MARKET, BY APPLICATION, 2023-2028 (USD BILLION)
- 10.4.1 CHINA
- 10.4.1.1 Implementation of new energy-efficient projects to boost demand
- TABLE 102 CHINA: DISTRICT HEATING MARKET, BY APPLICATION, 2019-2022 (USD BILLION)
- TABLE 103 CHINA: DISTRICT HEATING MARKET, BY APPLICATION, 2023-2028 (USD BILLION)
- 10.4.2 JAPAN
- 10.4.2.1 Adoption of Heat Roadmap Europe 2050 Project to accelerate demand
- TABLE 104 JAPAN: DISTRICT HEATING MARKET, BY APPLICATION, 2019-2022 (USD BILLION)
- TABLE 105 JAPAN: DISTRICT HEATING MARKET, BY APPLICATION, 2023-2028 (USD BILLION)
- 10.4.3 SOUTH KOREA
- 10.4.3.1 Development and implementation of third-generation district heating systems to drive demand
- TABLE 106 SOUTH KOREA: DISTRICT HEATING MARKET, BY APPLICATION, 2019-2022 (USD BILLION)
- TABLE 107 SOUTH KOREA: DISTRICT HEATING MARKET, BY APPLICATION, 2023-2028 (USD BILLION)
- 10.4.4 REST OF ASIA PACIFIC
- TABLE 108 REST OF ASIA PACIFIC: DISTRICT HEATING MARKET, BY APPLICATION, 2019-2022 (USD BILLION)
- TABLE 109 REST OF ASIA PACIFIC: DISTRICT HEATING MARKET, BY APPLICATION, 2023-2028 (USD BILLION)
- 10.4.5 ASIA PACIFIC: RECESSION IMPACT
11 COMPETITIVE LANDSCAPE
- 11.1 OVERVIEW
- 11.2 KEY PLAYER STRATEGIES ADOPTED BY MAJOR PLAYERS
- TABLE 110 DISTRICT HEATING MARKET: OVERVIEW OF STRATEGIES ADOPTED BY KEY PLAYERS
- 11.2.1 PRODUCT/SERVICE PORTFOLIO
- 11.2.2 REGIONAL FOCUS
- 11.2.3 ORGANIC/INORGANIC GROWTH STRATEGIES
- 11.3 MARKET SHARE ANALYSIS, 2022
- FIGURE 40 MARKET SHARE ANALYSIS OF KEY PLAYERS, 2022
- TABLE 111 DISTRICT HEATING MARKET SHARE ANALYSIS, 2022
- 11.4 REVENUE ANALYSIS, 2018-2022
- FIGURE 41 REVENUE ANALYSIS OF KEY PLAYERS, 2018-2022
- 11.5 COMPANY EVALUATION MATRIX, 2022
- 11.5.1 STARS
- 11.5.2 EMERGING LEADERS
- 11.5.3 PERVASIVE PLAYERS
- 11.5.4 PARTICIPANTS
- FIGURE 42 DISTRICT HEATING MARKET: COMPANY EVALUATION MATRIX, 2022
- 11.5.5 COMPANY FOOTPRINT
- TABLE 112 COMPANY FOOTPRINT, BY APPLICATION
- TABLE 113 COMPANY FOOTPRINT, BY REGION
- TABLE 114 OVERALL COMPANY FOOTPRINT
- 11.6 START-UPS/SMALL AND MEDIUM-SIZED ENTERPRISES (SMES) EVALUATION MATRIX, 2022
- TABLE 115 DISTRICT HEATING MARKET: LIST OF KEY START-UPS/SMES
- 11.6.1 PROGRESSIVE COMPANIES
- 11.6.2 RESPONSIVE COMPANIES
- 11.6.3 DYNAMIC COMPANIES
- 11.6.4 STARTING BLOCKS
- FIGURE 43 DISTRICT HEATING MARKET: START-UPS/SMES EVALUATION MATRIX, 2022
- 11.6.5 COMPETITIVE BENCHMARKING OF KEY START-UPS/SMES
- TABLE 116 START-UPS/SMES FOOTPRINT, BY APPLICATION
- TABLE 117 START-UPS/SMES FOOTPRINT, BY REGION
- 11.7 COMPETITIVE SCENARIOS AND TRENDS
- 11.7.1 PRODUCT/SERVICE LAUNCHES
- TABLE 118 DISTRICT HEATING MARKET: PRODUCT/SERVICE LAUNCHES, 2020-2023
- 11.7.2 DEALS
- TABLE 119 DISTRICT HEATING MARKET: DEALS, 2020-2023
12 COMPANY PROFILES
- (Business overview, Products/Solutions/Services offered, Recent developments & MnM View)**
- 12.1 KEY PLAYERS
- 12.1.1 FORTUM
- TABLE 120 FORTUM: COMPANY OVERVIEW
- FIGURE 44 FORTUM: COMPANY SNAPSHOT
- TABLE 121 FORTUM: PRODUCTS/SOLUTIONS/SERVICES OFFERED
- TABLE 122 FORTUM: PRODUCT/SERVICE LAUNCHES
- TABLE 123 FORTUM: DEALS
- 12.1.2 VATTENFALL
- TABLE 124 VATTENFALL: COMPANY OVERVIEW
- FIGURE 45 VATTENFALL: COMPANY SNAPSHOT
- TABLE 125 VATTENFALL: PRODUCTS/SOLUTIONS/SERVICES OFFERED
- TABLE 126 VATTENFALL: PRODUCT/SERVICE LAUNCHES
- TABLE 127 VATTENFALL: DEALS
- TABLE 128 VATTENFALL: OTHERS
- 12.1.3 ENGIE
- TABLE 129 ENGIE: COMPANY OVERVIEW
- FIGURE 46 ENGIE: COMPANY SNAPSHOT
- TABLE 130 ENGIE: PRODUCTS/SOLUTIONS/SERVICES OFFERED
- TABLE 131 ENGIE: DEALS
- 12.1.4 DANFOSS
- TABLE 132 DANFOSS: COMPANY OVERVIEW
- FIGURE 47 DANFOSS: COMPANY SNAPSHOT
- TABLE 133 DANFOSS: PRODUCTS/SOLUTIONS/SERVICES OFFERED
- TABLE 134 DANFOSS: PRODUCT/SERVICE LAUNCHES
- 12.1.5 STATKRAFT
- TABLE 135 STATKRAFT: COMPANY OVERVIEW
- FIGURE 48 STATKRAFT: COMPANY SNAPSHOT
- TABLE 136 STATKRAFT: PRODUCTS/SOLUTIONS/SERVICES OFFERED
- TABLE 137 STATKRAFT: DEALS
- 12.1.6 LOGSTOR DENMARK HOLDING APS
- TABLE 138 LOGSTOR DENMARK HOLDING APS: COMPANY OVERVIEW
- TABLE 139 LOGSTOR DENMARK HOLDING APS: PRODUCTS/SOLUTIONS/SERVICES OFFERED
- TABLE 140 LOGSTOR DENMARK HOLDING APS: DEALS
- 12.1.7 VITAL ENERGI
- TABLE 141 VITAL ENERGI: COMPANY OVERVIEW
- FIGURE 49 VITAL ENERGI: COMPANY SNAPSHOT
- TABLE 142 VITAL ENERGI: PRODUCTS/SOLUTIONS/SERVICES OFFERED
- TABLE 143 VITAL ENERGI: OTHERS
- 12.1.8 KELAG ENERGIE & WARME
- TABLE 144 KELAG ENERGIE & WARME: COMPANY OVERVIEW
- TABLE 145 KELAG ENERGIE & WARME: PRODUCTS/SOLUTIONS/SERVICES OFFERED
- TABLE 146 KELAG ENERGIE & WARME: DEALS
- 12.1.9 SHINRYO CORPORATION
- TABLE 147 SHINRYO CORPORATION: COMPANY OVERVIEW
- TABLE 148 SHINRYO CORPORATION: PRODUCTS/SOLUTIONS/SERVICES OFFERED
- 12.1.10 VEOLIA
- TABLE 149 VEOLIA: COMPANY OVERVIEW
- FIGURE 50 VEOLIA: COMPANY SNAPSHOT
- TABLE 150 VEOLIA: PRODUCTS/SOLUTIONS/SERVICES OFFERED
- TABLE 151 VEOLIA: DEALS
- 12.1.11 GENERAL ELECTRIC
- TABLE 152 GENERAL ELECTRIC: COMPANY OVERVIEW
- FIGURE 51 GENERAL ELECTRIC: COMPANY SNAPSHOT
- TABLE 153 GENERAL ELECTRIC: PRODUCTS/SOLUTIONS/SERVICES OFFERED
- TABLE 154 GENERAL ELECTRIC: DEALS
- TABLE 155 GENERAL ELECTRIC: OTHERS
- 12.1.12 UNIPER SE
- TABLE 156 UNIPER SE: COMPANY OVERVIEW
- FIGURE 52 UNIPER SE: COMPANY SNAPSHOT
- TABLE 157 UNIPER SE: PRODUCTS/SOLUTIONS/SERVICES OFFERED
- TABLE 158 UNIPER SE: DEALS
- *Details on Business overview, Products/Solutions/Services offered, Recent developments & MnM View might not be captured in case of unlisted companies.
- 12.2 OTHER PLAYERS
- 12.2.1 GOTEBORG ENERGI
- 12.2.2 FVB ENERGY INC.
- 12.2.3 ALFA LAVAL
- 12.2.4 RAMBOLL
- 12.2.5 SAVON VOIMA
- 12.2.6 ENWAVE ENERGY CORPORATION
- 12.2.7 ØRSTED A/S
- 12.2.8 HELEN LTD
- 12.2.9 KEPPEL CORPORATION LIMITED
- 12.2.10 STEAG GMBH
- 12.2.11 HAFSLUND AS
- 12.2.12 CLEARWAY ENERGY GROUP LLC
- 12.2.13 DALL ENERGY
13 APPENDIX
- 13.1 DISCUSSION GUIDE
- 13.2 KNOWLEDGESTORE: MARKETSANDMARKETS' SUBSCRIPTION PORTAL
- 13.3 CUSTOMIZATION OPTIONS
- 13.4 RELATED REPORTS
- 13.5 AUTHOR DETAILS
