|
|
市場調査レポート
商品コード
1768578
説明可能なAIの世界市場:市場規模・シェア・動向分析 (展開方式別、コンポーネント別、用途別、最終用途別、地域別)・展望・将来予測 (2025年~2032年)Global Explainable AI Market Size, Share & Industry Analysis Report By Deployment (Cloud and On-premise), By Component (Solution and Services), By Application, By End-use, By Regional Outlook and Forecast, 2025 - 2032 |
||||||
|
|||||||
|
|||||||

| 説明可能なAIの世界市場:市場規模・シェア・動向分析 (展開方式別、コンポーネント別、用途別、最終用途別、地域別)・展望・将来予測 (2025年~2032年) |
|
出版日: 2025年06月20日
発行: KBV Research
ページ情報: 英文 425 Pages
納期: 即納可能
|

全表示
- 概要
- 図表
- 目次
世界の説明可能なAI (Explainable AI) の市場規模は、予測期間中に20.4%のCAGRで市場成長し、2032年までに222億米ドルに達すると予想されています。
KBV Cardinal matrixに示された分析に基づくと、Google LLC、Microsoft Corporation、NVIDIA Corporation、Amazon Web Services、Inc.が説明可能なAI市場の先駆者です。Salesforce、Inc.、IBM Corporation、SAP SEなどの企業は、説明可能なAI市場の主要なイノベーターです。2025年5月、Microsoft Corporationは、IT企業のAccentureとの提携を発表し、Azure AI Foundryを展開して、スケーラブルで説明可能、かつ安全な生成AIソリューションを実現しました。業界をまたいで75を超えるユースケースがあり、16が本番環境で稼働しているこのプラットフォームは、開発時間を50%短縮し、効率を高め、コンプライアンスを確保し、可観測性、レッドチーム、コンテンツの安全性を通じて責任あるAIを強化しました。
COVID-19の影響分析
COVID-19パンデミックの初期段階において、説明可能なAI(XAI)市場は大きな打撃を受けました。多くの業界において、多くの組織がイノベーションやデジタルトランスフォーメーションよりも、業務継続と事業存続を優先しました。その結果、XAIを含む高度なAIソリューションの導入は大幅に減速しました。予算制約と経済の不確実性により、企業はAIの説明可能性に関連するプロジェクトを延期または中止せざるを得なくなり、リモートワークの実現やコア業務の維持といったより差し迫った課題に投資が振り向けられました。全体として、COVID-19危機は説明可能なAI市場に一時的ではあるものマイナスの影響を与え、期待されていた成長軌道を遅らせました。このように、COVID-19パンデミックは市場にマイナスの影響を与えました。
市場成長要因
説明可能なAI(XAI)市場を牽引する最も重要な要因の一つは、業界全体における規制遵守と透明性要件への世界の関心の高まりです。金融、医療、保険、公共部門などの分野では、人工知能システムが意思決定プロセスのより深くに組み込まれるにつれ、これらの意思決定が公正かつ理解しやすいものであることを保証するよう、規制当局からの圧力が高まっています。結論として、規制の厳格化と透明性への要求の高まりは、説明可能なAIの導入を加速させ、コンプライアンスが市場における重要な推進力となっています。
さらに、信頼は技術導入の礎であり、人工知能の文脈においては不可欠であると同時に、捉えにくいものでもあります。説明可能なAI市場の3つ目の主要な推進力は、AI搭載システムに対するユーザーの信頼を構築・維持するという重要なニーズです。ローンの承認や医療診断から法的勧告やパーソナライズされたマーケティングまで、AI技術が日常生活における意思決定にますます影響を与えるにつれて、エンドユーザーの間で透明性と理解しやすい推論への需要が高まっています。ブラックボックスAIモデルは強力ですが、結論に至る過程を利害利害関係者が容易に解釈したり、その信頼性を評価したりできないため、ユーザーの信頼を得られない場合がよくあります。結論として、説明可能性を通じて信頼を構築することが、AI導入の重要な促進要因として浮上しており、ユーザー、組織、市場が自信、明確さ、安心感を持って人工知能の潜在能力を最大限に活用できるようにしています。
市場抑制要因
しかし、説明可能なAIの普及を阻む根本的な要因は、モデルの説明可能性と予測精度の間のトレードオフ、特に複雑な実世界のアプリケーションにおいて、常に存在するという点です。今日最も高精度なAIモデル、特にニューラルネットワークなどのディープラーニングアーキテクチャ、ランダムフォレストのようなアンサンブル手法、高度な勾配ブースティングアルゴリズムは、しばしば「ブラックボックス」モデルと呼ばれます。これらのモデルの内部構造は非常に複雑で、人間が解釈するのが非常に困難な、多層的なパラメータと非線形変換を特徴としています。これらのモデルは、画像認識や自然言語処理から不正検出に至るまで、幅広いタスクにおいて最先端のパフォーマンスを発揮しますが、その不透明性ゆえに、特定の予測の根拠はエンドユーザーにとってほとんど理解できません。結論として、説明可能性とモデル精度のトレードオフは説明可能なAIの適用範囲を制限し、組織は透明性と最適なパフォーマンスのどちらかを選ばざるを得なくなります。
バリューチェーン分析
説明可能なAI(XAI)市場のバリューチェーンは、モデルの透明性、公平性、解釈可能性に重点を置く研究開発(R&D)から始まります。これは、説明可能性ツールとAIアルゴリズムをシステムへ組み込む技術開発と統合へと繋がります。データの取得と管理は、XAIモデルを支える高品質で偏りのないデータセットを確保します。製品化とサービス開発では、これらの技術が展開可能でユーザーフレンドリーなソリューションへと変換されます。営業、マーケティング、流通は導入を促進し、規制遵守と倫理は信頼、プライバシー、公平性を確保します。継続的な顧客サポートとフィードバックはR&Dにフィードバックされ、反復的なイノベーションを促進します。
市場シェア分析
展開方式別の展望
導入形態に基づいて、市場はクラウドとオンプレミスに分類されます。クラウドセグメントは2024年に市場の63%の収益シェアを獲得しました。クラウドベースの説明可能なAIソリューションは比類のない拡張性と柔軟性を提供し、組織は大規模なオンプレミスインフラを必要とせずにAIモデルを導入・管理できます。クラウドプラットフォームは需要に応じてリソースを迅速にプロビジョニングできるため、特に計算要件が変動する企業にとって有益です。
コンポーネント別の展望
コンポーネントに基づいて、市場はソリューションとサービスに分類されます。サービスセグメントは、2024年に市場全体の19%の収益シェアを記録しました。これは、XAI市場において重要なサポート役を担っています。サービスには、コンサルティング、実装、統合、保守、トレーニングが含まれます。これらのサービスの需要は、特定のニーズに合わせてXAIソリューションを選択、カスタマイズ、最適化するための専門家の指導を必要とする組織によって牽引されています。多くの企業はAIの説明可能性に関する社内専門知識を欠いており、導入の成功と継続的な管理には専門的なサービスが不可欠です。
用途別の展望
用途別に見ると、市場は不正・異常検知、創薬・診断、予知保全、サプライチェーン管理、IDアクセス管理・その他に分類されます。IDアクセス管理・その他セグメントは、2024年に市場収益シェアの22%を占めました。これは、サイバーセキュリティ、人事、規制コンプライアンスなど、幅広いアプリケーションを網羅しています。IAM(アイデンティティ・アクセス・マネジメント)分野では、説明可能なAIが、組織がユーザーの行動を監視し、異常なアクセスパターンを検知し、アクセス決定の正当性を検証するのに役立ちます。これは、堅牢なセキュリティ体制を維持し、コンプライアンス要件を満たすために不可欠です。
最終用途別の展望
最終用途に基づいて、市場はIT・通信、医療、BFSI、航空宇宙・防衛、小売業・eコマース、公共部門・ユーティリティ、自動車、その他に分類されています。BFSIセグメントは、2024年に市場で15%の収益シェアを獲得しました。BFSIセグメントは、規制遵守、不正検出、信用スコアリング、およびリスク評価に対処するために、説明可能なAIに大きく依存しています。金融機関は、特に融資の拒否、取引のフラグ付け、または投資推奨を行う際に、意思決定の方法を示すという厳格な要件に直面しています。説明可能なAIは、透明性を確保し、偏見を減らし、顧客と規制当局の両方との信頼を構築します。デジタルバンキングとフィンテックの導入が加速するにつれて、その行動と予測を明確に正当化できるAIモデルの必要性も高まります。
地域別の展望
地域別に見ると、市場は北米、欧州、アジア太平洋、ラテンアメリカ・中東・アフリカ (LAMEA) の4地域にまたがって分析されています。北米セグメントは2024年に市場最大の収益シェアを記録しました。北米は、先進的なAI技術の早期導入、堅調な投資環境、そして高度に発達したデジタルインフラにより、説明可能なAI市場を牽引しています。この地域には、特に米国とカナダにおいて、多くの大手テクノロジー企業、調査機関、AIスタートアップが拠点を置いています。
目次
第1章 市場の範囲と分析手法
- 市場の定義
- 目的
- 市場範囲
- セグメンテーション
- 分析手法
第2章 市場要覧
- 主なハイライト
第3章 市場概要
- イントロダクション
- 概要
- 市場構成とシナリオ
- 概要
- 市場に影響を与える主な要因
- 市場促進要因
- 市場抑制要因
- 市場機会
- 市場の課題
第4章 競争分析:世界市場
- KBV Cardinal Matrix
- 最近の業界全体の戦略的展開
- 事業提携・協力、契約
- 製品発売・拡大
- 企業合併・買収 (M&A)
- 市場シェア分析 (2024年)
- 主要な成功戦略
- 主な戦略
- 主要な戦略的動き
- ポーターのファイブフォース分析
第5章 説明可能なAI市場のバリューチェーン分析
- 研究開発(R&D)
- 技術開発・統合
- データ取得・管理
- 製品化とサービス開発
- 規制遵守・倫理
- 販売・マーケティング・流通
- カスタマーサポート・フィードバック
第6章 主要な顧客基準:説明可能なAI市場
第7章 世界の説明可能なAI市場:展開方式別
- 世界のクラウド市場:地域別
- 世界のオンプレミス市場:地域別
第8章 世界の説明可能なAI市場:コンポーネント別
- 世界のソリューション市場:地域別
- 世界のサービス市場:地域別
第9章 世界の説明可能なAI市場:用途別
- 世界の不正・異常検知市場:地域別
- 世界の創薬・診断市場:地域別
- 世界の予知保全市場:地域別
- 世界のサプライチェーン管理市場:地域別
- 世界のID・アクセス管理、その他の市場:地域別
第10章 世界の説明可能なAI市場:最終用途別
- 世界のIT・通信市場:地域別
- 世界の医療市場:地域別
- 世界のBFSI市場:地域別
- 世界の航空宇宙・防衛市場:地域別
- 世界の小売業・eコマース市場:地域別
- 世界の公共部門・ユーティリティ市場:地域別
- 世界の自動車市場:地域別
- 世界のその他の最終用途市場:地域別
第11章 世界の説明可能なAI市場:地域別
- 北米
- 北米の説明可能なAI市場:国別
- 米国
- カナダ
- メキシコ
- その他北米
- 北米の説明可能なAI市場:国別
- 欧州
- 欧州の説明可能なAI市場:国別
- ドイツ
- 英国
- フランス
- ロシア
- スペイン
- イタリア
- その他欧州
- 欧州の説明可能なAI市場:国別
- アジア太平洋
- アジア太平洋の説明可能なAI市場:国別
- 中国
- 日本
- インド
- 韓国
- シンガポール
- マレーシア
- その他アジア太平洋
- アジア太平洋の説明可能なAI市場:国別
- ラテンアメリカ・中東・アフリカ
- ラテンアメリカ・中東・アフリカの説明可能なAI市場:国別
- ブラジル
- アルゼンチン
- アラブ首長国連邦
- サウジアラビア
- 南アフリカ
- ナイジェリア
- その他ラテンアメリカ・中東・アフリカ
- ラテンアメリカ・中東・アフリカの説明可能なAI市場:国別
第12章 企業プロファイル
- Microsoft Corporation
- IBM Corporation
- Google LLC(Alphabet Inc)
- Salesforce, Inc
- Intel Corporation
- NVIDIA Corporation
- SAS Institute, Inc
- Databricks, Inc
- Amazon Web Services, Inc(Amazon.com, Inc.)
- SAP SE
第13章 説明可能なAI市場の成功必須条件
LIST OF TABLES
- TABLE 1 Global Explainable AI Market, 2021 - 2024, USD Million
- TABLE 2 Global Explainable AI Market, 2025 - 2032, USD Million
- TABLE 3 Partnerships, Collaborations and Agreements- Explainable AI Market
- TABLE 4 Product Launches And Product Expansions- Explainable AI Market
- TABLE 5 Acquisition and Mergers- Explainable AI Market
- TABLE 6 Key Costumer Criteria - Explainable AI Market
- TABLE 7 Global Explainable AI Market by Deployment, 2021 - 2024, USD Million
- TABLE 8 Global Explainable AI Market by Deployment, 2025 - 2032, USD Million
- TABLE 9 Global Cloud Market by Region, 2021 - 2024, USD Million
- TABLE 10 Global Cloud Market by Region, 2025 - 2032, USD Million
- TABLE 11 Global On-premise Market by Region, 2021 - 2024, USD Million
- TABLE 12 Global On-premise Market by Region, 2025 - 2032, USD Million
- TABLE 13 Use Case 1: Explainable AI in Cloud Deployment
- TABLE 14 Use Case 2: Explainable AI in On-Premise Deployment
- TABLE 15 Global Explainable AI Market by Component, 2021 - 2024, USD Million
- TABLE 16 Global Explainable AI Market by Component, 2025 - 2032, USD Million
- TABLE 17 Global Solution Market by Region, 2021 - 2024, USD Million
- TABLE 18 Global Solution Market by Region, 2025 - 2032, USD Million
- TABLE 19 Global Services Market by Region, 2021 - 2024, USD Million
- TABLE 20 Global Services Market by Region, 2025 - 2032, USD Million
- TABLE 21 Use Case 3: Explainable AI Solutions
- TABLE 22 Use Case 4: Explainable AI Services
- TABLE 23 Global Explainable AI Market by Application, 2021 - 2024, USD Million
- TABLE 24 Global Explainable AI Market by Application, 2025 - 2032, USD Million
- TABLE 25 Global Fraud & Anomaly Detection Market by Region, 2021 - 2024, USD Million
- TABLE 26 Global Fraud & Anomaly Detection Market by Region, 2025 - 2032, USD Million
- TABLE 27 Global Drug Discovery & Diagnostics Market by Region, 2021 - 2024, USD Million
- TABLE 28 Global Drug Discovery & Diagnostics Market by Region, 2025 - 2032, USD Million
- TABLE 29 Global Predictive Maintenance Market by Region, 2021 - 2024, USD Million
- TABLE 30 Global Predictive Maintenance Market by Region, 2025 - 2032, USD Million
- TABLE 31 Global Supply Chain Management Market by Region, 2021 - 2024, USD Million
- TABLE 32 Global Supply Chain Management Market by Region, 2025 - 2032, USD Million
- TABLE 33 Global Identity, Access Management & Others Market by Region, 2021 - 2024, USD Million
- TABLE 34 Global Identity, Access Management & Others Market by Region, 2025 - 2032, USD Million
- TABLE 35 Use Case 5: Explainable AI for Fraud & Anomaly Detection
- TABLE 36 Use Case 6: Explainable AI in Drug Discovery & Diagnostics
- TABLE 37 Use Case 7: Explainable AI for Predictive Maintenance in Manufacturing
- TABLE 38 Use Case 9: Explainable AI for Identity Access Management
- TABLE 39 Use Case 10: Explainable AI - Other Applications
- TABLE 40 Global Explainable AI Market by End-use, 2021 - 2024, USD Million
- TABLE 41 Global Explainable AI Market by End-use, 2025 - 2032, USD Million
- TABLE 42 Global IT & Telecommunication Market by Region, 2021 - 2024, USD Million
- TABLE 43 Global IT & Telecommunication Market by Region, 2025 - 2032, USD Million
- TABLE 44 Global Healthcare Market by Region, 2021 - 2024, USD Million
- TABLE 45 Global Healthcare Market by Region, 2025 - 2032, USD Million
- TABLE 46 Global BFSI Market by Region, 2021 - 2024, USD Million
- TABLE 47 Global BFSI Market by Region, 2025 - 2032, USD Million
- TABLE 48 Global Aerospace & Defense Market by Region, 2021 - 2024, USD Million
- TABLE 49 Global Aerospace & Defense Market by Region, 2025 - 2032, USD Million
- TABLE 50 Global Retail & E-commerce Market by Region, 2021 - 2024, USD Million
- TABLE 51 Global Retail & E-commerce Market by Region, 2025 - 2032, USD Million
- TABLE 52 Global Public Sector & Utilities Market by Region, 2021 - 2024, USD Million
- TABLE 53 Global Public Sector & Utilities Market by Region, 2025 - 2032, USD Million
- TABLE 54 Global Automotive Market by Region, 2021 - 2024, USD Million
- TABLE 55 Global Automotive Market by Region, 2025 - 2032, USD Million
- TABLE 56 Global Other End-use Market by Region, 2021 - 2024, USD Million
- TABLE 57 Global Other End-use Market by Region, 2025 - 2032, USD Million
- TABLE 58 Global Explainable AI Market by Region, 2021 - 2024, USD Million
- TABLE 59 Global Explainable AI Market by Region, 2025 - 2032, USD Million
- TABLE 60 North America Explainable AI Market, 2021 - 2024, USD Million
- TABLE 61 North America Explainable AI Market, 2025 - 2032, USD Million
- TABLE 62 North America Explainable AI Market by Deployment, 2021 - 2024, USD Million
- TABLE 63 North America Explainable AI Market by Deployment, 2025 - 2032, USD Million
- TABLE 64 North America Cloud Market by Region, 2021 - 2024, USD Million
- TABLE 65 North America Cloud Market by Region, 2025 - 2032, USD Million
- TABLE 66 North America On-premise Market by Region, 2021 - 2024, USD Million
- TABLE 67 North America On-premise Market by Region, 2025 - 2032, USD Million
- TABLE 68 North America Explainable AI Market by Component, 2021 - 2024, USD Million
- TABLE 69 North America Explainable AI Market by Component, 2025 - 2032, USD Million
- TABLE 70 North America Solution Market by Country, 2021 - 2024, USD Million
- TABLE 71 North America Solution Market by Country, 2025 - 2032, USD Million
- TABLE 72 North America Services Market by Country, 2021 - 2024, USD Million
- TABLE 73 North America Services Market by Country, 2025 - 2032, USD Million
- TABLE 74 North America Explainable AI Market by Application, 2021 - 2024, USD Million
- TABLE 75 North America Explainable AI Market by Application, 2025 - 2032, USD Million
- TABLE 76 North America Fraud & Anomaly Detection Market by Country, 2021 - 2024, USD Million
- TABLE 77 North America Fraud & Anomaly Detection Market by Country, 2025 - 2032, USD Million
- TABLE 78 North America Drug Discovery & Diagnostics Market by Country, 2021 - 2024, USD Million
- TABLE 79 North America Drug Discovery & Diagnostics Market by Country, 2025 - 2032, USD Million
- TABLE 80 North America Predictive Maintenance Market by Country, 2021 - 2024, USD Million
- TABLE 81 North America Predictive Maintenance Market by Country, 2025 - 2032, USD Million
- TABLE 82 North America Supply Chain Management Market by Country, 2021 - 2024, USD Million
- TABLE 83 North America Supply Chain Management Market by Country, 2025 - 2032, USD Million
- TABLE 84 North America Identity, Access Management & Others Market by Country, 2021 - 2024, USD Million
- TABLE 85 North America Identity, Access Management & Others Market by Country, 2025 - 2032, USD Million
- TABLE 86 North America Explainable AI Market by End-use, 2021 - 2024, USD Million
- TABLE 87 North America Explainable AI Market by End-use, 2025 - 2032, USD Million
- TABLE 88 North America IT & Telecommunication Market by Country, 2021 - 2024, USD Million
- TABLE 89 North America IT & Telecommunication Market by Country, 2025 - 2032, USD Million
- TABLE 90 North America Healthcare Market by Country, 2021 - 2024, USD Million
- TABLE 91 North America Healthcare Market by Country, 2025 - 2032, USD Million
- TABLE 92 North America BFSI Market by Country, 2021 - 2024, USD Million
- TABLE 93 North America BFSI Market by Country, 2025 - 2032, USD Million
- TABLE 94 North America Aerospace & Defense Market by Country, 2021 - 2024, USD Million
- TABLE 95 North America Aerospace & Defense Market by Country, 2025 - 2032, USD Million
- TABLE 96 North America Retail & E-commerce Market by Country, 2021 - 2024, USD Million
- TABLE 97 North America Retail & E-commerce Market by Country, 2025 - 2032, USD Million
- TABLE 98 North America Public Sector & Utilities Market by Country, 2021 - 2024, USD Million
- TABLE 99 North America Public Sector & Utilities Market by Country, 2025 - 2032, USD Million
- TABLE 100 North America Automotive Market by Country, 2021 - 2024, USD Million
- TABLE 101 North America Automotive Market by Country, 2025 - 2032, USD Million
- TABLE 102 North America Other End-use Market by Country, 2021 - 2024, USD Million
- TABLE 103 North America Other End-use Market by Country, 2025 - 2032, USD Million
- TABLE 104 North America Explainable AI Market by Country, 2021 - 2024, USD Million
- TABLE 105 North America Explainable AI Market by Country, 2025 - 2032, USD Million
- TABLE 106 US Explainable AI Market, 2021 - 2024, USD Million
- TABLE 107 US Explainable AI Market, 2025 - 2032, USD Million
- TABLE 108 US Explainable AI Market by Deployment, 2021 - 2024, USD Million
- TABLE 109 US Explainable AI Market by Deployment, 2025 - 2032, USD Million
- TABLE 110 US Explainable AI Market by Component, 2021 - 2024, USD Million
- TABLE 111 US Explainable AI Market by Component, 2025 - 2032, USD Million
- TABLE 112 US Explainable AI Market by Application, 2021 - 2024, USD Million
- TABLE 113 US Explainable AI Market by Application, 2025 - 2032, USD Million
- TABLE 114 US Explainable AI Market by End-use, 2021 - 2024, USD Million
- TABLE 115 US Explainable AI Market by End-use, 2025 - 2032, USD Million
- TABLE 116 Canada Explainable AI Market, 2021 - 2024, USD Million
- TABLE 117 Canada Explainable AI Market, 2025 - 2032, USD Million
- TABLE 118 Canada Explainable AI Market by Deployment, 2021 - 2024, USD Million
- TABLE 119 Canada Explainable AI Market by Deployment, 2025 - 2032, USD Million
- TABLE 120 Canada Explainable AI Market by Component, 2021 - 2024, USD Million
- TABLE 121 Canada Explainable AI Market by Component, 2025 - 2032, USD Million
- TABLE 122 Canada Explainable AI Market by Application, 2021 - 2024, USD Million
- TABLE 123 Canada Explainable AI Market by Application, 2025 - 2032, USD Million
- TABLE 124 Canada Explainable AI Market by End-use, 2021 - 2024, USD Million
- TABLE 125 Canada Explainable AI Market by End-use, 2025 - 2032, USD Million
- TABLE 126 Mexico Explainable AI Market, 2021 - 2024, USD Million
- TABLE 127 Mexico Explainable AI Market, 2025 - 2032, USD Million
- TABLE 128 Mexico Explainable AI Market by Deployment, 2021 - 2024, USD Million
- TABLE 129 Mexico Explainable AI Market by Deployment, 2025 - 2032, USD Million
- TABLE 130 Mexico Explainable AI Market by Component, 2021 - 2024, USD Million
- TABLE 131 Mexico Explainable AI Market by Component, 2025 - 2032, USD Million
- TABLE 132 Mexico Explainable AI Market by Application, 2021 - 2024, USD Million
- TABLE 133 Mexico Explainable AI Market by Application, 2025 - 2032, USD Million
- TABLE 134 Mexico Explainable AI Market by End-use, 2021 - 2024, USD Million
- TABLE 135 Mexico Explainable AI Market by End-use, 2025 - 2032, USD Million
- TABLE 136 Rest of North America Explainable AI Market, 2021 - 2024, USD Million
- TABLE 137 Rest of North America Explainable AI Market, 2025 - 2032, USD Million
- TABLE 138 Rest of North America Explainable AI Market by Deployment, 2021 - 2024, USD Million
- TABLE 139 Rest of North America Explainable AI Market by Deployment, 2025 - 2032, USD Million
- TABLE 140 Rest of North America Explainable AI Market by Component, 2021 - 2024, USD Million
- TABLE 141 Rest of North America Explainable AI Market by Component, 2025 - 2032, USD Million
- TABLE 142 Rest of North America Explainable AI Market by Application, 2021 - 2024, USD Million
- TABLE 143 Rest of North America Explainable AI Market by Application, 2025 - 2032, USD Million
- TABLE 144 Rest of North America Explainable AI Market by End-use, 2021 - 2024, USD Million
- TABLE 145 Rest of North America Explainable AI Market by End-use, 2025 - 2032, USD Million
- TABLE 146 Europe Explainable AI Market, 2021 - 2024, USD Million
- TABLE 147 Europe Explainable AI Market, 2025 - 2032, USD Million
- TABLE 148 Europe Explainable AI Market by Deployment, 2021 - 2024, USD Million
- TABLE 149 Europe Explainable AI Market by Deployment, 2025 - 2032, USD Million
- TABLE 150 Europe Cloud Market by Country, 2021 - 2024, USD Million
- TABLE 151 Europe Cloud Market by Country, 2025 - 2032, USD Million
- TABLE 152 Europe On-premise Market by Country, 2021 - 2024, USD Million
- TABLE 153 Europe On-premise Market by Country, 2025 - 2032, USD Million
- TABLE 154 Europe Explainable AI Market by Component, 2021 - 2024, USD Million
- TABLE 155 Europe Explainable AI Market by Component, 2025 - 2032, USD Million
- TABLE 156 Europe Solution Market by Country, 2021 - 2024, USD Million
- TABLE 157 Europe Solution Market by Country, 2025 - 2032, USD Million
- TABLE 158 Europe Services Market by Country, 2021 - 2024, USD Million
- TABLE 159 Europe Services Market by Country, 2025 - 2032, USD Million
- TABLE 160 Europe Explainable AI Market by Application, 2021 - 2024, USD Million
- TABLE 161 Europe Explainable AI Market by Application, 2025 - 2032, USD Million
- TABLE 162 Europe Fraud & Anomaly Detection Market by Country, 2021 - 2024, USD Million
- TABLE 163 Europe Fraud & Anomaly Detection Market by Country, 2025 - 2032, USD Million
- TABLE 164 Europe Drug Discovery & Diagnostics Market by Country, 2021 - 2024, USD Million
- TABLE 165 Europe Drug Discovery & Diagnostics Market by Country, 2025 - 2032, USD Million
- TABLE 166 Europe Predictive Maintenance Market by Country, 2021 - 2024, USD Million
- TABLE 167 Europe Predictive Maintenance Market by Country, 2025 - 2032, USD Million
- TABLE 168 Europe Supply Chain Management Market by Country, 2021 - 2024, USD Million
- TABLE 169 Europe Supply Chain Management Market by Country, 2025 - 2032, USD Million
- TABLE 170 Europe Identity, Access Management & Others Market by Country, 2021 - 2024, USD Million
- TABLE 171 Europe Identity, Access Management & Others Market by Country, 2025 - 2032, USD Million
- TABLE 172 Europe Explainable AI Market by End-use, 2021 - 2024, USD Million
- TABLE 173 Europe Explainable AI Market by End-use, 2025 - 2032, USD Million
- TABLE 174 Europe IT & Telecommunication Market by Country, 2021 - 2024, USD Million
- TABLE 175 Europe IT & Telecommunication Market by Country, 2025 - 2032, USD Million
- TABLE 176 Europe Healthcare Market by Country, 2021 - 2024, USD Million
- TABLE 177 Europe Healthcare Market by Country, 2025 - 2032, USD Million
- TABLE 178 Europe BFSI Market by Country, 2021 - 2024, USD Million
- TABLE 179 Europe BFSI Market by Country, 2025 - 2032, USD Million
- TABLE 180 Europe Aerospace & Defense Market by Country, 2021 - 2024, USD Million
- TABLE 181 Europe Aerospace & Defense Market by Country, 2025 - 2032, USD Million
- TABLE 182 Europe Retail & E-commerce Market by Country, 2021 - 2024, USD Million
- TABLE 183 Europe Retail & E-commerce Market by Country, 2025 - 2032, USD Million
- TABLE 184 Europe Public Sector & Utilities Market by Country, 2021 - 2024, USD Million
- TABLE 185 Europe Public Sector & Utilities Market by Country, 2025 - 2032, USD Million
- TABLE 186 Europe Automotive Market by Country, 2021 - 2024, USD Million
- TABLE 187 Europe Automotive Market by Country, 2025 - 2032, USD Million
- TABLE 188 Europe Other End-use Market by Country, 2021 - 2024, USD Million
- TABLE 189 Europe Other End-use Market by Country, 2025 - 2032, USD Million
- TABLE 190 Europe Explainable AI Market by Country, 2021 - 2024, USD Million
- TABLE 191 Europe Explainable AI Market by Country, 2025 - 2032, USD Million
- TABLE 192 Germany Explainable AI Market, 2021 - 2024, USD Million
- TABLE 193 Germany Explainable AI Market, 2025 - 2032, USD Million
- TABLE 194 Germany Explainable AI Market by Deployment, 2021 - 2024, USD Million
- TABLE 195 Germany Explainable AI Market by Deployment, 2025 - 2032, USD Million
- TABLE 196 Germany Explainable AI Market by Component, 2021 - 2024, USD Million
- TABLE 197 Germany Explainable AI Market by Component, 2025 - 2032, USD Million
- TABLE 198 Germany Explainable AI Market by Application, 2021 - 2024, USD Million
- TABLE 199 Germany Explainable AI Market by Application, 2025 - 2032, USD Million
- TABLE 200 Germany Explainable AI Market by End-use, 2021 - 2024, USD Million
- TABLE 201 Germany Explainable AI Market by End-use, 2025 - 2032, USD Million
- TABLE 202 UK Explainable AI Market, 2021 - 2024, USD Million
- TABLE 203 UK Explainable AI Market, 2025 - 2032, USD Million
- TABLE 204 UK Explainable AI Market by Deployment, 2021 - 2024, USD Million
- TABLE 205 UK Explainable AI Market by Deployment, 2025 - 2032, USD Million
- TABLE 206 UK Explainable AI Market by Component, 2021 - 2024, USD Million
- TABLE 207 UK Explainable AI Market by Component, 2025 - 2032, USD Million
- TABLE 208 UK Explainable AI Market by Application, 2021 - 2024, USD Million
- TABLE 209 UK Explainable AI Market by Application, 2025 - 2032, USD Million
- TABLE 210 UK Explainable AI Market by End-use, 2021 - 2024, USD Million
- TABLE 211 UK Explainable AI Market by End-use, 2025 - 2032, USD Million
- TABLE 212 France Explainable AI Market, 2021 - 2024, USD Million
- TABLE 213 France Explainable AI Market, 2025 - 2032, USD Million
- TABLE 214 France Explainable AI Market by Deployment, 2021 - 2024, USD Million
- TABLE 215 France Explainable AI Market by Deployment, 2025 - 2032, USD Million
- TABLE 216 France Explainable AI Market by Component, 2021 - 2024, USD Million
- TABLE 217 France Explainable AI Market by Component, 2025 - 2032, USD Million
- TABLE 218 France Explainable AI Market by Application, 2021 - 2024, USD Million
- TABLE 219 France Explainable AI Market by Application, 2025 - 2032, USD Million
- TABLE 220 France Explainable AI Market by End-use, 2021 - 2024, USD Million
- TABLE 221 France Explainable AI Market by End-use, 2025 - 2032, USD Million
- TABLE 222 Russia Explainable AI Market, 2021 - 2024, USD Million
- TABLE 223 Russia Explainable AI Market, 2025 - 2032, USD Million
- TABLE 224 Russia Explainable AI Market by Deployment, 2021 - 2024, USD Million
- TABLE 225 Russia Explainable AI Market by Deployment, 2025 - 2032, USD Million
- TABLE 226 Russia Explainable AI Market by Component, 2021 - 2024, USD Million
- TABLE 227 Russia Explainable AI Market by Component, 2025 - 2032, USD Million
- TABLE 228 Russia Explainable AI Market by Application, 2021 - 2024, USD Million
- TABLE 229 Russia Explainable AI Market by Application, 2025 - 2032, USD Million
- TABLE 230 Russia Explainable AI Market by End-use, 2021 - 2024, USD Million
- TABLE 231 Russia Explainable AI Market by End-use, 2025 - 2032, USD Million
- TABLE 232 Spain Explainable AI Market, 2021 - 2024, USD Million
- TABLE 233 Spain Explainable AI Market, 2025 - 2032, USD Million
- TABLE 234 Spain Explainable AI Market by Deployment, 2021 - 2024, USD Million
- TABLE 235 Spain Explainable AI Market by Deployment, 2025 - 2032, USD Million
- TABLE 236 Spain Explainable AI Market by Component, 2021 - 2024, USD Million
- TABLE 237 Spain Explainable AI Market by Component, 2025 - 2032, USD Million
- TABLE 238 Spain Explainable AI Market by Application, 2021 - 2024, USD Million
- TABLE 239 Spain Explainable AI Market by Application, 2025 - 2032, USD Million
- TABLE 240 Spain Explainable AI Market by End-use, 2021 - 2024, USD Million
- TABLE 241 Spain Explainable AI Market by End-use, 2025 - 2032, USD Million
- TABLE 242 Italy Explainable AI Market, 2021 - 2024, USD Million
- TABLE 243 Italy Explainable AI Market, 2025 - 2032, USD Million
- TABLE 244 Italy Explainable AI Market by Deployment, 2021 - 2024, USD Million
- TABLE 245 Italy Explainable AI Market by Deployment, 2025 - 2032, USD Million
- TABLE 246 Italy Explainable AI Market by Component, 2021 - 2024, USD Million
- TABLE 247 Italy Explainable AI Market by Component, 2025 - 2032, USD Million
- TABLE 248 Italy Explainable AI Market by Application, 2021 - 2024, USD Million
- TABLE 249 Italy Explainable AI Market by Application, 2025 - 2032, USD Million
- TABLE 250 Italy Explainable AI Market by End-use, 2021 - 2024, USD Million
- TABLE 251 Italy Explainable AI Market by End-use, 2025 - 2032, USD Million
- TABLE 252 Rest of Europe Explainable AI Market, 2021 - 2024, USD Million
- TABLE 253 Rest of Europe Explainable AI Market, 2025 - 2032, USD Million
- TABLE 254 Rest of Europe Explainable AI Market by Deployment, 2021 - 2024, USD Million
- TABLE 255 Rest of Europe Explainable AI Market by Deployment, 2025 - 2032, USD Million
- TABLE 256 Rest of Europe Explainable AI Market by Component, 2021 - 2024, USD Million
- TABLE 257 Rest of Europe Explainable AI Market by Component, 2025 - 2032, USD Million
- TABLE 258 Rest of Europe Explainable AI Market by Application, 2021 - 2024, USD Million
- TABLE 259 Rest of Europe Explainable AI Market by Application, 2025 - 2032, USD Million
- TABLE 260 Rest of Europe Explainable AI Market by End-use, 2021 - 2024, USD Million
- TABLE 261 Rest of Europe Explainable AI Market by End-use, 2025 - 2032, USD Million
- TABLE 262 Asia Pacific Explainable AI Market, 2021 - 2024, USD Million
- TABLE 263 Asia Pacific Explainable AI Market, 2025 - 2032, USD Million
- TABLE 264 Asia Pacific Explainable AI Market by Deployment, 2021 - 2024, USD Million
- TABLE 265 Asia Pacific Explainable AI Market by Deployment, 2025 - 2032, USD Million
- TABLE 266 Asia Pacific Cloud Market by Country, 2021 - 2024, USD Million
- TABLE 267 Asia Pacific Cloud Market by Country, 2025 - 2032, USD Million
- TABLE 268 Asia Pacific On-premise Market by Country, 2021 - 2024, USD Million
- TABLE 269 Asia Pacific On-premise Market by Country, 2025 - 2032, USD Million
- TABLE 270 Asia Pacific Explainable AI Market by Component, 2021 - 2024, USD Million
- TABLE 271 Asia Pacific Explainable AI Market by Component, 2025 - 2032, USD Million
- TABLE 272 Asia Pacific Solution Market by Country, 2021 - 2024, USD Million
- TABLE 273 Asia Pacific Solution Market by Country, 2025 - 2032, USD Million
- TABLE 274 Asia Pacific Services Market by Country, 2021 - 2024, USD Million
- TABLE 275 Asia Pacific Services Market by Country, 2025 - 2032, USD Million
- TABLE 276 Asia Pacific Explainable AI Market by Application, 2021 - 2024, USD Million
- TABLE 277 Asia Pacific Explainable AI Market by Application, 2025 - 2032, USD Million
- TABLE 278 Asia Pacific Fraud & Anomaly Detection Market by Country, 2021 - 2024, USD Million
- TABLE 279 Asia Pacific Fraud & Anomaly Detection Market by Country, 2025 - 2032, USD Million
- TABLE 280 Asia Pacific Drug Discovery & Diagnostics Market by Country, 2021 - 2024, USD Million
- TABLE 281 Asia Pacific Drug Discovery & Diagnostics Market by Country, 2025 - 2032, USD Million
- TABLE 282 Asia Pacific Predictive Maintenance Market by Country, 2021 - 2024, USD Million
- TABLE 283 Asia Pacific Predictive Maintenance Market by Country, 2025 - 2032, USD Million
- TABLE 284 Asia Pacific Supply Chain Management Market by Country, 2021 - 2024, USD Million
- TABLE 285 Asia Pacific Supply Chain Management Market by Country, 2025 - 2032, USD Million
- TABLE 286 Asia Pacific Identity, Access Management & Others Market by Country, 2021 - 2024, USD Million
- TABLE 287 Asia Pacific Identity, Access Management & Others Market by Country, 2025 - 2032, USD Million
- TABLE 288 Asia Pacific Explainable AI Market by End-use, 2021 - 2024, USD Million
- TABLE 289 Asia Pacific Explainable AI Market by End-use, 2025 - 2032, USD Million
- TABLE 290 Asia Pacific IT & Telecommunication Market by Country, 2021 - 2024, USD Million
- TABLE 291 Asia Pacific IT & Telecommunication Market by Country, 2025 - 2032, USD Million
- TABLE 292 Asia Pacific Healthcare Market by Country, 2021 - 2024, USD Million
- TABLE 293 Asia Pacific Healthcare Market by Country, 2025 - 2032, USD Million
- TABLE 294 Asia Pacific BFSI Market by Country, 2021 - 2024, USD Million
- TABLE 295 Asia Pacific BFSI Market by Country, 2025 - 2032, USD Million
- TABLE 296 Asia Pacific Aerospace & Defense Market by Country, 2021 - 2024, USD Million
- TABLE 297 Asia Pacific Aerospace & Defense Market by Country, 2025 - 2032, USD Million
- TABLE 298 Asia Pacific Retail & E-commerce Market by Country, 2021 - 2024, USD Million
- TABLE 299 Asia Pacific Retail & E-commerce Market by Country, 2025 - 2032, USD Million
- TABLE 300 Asia Pacific Public Sector & Utilities Market by Country, 2021 - 2024, USD Million
- TABLE 301 Asia Pacific Public Sector & Utilities Market by Country, 2025 - 2032, USD Million
- TABLE 302 Asia Pacific Automotive Market by Country, 2021 - 2024, USD Million
- TABLE 303 Asia Pacific Automotive Market by Country, 2025 - 2032, USD Million
- TABLE 304 Asia Pacific Other End-use Market by Country, 2021 - 2024, USD Million
- TABLE 305 Asia Pacific Other End-use Market by Country, 2025 - 2032, USD Million
- TABLE 306 Asia Pacific Explainable AI Market by Country, 2021 - 2024, USD Million
- TABLE 307 Asia Pacific Explainable AI Market by Country, 2025 - 2032, USD Million
- TABLE 308 China Explainable AI Market, 2021 - 2024, USD Million
- TABLE 309 China Explainable AI Market, 2025 - 2032, USD Million
- TABLE 310 China Explainable AI Market by Deployment, 2021 - 2024, USD Million
- TABLE 311 China Explainable AI Market by Deployment, 2025 - 2032, USD Million
- TABLE 312 China Explainable AI Market by Component, 2021 - 2024, USD Million
- TABLE 313 China Explainable AI Market by Component, 2025 - 2032, USD Million
- TABLE 314 China Explainable AI Market by Application, 2021 - 2024, USD Million
- TABLE 315 China Explainable AI Market by Application, 2025 - 2032, USD Million
- TABLE 316 China Explainable AI Market by End-use, 2021 - 2024, USD Million
- TABLE 317 China Explainable AI Market by End-use, 2025 - 2032, USD Million
- TABLE 318 Japan Explainable AI Market, 2021 - 2024, USD Million
- TABLE 319 Japan Explainable AI Market, 2025 - 2032, USD Million
- TABLE 320 Japan Explainable AI Market by Deployment, 2021 - 2024, USD Million
- TABLE 321 Japan Explainable AI Market by Deployment, 2025 - 2032, USD Million
- TABLE 322 Japan Explainable AI Market by Component, 2021 - 2024, USD Million
- TABLE 323 Japan Explainable AI Market by Component, 2025 - 2032, USD Million
- TABLE 324 Japan Explainable AI Market by Application, 2021 - 2024, USD Million
- TABLE 325 Japan Explainable AI Market by Application, 2025 - 2032, USD Million
- TABLE 326 Japan Explainable AI Market by End-use, 2021 - 2024, USD Million
- TABLE 327 Japan Explainable AI Market by End-use, 2025 - 2032, USD Million
- TABLE 328 India Explainable AI Market, 2021 - 2024, USD Million
- TABLE 329 India Explainable AI Market, 2025 - 2032, USD Million
- TABLE 330 India Explainable AI Market by Deployment, 2021 - 2024, USD Million
- TABLE 331 India Explainable AI Market by Deployment, 2025 - 2032, USD Million
- TABLE 332 India Explainable AI Market by Component, 2021 - 2024, USD Million
- TABLE 333 India Explainable AI Market by Component, 2025 - 2032, USD Million
- TABLE 334 India Explainable AI Market by Application, 2021 - 2024, USD Million
- TABLE 335 India Explainable AI Market by Application, 2025 - 2032, USD Million
- TABLE 336 India Explainable AI Market by End-use, 2021 - 2024, USD Million
- TABLE 337 India Explainable AI Market by End-use, 2025 - 2032, USD Million
- TABLE 338 South Korea Explainable AI Market, 2021 - 2024, USD Million
- TABLE 339 South Korea Explainable AI Market, 2025 - 2032, USD Million
- TABLE 340 South Korea Explainable AI Market by Deployment, 2021 - 2024, USD Million
- TABLE 341 South Korea Explainable AI Market by Deployment, 2025 - 2032, USD Million
- TABLE 342 South Korea Explainable AI Market by Component, 2021 - 2024, USD Million
- TABLE 343 South Korea Explainable AI Market by Component, 2025 - 2032, USD Million
- TABLE 344 South Korea Explainable AI Market by Application, 2021 - 2024, USD Million
- TABLE 345 South Korea Explainable AI Market by Application, 2025 - 2032, USD Million
- TABLE 346 South Korea Explainable AI Market by End-use, 2021 - 2024, USD Million
- TABLE 347 South Korea Explainable AI Market by End-use, 2025 - 2032, USD Million
- TABLE 348 Singapore Explainable AI Market, 2021 - 2024, USD Million
- TABLE 349 Singapore Explainable AI Market, 2025 - 2032, USD Million
- TABLE 350 Singapore Explainable AI Market by Deployment, 2021 - 2024, USD Million
- TABLE 351 Singapore Explainable AI Market by Deployment, 2025 - 2032, USD Million
- TABLE 352 Singapore Explainable AI Market by Component, 2021 - 2024, USD Million
- TABLE 353 Singapore Explainable AI Market by Component, 2025 - 2032, USD Million
- TABLE 354 Singapore Explainable AI Market by Application, 2021 - 2024, USD Million
- TABLE 355 Singapore Explainable AI Market by Application, 2025 - 2032, USD Million
- TABLE 356 Singapore Explainable AI Market by End-use, 2021 - 2024, USD Million
- TABLE 357 Singapore Explainable AI Market by End-use, 2025 - 2032, USD Million
- TABLE 358 Malaysia Explainable AI Market, 2021 - 2024, USD Million
- TABLE 359 Malaysia Explainable AI Market, 2025 - 2032, USD Million
- TABLE 360 Malaysia Explainable AI Market by Deployment, 2021 - 2024, USD Million
- TABLE 361 Malaysia Explainable AI Market by Deployment, 2025 - 2032, USD Million
- TABLE 362 Malaysia Explainable AI Market by Component, 2021 - 2024, USD Million
- TABLE 363 Malaysia Explainable AI Market by Component, 2025 - 2032, USD Million
- TABLE 364 Malaysia Explainable AI Market by Application, 2021 - 2024, USD Million
- TABLE 365 Malaysia Explainable AI Market by Application, 2025 - 2032, USD Million
- TABLE 366 Malaysia Explainable AI Market by End-use, 2021 - 2024, USD Million
- TABLE 367 Malaysia Explainable AI Market by End-use, 2025 - 2032, USD Million
- TABLE 368 Rest of Asia Pacific Explainable AI Market, 2021 - 2024, USD Million
- TABLE 369 Rest of Asia Pacific Explainable AI Market, 2025 - 2032, USD Million
- TABLE 370 Rest of Asia Pacific Explainable AI Market by Deployment, 2021 - 2024, USD Million
- TABLE 371 Rest of Asia Pacific Explainable AI Market by Deployment, 2025 - 2032, USD Million
- TABLE 372 Rest of Asia Pacific Explainable AI Market by Component, 2021 - 2024, USD Million
- TABLE 373 Rest of Asia Pacific Explainable AI Market by Component, 2025 - 2032, USD Million
- TABLE 374 Rest of Asia Pacific Explainable AI Market by Application, 2021 - 2024, USD Million
- TABLE 375 Rest of Asia Pacific Explainable AI Market by Application, 2025 - 2032, USD Million
- TABLE 376 Rest of Asia Pacific Explainable AI Market by End-use, 2021 - 2024, USD Million
- TABLE 377 Rest of Asia Pacific Explainable AI Market by End-use, 2025 - 2032, USD Million
- TABLE 378 LAMEA Explainable AI Market, 2021 - 2024, USD Million
- TABLE 379 LAMEA Explainable AI Market, 2025 - 2032, USD Million
- TABLE 380 LAMEA Explainable AI Market by Deployment, 2021 - 2024, USD Million
- TABLE 381 LAMEA Explainable AI Market by Deployment, 2025 - 2032, USD Million
- TABLE 382 LAMEA Cloud Market by Country, 2021 - 2024, USD Million
- TABLE 383 LAMEA Cloud Market by Country, 2025 - 2032, USD Million
- TABLE 384 LAMEA On-premise Market by Country, 2021 - 2024, USD Million
- TABLE 385 LAMEA On-premise Market by Country, 2025 - 2032, USD Million
- TABLE 386 LAMEA Explainable AI Market by Component, 2021 - 2024, USD Million
- TABLE 387 LAMEA Explainable AI Market by Component, 2025 - 2032, USD Million
- TABLE 388 LAMEA Solution Market by Country, 2021 - 2024, USD Million
- TABLE 389 LAMEA Solution Market by Country, 2025 - 2032, USD Million
- TABLE 390 LAMEA Services Market by Country, 2021 - 2024, USD Million
- TABLE 391 LAMEA Services Market by Country, 2025 - 2032, USD Million
- TABLE 392 LAMEA Explainable AI Market by Application, 2021 - 2024, USD Million
- TABLE 393 LAMEA Explainable AI Market by Application, 2025 - 2032, USD Million
- TABLE 394 LAMEA Fraud & Anomaly Detection Market by Country, 2021 - 2024, USD Million
- TABLE 395 LAMEA Fraud & Anomaly Detection Market by Country, 2025 - 2032, USD Million
- TABLE 396 LAMEA Drug Discovery & Diagnostics Market by Country, 2021 - 2024, USD Million
- TABLE 397 LAMEA Drug Discovery & Diagnostics Market by Country, 2025 - 2032, USD Million
- TABLE 398 LAMEA Predictive Maintenance Market by Country, 2021 - 2024, USD Million
- TABLE 399 LAMEA Predictive Maintenance Market by Country, 2025 - 2032, USD Million
- TABLE 400 LAMEA Supply Chain Management Market by Country, 2021 - 2024, USD Million
- TABLE 401 LAMEA Supply Chain Management Market by Country, 2025 - 2032, USD Million
- TABLE 402 LAMEA Identity, Access Management & Others Market by Country, 2021 - 2024, USD Million
- TABLE 403 LAMEA Identity, Access Management & Others Market by Country, 2025 - 2032, USD Million
- TABLE 404 LAMEA Explainable AI Market by End-use, 2021 - 2024, USD Million
- TABLE 405 LAMEA Explainable AI Market by End-use, 2025 - 2032, USD Million
- TABLE 406 LAMEA IT & Telecommunication Market by Country, 2021 - 2024, USD Million
- TABLE 407 LAMEA IT & Telecommunication Market by Country, 2025 - 2032, USD Million
- TABLE 408 LAMEA Healthcare Market by Country, 2021 - 2024, USD Million
- TABLE 409 LAMEA Healthcare Market by Country, 2025 - 2032, USD Million
- TABLE 410 LAMEA BFSI Market by Country, 2021 - 2024, USD Million
- TABLE 411 LAMEA BFSI Market by Country, 2025 - 2032, USD Million
- TABLE 412 LAMEA Aerospace & Defense Market by Country, 2021 - 2024, USD Million
- TABLE 413 LAMEA Aerospace & Defense Market by Country, 2025 - 2032, USD Million
- TABLE 414 LAMEA Retail & E-commerce Market by Country, 2021 - 2024, USD Million
- TABLE 415 LAMEA Retail & E-commerce Market by Country, 2025 - 2032, USD Million
- TABLE 416 LAMEA Public Sector & Utilities Market by Country, 2021 - 2024, USD Million
- TABLE 417 LAMEA Public Sector & Utilities Market by Country, 2025 - 2032, USD Million
- TABLE 418 LAMEA Automotive Market by Country, 2021 - 2024, USD Million
- TABLE 419 LAMEA Automotive Market by Country, 2025 - 2032, USD Million
- TABLE 420 LAMEA Other End-use Market by Country, 2021 - 2024, USD Million
- TABLE 421 LAMEA Other End-use Market by Country, 2025 - 2032, USD Million
- TABLE 422 LAMEA Explainable AI Market by Country, 2021 - 2024, USD Million
- TABLE 423 LAMEA Explainable AI Market by Country, 2025 - 2032, USD Million
- TABLE 424 Brazil Explainable AI Market, 2021 - 2024, USD Million
- TABLE 425 Brazil Explainable AI Market, 2025 - 2032, USD Million
- TABLE 426 Brazil Explainable AI Market by Deployment, 2021 - 2024, USD Million
- TABLE 427 Brazil Explainable AI Market by Deployment, 2025 - 2032, USD Million
- TABLE 428 Brazil Explainable AI Market by Component, 2021 - 2024, USD Million
- TABLE 429 Brazil Explainable AI Market by Component, 2025 - 2032, USD Million
- TABLE 430 Brazil Explainable AI Market by Application, 2021 - 2024, USD Million
- TABLE 431 Brazil Explainable AI Market by Application, 2025 - 2032, USD Million
- TABLE 432 Brazil Explainable AI Market by End-use, 2021 - 2024, USD Million
- TABLE 433 Brazil Explainable AI Market by End-use, 2025 - 2032, USD Million
- TABLE 434 Argentina Explainable AI Market, 2021 - 2024, USD Million
- TABLE 435 Argentina Explainable AI Market, 2025 - 2032, USD Million
- TABLE 436 Argentina Explainable AI Market by Deployment, 2021 - 2024, USD Million
- TABLE 437 Argentina Explainable AI Market by Deployment, 2025 - 2032, USD Million
- TABLE 438 Argentina Explainable AI Market by Component, 2021 - 2024, USD Million
- TABLE 439 Argentina Explainable AI Market by Component, 2025 - 2032, USD Million
- TABLE 440 Argentina Explainable AI Market by Application, 2021 - 2024, USD Million
- TABLE 441 Argentina Explainable AI Market by Application, 2025 - 2032, USD Million
- TABLE 442 Argentina Explainable AI Market by End-use, 2021 - 2024, USD Million
- TABLE 443 Argentina Explainable AI Market by End-use, 2025 - 2032, USD Million
- TABLE 444 UAE Explainable AI Market, 2021 - 2024, USD Million
- TABLE 445 UAE Explainable AI Market, 2025 - 2032, USD Million
- TABLE 446 UAE Explainable AI Market by Deployment, 2021 - 2024, USD Million
- TABLE 447 UAE Explainable AI Market by Deployment, 2025 - 2032, USD Million
- TABLE 448 UAE Explainable AI Market by Component, 2021 - 2024, USD Million
- TABLE 449 UAE Explainable AI Market by Component, 2025 - 2032, USD Million
- TABLE 450 UAE Explainable AI Market by Application, 2021 - 2024, USD Million
- TABLE 451 UAE Explainable AI Market by Application, 2025 - 2032, USD Million
- TABLE 452 UAE Explainable AI Market by End-use, 2021 - 2024, USD Million
- TABLE 453 UAE Explainable AI Market by End-use, 2025 - 2032, USD Million
- TABLE 454 Saudi Arabia Explainable AI Market, 2021 - 2024, USD Million
- TABLE 455 Saudi Arabia Explainable AI Market, 2025 - 2032, USD Million
- TABLE 456 Saudi Arabia Explainable AI Market by Deployment, 2021 - 2024, USD Million
- TABLE 457 Saudi Arabia Explainable AI Market by Deployment, 2025 - 2032, USD Million
- TABLE 458 Saudi Arabia Explainable AI Market by Component, 2021 - 2024, USD Million
- TABLE 459 Saudi Arabia Explainable AI Market by Component, 2025 - 2032, USD Million
- TABLE 460 Saudi Arabia Explainable AI Market by Application, 2021 - 2024, USD Million
- TABLE 461 Saudi Arabia Explainable AI Market by Application, 2025 - 2032, USD Million
- TABLE 462 Saudi Arabia Explainable AI Market by End-use, 2021 - 2024, USD Million
- TABLE 463 Saudi Arabia Explainable AI Market by End-use, 2025 - 2032, USD Million
- TABLE 464 South Africa Explainable AI Market, 2021 - 2024, USD Million
- TABLE 465 South Africa Explainable AI Market, 2025 - 2032, USD Million
- TABLE 466 South Africa Explainable AI Market by Deployment, 2021 - 2024, USD Million
- TABLE 467 South Africa Explainable AI Market by Deployment, 2025 - 2032, USD Million
- TABLE 468 South Africa Explainable AI Market by Component, 2021 - 2024, USD Million
- TABLE 469 South Africa Explainable AI Market by Component, 2025 - 2032, USD Million
- TABLE 470 South Africa Explainable AI Market by Application, 2021 - 2024, USD Million
- TABLE 471 South Africa Explainable AI Market by Application, 2025 - 2032, USD Million
- TABLE 472 South Africa Explainable AI Market by End-use, 2021 - 2024, USD Million
- TABLE 473 South Africa Explainable AI Market by End-use, 2025 - 2032, USD Million
- TABLE 474 Nigeria Explainable AI Market, 2021 - 2024, USD Million
- TABLE 475 Nigeria Explainable AI Market, 2025 - 2032, USD Million
- TABLE 476 Nigeria Explainable AI Market by Deployment, 2021 - 2024, USD Million
- TABLE 477 Nigeria Explainable AI Market by Deployment, 2025 - 2032, USD Million
- TABLE 478 Nigeria Explainable AI Market by Component, 2021 - 2024, USD Million
- TABLE 479 Nigeria Explainable AI Market by Component, 2025 - 2032, USD Million
- TABLE 480 Nigeria Explainable AI Market by Application, 2021 - 2024, USD Million
- TABLE 481 Nigeria Explainable AI Market by Application, 2025 - 2032, USD Million
- TABLE 482 Nigeria Explainable AI Market by End-use, 2021 - 2024, USD Million
- TABLE 483 Nigeria Explainable AI Market by End-use, 2025 - 2032, USD Million
- TABLE 484 Rest of LAMEA Explainable AI Market, 2021 - 2024, USD Million
- TABLE 485 Rest of LAMEA Explainable AI Market, 2025 - 2032, USD Million
- TABLE 486 Rest of LAMEA Explainable AI Market by Deployment, 2021 - 2024, USD Million
- TABLE 487 Rest of LAMEA Explainable AI Market by Deployment, 2025 - 2032, USD Million
- TABLE 488 Rest of LAMEA Explainable AI Market by Component, 2021 - 2024, USD Million
- TABLE 489 Rest of LAMEA Explainable AI Market by Component, 2025 - 2032, USD Million
- TABLE 490 Rest of LAMEA Explainable AI Market by Application, 2021 - 2024, USD Million
- TABLE 491 Rest of LAMEA Explainable AI Market by Application, 2025 - 2032, USD Million
- TABLE 492 Rest of LAMEA Explainable AI Market by End-use, 2021 - 2024, USD Million
- TABLE 493 Rest of LAMEA Explainable AI Market by End-use, 2025 - 2032, USD Million
- TABLE 494 Key Information - Microsoft Corporation
- TABLE 495 Key Information - IBM Corporation
- TABLE 496 Key Information - Google LLC
- TABLE 497 Key Information - Salesforce, Inc.
- TABLE 498 Key Information - Intel Corporation
- TABLE 499 Key Information - NVIDIA Corporation
- TABLE 500 Key Information - SAS Institute, Inc.
- TABLE 501 Key Information - Databricks, Inc.
- TABLE 502 Key Information - Amazon Web Services, Inc.
- TABLE 503 Key Information - SAP SE
LIST OF FIGURES
- FIG 1 Methodology for the research
- FIG 2 Global Explainable AI Market, 2021 - 2032, USD Million
- FIG 3 Key Factors Impacting Explainable AI Market
- FIG 4 KBV Cardinal Matrix
- FIG 5 Market Share Analysis, 2024
- FIG 6 Key Leading Strategies: Percentage Distribution (2021-2025)
- FIG 7 Key Strategic Move: (Partnerships, Collaborations & Agreements: 2022, dec - 2025, may) Leading Players
- FIG 8 Porter's Five Forces Analysis - Explainable AI Market
- FIG 9 Value Chain Analysis of Explainable AI Market
- FIG 10 Key Costumer Criteria - Explainable AI Market
- FIG 11 Global Explainable AI Market share by Deployment, 2024
- FIG 12 Global Explainable AI Market share by Deployment, 2032
- FIG 13 Global Explainable AI Market by Deployment, 2021 - 2032, USD Million
- FIG 14 Global Explainable AI Market share by Component, 2024
- FIG 15 Global Explainable AI Market share by Component, 2032
- FIG 16 Global Explainable AI Market by Component, 2021 - 2032, USD Million
- FIG 17 Global Explainable AI Market share by Application, 2024
- FIG 18 Global Explainable AI Market share by Application, 2032
- FIG 19 Global Explainable AI Market by Application, 2021 - 2032, USD Million
- FIG 20 Global Explainable AI Market share by End-use, 2024
- FIG 21 Global Explainable AI Market share by End-use, 2032
- FIG 22 Global Explainable AI Market by End-use, 2021 - 2032, USD Million
- FIG 23 Global Explainable AI Market share by Region, 2024
- FIG 24 Global Explainable AI Market share by Region, 2032
- FIG 25 Global Explainable AI Market by Region, 2021 - 2032, USD Million
- FIG 26 North America Explainable AI Market, 2021 - 2032, USD Million
- FIG 27 North America Explainable AI Market share by Deployment, 2024
- FIG 28 North America Explainable AI Market share by Deployment, 2032
- FIG 29 North America Explainable AI Market by Deployment, 2021 - 2032, USD Million
- FIG 30 North America Explainable AI Market share by Component, 2024
- FIG 31 North America Explainable AI Market share by Component, 2032
- FIG 32 North America Explainable AI Market by Component, 2021 - 2032, USD Million
- FIG 33 North America Explainable AI Market share by Application, 2024
- FIG 34 North America Explainable AI Market share by Application, 2032
- FIG 35 North America Explainable AI Market by Application, 2021 - 2032, USD Million
- FIG 36 North America Explainable AI Market share by End-use, 2024
- FIG 37 North America Explainable AI Market share by End-use, 2032
- FIG 38 North America Explainable AI Market by End-use, 2021 - 2032, USD Million
- FIG 39 North America Explainable AI Market share by Country, 2024
- FIG 40 North America Explainable AI Market share by Country, 2032
- FIG 41 North America Explainable AI Market by Country, 2021 - 2032, USD Million
- FIG 42 Europe Explainable AI Market, 2021 - 2032, USD Million
- FIG 43 Europe Explainable AI Market share by Deployment, 2024
- FIG 44 Europe Explainable AI Market share by Deployment, 2032
- FIG 45 Europe Explainable AI Market by Deployment, 2021 - 2032, USD Million
- FIG 46 Europe Explainable AI Market share by Component, 2024
- FIG 47 Europe Explainable AI Market share by Component, 2032
- FIG 48 Europe Explainable AI Market by Component, 2021 - 2032, USD Million
- FIG 49 Europe Explainable AI Market share by Application, 2024
- FIG 50 Europe Explainable AI Market share by Application, 2032
- FIG 51 Europe Explainable AI Market by Application, 2021 - 2032, USD Million
- FIG 52 Europe Explainable AI Market share by End-use, 2024
- FIG 53 Europe Explainable AI Market share by End-use, 2032
- FIG 54 Europe Explainable AI Market by End-use, 2021 - 2032, USD Million
- FIG 55 Europe Explainable AI Market share by Country, 2024
- FIG 56 Europe Explainable AI Market share by Country, 2032
- FIG 57 Europe Explainable AI Market by Country, 2021 - 2032, USD Million
- FIG 58 Asia Pacific Explainable AI Market, 2021 - 2032, USD Million
- FIG 59 Asia Pacific Explainable AI Market share by Deployment, 2024
- FIG 60 Asia Pacific Explainable AI Market share by Deployment, 2032
- FIG 61 Asia Pacific Explainable AI Market by Deployment, 2021 - 2032, USD Million
- FIG 62 Asia Pacific Explainable AI Market share by Component, 2024
- FIG 63 Asia Pacific Explainable AI Market share by Component, 2032
- FIG 64 Asia Pacific Explainable AI Market by Component, 2021 - 2032, USD Million
- FIG 65 Asia Pacific Explainable AI Market share by Application, 2024
- FIG 66 Asia Pacific Explainable AI Market share by Application, 2032
- FIG 67 Asia Pacific Explainable AI Market by Application, 2021 - 2032, USD Million
- FIG 68 Asia Pacific Explainable AI Market share by End-use, 2024
- FIG 69 Asia Pacific Explainable AI Market share by End-use, 2032
- FIG 70 Asia Pacific Explainable AI Market by End-use, 2021 - 2032, USD Million
- FIG 71 Asia Pacific Explainable AI Market share by Country, 2024
- FIG 72 Asia Pacific Explainable AI Market share by Country, 2032
- FIG 73 Asia Pacific Explainable AI Market by Country, 2021 - 2032, USD Million
- FIG 74 LAMEA Explainable AI Market, 2021 - 2032, USD Million
- FIG 75 LAMEA Explainable AI Market share by Deployment, 2024
- FIG 76 LAMEA Explainable AI Market share by Deployment, 2032
- FIG 77 LAMEA Explainable AI Market by Deployment, 2021 - 2032, USD Million
- FIG 78 LAMEA Explainable AI Market share by Component, 2024
- FIG 79 LAMEA Explainable AI Market share by Component, 2032
- FIG 80 LAMEA Explainable AI Market by Component, 2021 - 2032, USD Million
- FIG 81 LAMEA Explainable AI Market share by Application, 2024
- FIG 82 LAMEA Explainable AI Market share by Application, 2032
- FIG 83 LAMEA Explainable AI Market by Application, 2021 - 2032, USD Million
- FIG 84 LAMEA Explainable AI Market share by End-use, 2024
- FIG 85 LAMEA Explainable AI Market share by End-use, 2032
- FIG 86 LAMEA Explainable AI Market by End-use, 2021 - 2032, USD Million
- FIG 87 LAMEA Explainable AI Market share by Country, 2024
- FIG 88 LAMEA Explainable AI Market share by Country, 2032
- FIG 89 LAMEA Explainable AI Market by Country, 2021 - 2032, USD Million
- FIG 90 Recent strategies and developments: Microsoft Corporation
- FIG 91 SWOT Analysis: Microsoft Corporation
- FIG 92 Recent strategies and developments: IBM Corporation
- FIG 93 SWOT Analysis: IBM Corporation
- FIG 94 SWOT Analysis: Google LLC
- FIG 95 SWOT Analysis: Salesforce, Inc.
- FIG 96 SWOT Analysis: Intel corporation
- FIG 97 SWOT Analysis: NVIDIA Corporation
- FIG 98 SWOT Analysis: SAS INSTITUTE, INC.
- FIG 99 SWOT Analysis: Amazon Web Services, Inc.
- FIG 100 SWOT Analysis: SAP SE
The Global Explainable AI Market size is expected to reach $22.20 billion by 2032, rising at a market growth of 20.4% CAGR during the forecast period.
The IT & telecommunication sector leads the explainable AI market due to its early and extensive adoption of advanced AI technologies for network optimization, cybersecurity, customer service, and fraud detection. The industry's complex data environments require AI models whose decisions can be interpreted and trusted by engineers, clients, and regulators alike. Explainable AI helps these organizations troubleshoot issues, ensure fair decision-making in automated systems, and meet regulatory standards for transparency. The sector's commitment to digital transformation and data-driven decision-making continues to drive robust demand for explainable AI solutions. Thus, the IT & telecommunication segment procured 21% revenue share in the market in 2024.
The major strategies followed by the market participants are Partnerships as the key developmental strategy to keep pace with the changing demands of end users. For instance, In May, 2025, IBM Corporation teamed up with AWS, a cloud computing company to deliver agentic AI capabilities, integrating IBM's watsonx Orchestrate with Amazon Q index for enhanced AI decision-making. They offer pre-built domain agents, AI governance tools, and software on AWS Marketplace, enabling scalable, trustworthy, and explainable AI to transform enterprise automation and workflows. Additionally, In May, 2025, SAS Institute Inc. announced the partnership with Microsoft, an IT company to launch AI-driven decision-making tools like SAS Decision Builder and Viya Copilot. These tools integrate AI models within Microsoft Fabric and Azure, enhancing enterprise analytics with transparency, control, and human oversight, while exploring quantum AI's future potential in complex simulations.
Based on the Analysis presented in the KBV Cardinal matrix; Google LLC, Microsoft Corporation, NVIDIA Corporation, and Amazon Web Services, Inc. are the forerunners in the Explainable AI Market. Companies such as Salesforce, Inc., IBM Corporation, and SAP SE are some of the key innovators in Explainable AI Market. In May, 2025, Microsoft Corporation announced the partnership with Accenture, an IT company to deploy Azure AI Foundry, enabling scalable, explainable, and secure generative AI solutions. With over 75 use cases across industries and 16 in production, the platform reduced development time by 50%, boosted efficiency, ensured compliance, and strengthened responsible AI through observability, red teaming, and content safety.
COVID 19 Impact Analysis
During the initial phase of the COVID-19 pandemic, the explainable AI (XAI) market experienced significant setbacks. Many organizations across industries prioritized operational continuity and business survival over innovation and digital transformation. As a result, the adoption of advanced AI solutions, including XAI, slowed considerably. Budget constraints and economic uncertainties forced companies to delay or cancel projects related to AI explainability, as investments were redirected toward more immediate concerns, such as enabling remote work and maintaining core operations. Overall, the COVID-19 crisis resulted in a negative, albeit temporary, impact on the explainable AI market, delaying its anticipated growth trajectory. Thus, the COVID-19 pandemic had negative impact on the market.
Market Growth Factors
One of the most significant drivers propelling the Explainable AI (XAI) market is the increasing global focus on regulatory compliance and transparency requirements across industries. As artificial intelligence systems are being embedded deeper into decision-making processes in sectors such as finance, healthcare, insurance, and the public sector, there is mounting pressure from regulators to ensure these decisions are both fair and understandable. In conclusion, stricter regulations and growing demands for transparency are accelerating Explainable AI adoption, making compliance a key driver in the market.
Additionally, trust is a cornerstone of technological adoption, and in the context of artificial intelligence, it is both vital and elusive. The third major driver for the Explainable AI market is the critical need to build and maintain user trust in AI-powered systems. As AI technologies increasingly influence decisions in everyday life-from loan approvals and medical diagnoses to legal recommendations and personalized marketing-the demand for transparency and understandable reasoning is growing among end-users. Black-box AI models, while powerful, often fail to gain user confidence because stakeholders cannot easily interpret how conclusions are reached or assess their reliability. In conclusion, building trust through explainability is emerging as a critical enabler of AI adoption, empowering users, organizations, and markets to harness the full potential of artificial intelligence with confidence, clarity, and peace of mind.
Market Restraining Factors
However, A fundamental restraint on the widespread adoption of Explainable AI is the persistent trade-off between model explainability and predictive accuracy, particularly in complex, real-world applications. The most accurate AI models today-especially deep learning architectures such as neural networks, ensemble methods like random forests, and advanced gradient boosting algorithms-are often referred to as "black box" models. Their internal workings are highly complex, featuring layers upon layers of parameters and nonlinear transformations that are exceedingly difficult for humans to interpret. While these models typically achieve state-of-the-art performance on tasks ranging from image recognition and natural language processing to fraud detection, their opacity means the rationale behind any specific prediction is largely inscrutable to the end-user. In conclusion, the trade-off between explainability and model accuracy limits where explainable AI can be used, forcing organizations to choose between transparency and optimal performance.
Value Chain Analysis
The Explainable AI (XAI) Market value chain begins with Research & Development (R&D), which focuses on model transparency, fairness, and interpretability. This flows into Technology Development and Integration, where explainability tools and AI algorithms are embedded into systems. Data Acquisition and Management ensures high-quality, unbiased datasets that fuel XAI models. In Productization and Service Development, these technologies are turned into deployable, user-friendly solutions. Sales, Marketing, and Distribution drive adoption, while Regulatory Compliance and Ethics ensure trust, privacy, and fairness. Continuous Customer Support and Feedback feeds back into R&D, fostering iterative innovation.
Market Share Analysis
Deployment Outlook
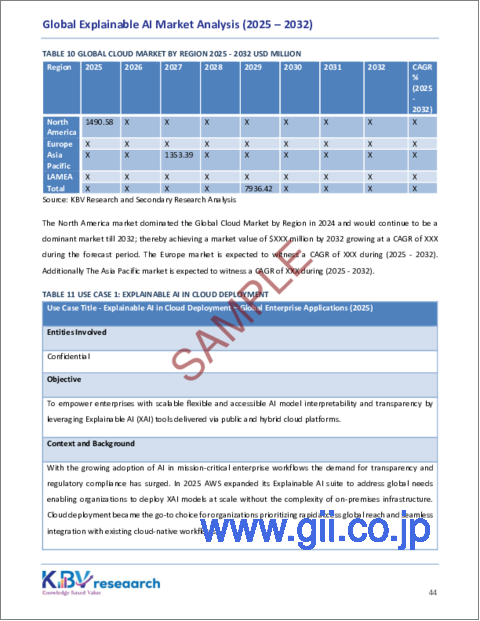
Based on deployment, the market is characterized into cloud and on-premise. The cloud segment garnered 63% revenue share in the market in 2024. Cloud-based explainable AI solutions offer unparalleled scalability and flexibility, enabling organizations to deploy and manage AI models without the need for extensive on-premise infrastructure. This is especially beneficial for businesses with fluctuating computational requirements, as cloud platforms allow for rapid provisioning of resources based on demand.
Component Outlook
On the basis of component, the market is classified into solution and services. The services segment recorded 19% revenue share in the market in 2024. It plays a vital supporting role in the XAI market. Services include consulting, implementation, integration, maintenance, and training. The demand for these services is being driven by organizations that require expert guidance to select, customize, and optimize XAI solutions for their specific needs. Many enterprises lack in-house expertise in AI explainability, making professional services essential for successful adoption and ongoing management.
Application Outlook
By application, the market is divided into fraud & anomaly detection, drug discovery & diagnostics, predictive maintenance, supply chain management, identity access management & others. The identity access management & others segment held 22% revenue share in the market in 2024. This encompasses a broad range of applications, including cybersecurity, human resources, and regulatory compliance. In IAM, explainable AI helps organizations monitor user behaviors, detect unusual access patterns, and justify access decisions-crucial for maintaining robust security postures and meeting compliance requirements.
End Use Outlook
Based on end-use, the market is segmented into IT & telecommunication, healthcare, BFSI, aerospace & defense, retail & e-commerce, public sector & utilities, automotive, and others. The BFSI segment attained 15% revenue share in the market in 2024. The BFSI segment relies heavily on explainable AI to address regulatory compliance, fraud detection, credit scoring, and risk assessment. Financial institutions face stringent requirements to demonstrate how decisions are made-especially when denying loans, flagging transactions, or making investment recommendations. Explainable AI ensures transparency, reduces bias, and builds trust with both customers and regulators. As digital banking and fintech adoption accelerates, so does the need for AI models that can clearly justify their actions and predictions.
Regional Outlook
Region-wise, the market is analyzed across North America, Europe, Asia Pacific, and LAMEA. The North America segment recorded the largest revenue share in the market in 2024. North America dominates the explainable AI market owing to its early adoption of advanced AI technologies, robust investment climate, and a highly developed digital infrastructure. The region is home to many leading technology firms, research institutions, and AI startups, especially in the United States and Canada.
Recent Strategies Deployed in the Market
- Mar-2025: IBM Corporation unveiled Granite 3.2, an advanced, efficient large language model with enhanced reasoning and vision-language capabilities. It offers cost-effective AI for enterprises, matching larger models in performance. Features include chain of thought reasoning, verbalized confidence for safety, and customization via IBM's Docling toolkit, supporting document-heavy workflows.
- May-2025: Microsoft Corporation announced the partnership with Accenture, an IT company to deploy Azure AI Foundry, enabling scalable, explainable, and secure generative AI solutions. With over 75 use cases across industries and 16 in production, the platform reduced development time by 50%, boosted efficiency, ensured compliance, and strengthened responsible AI through observability, red teaming, and content safety.
- May-2025: Microsoft Corporation unveiled AI agent orchestrator, streamlines cancer care by coordinating multimodal healthcare data and workflows like tumor boards. It enhances clinical decisions, integrates with tools like Teams, and offers explainability in AI outputs. Leading medical institutions are exploring its impact on oncology and complex care.
- May-2025: IBM Corporation teamed up with AWS, a cloud computig company to deliver agentic AI capabilities, integrating IBM's watsonx Orchestrate with Amazon Q index for enhanced AI decision-making. They offer pre-built domain agents, AI governance tools, and software on AWS Marketplace, enabling scalable, trustworthy, and explainable AI to transform enterprise automation and workflows.
- May-2025: SAS Institute Inc. announced a partnership with Microsoft, an IT company to launch AI-driven decision-making tools like SAS Decision Builder and Viya Copilot. These tools integrate AI models within Microsoft Fabric and Azure, enhancing enterprise analytics with transparency, control, and human oversight, while exploring quantum AI's future potential in complex simulations.
- Apr-2025: Databricks, Inc. teamed up with Kinaxis, a software company to enhance AI-powered supply chain orchestration. Combining Kinaxis Maestro(TM) with Databricks' platform enables unified data, faster insights, and scalable AI. This collaboration improves supply chain agility, transparency, and decision-making, helping businesses respond swiftly to disruptions with explainable, traceable AI.
- Feb-2025: Google LLC teamed up with Salesforce, a software company by integrating Google's Gemini AI models into Salesforce's Agentforce platform. This collaboration enhances AI flexibility, trust, and innovation, enabling multimodal capabilities, faster responses, and seamless integration across systems, empowering businesses with advanced automation and improved customer interactions.
List of Key Companies Profiled
- Microsoft Corporation
- IBM Corporation
- Google LLC (Alphabet Inc.)
- Salesforce, Inc.
- Intel Corporation
- NVIDIA Corporation
- SAS Institute Inc.
- Databricks, Inc.
- Amazon Web Services, Inc.
- SAP SE
Global Explainable AI Market Report Segmentation
By Deployment
- Cloud
- On-premise
By Component
- Solution
- Services
By Application
- Fraud & Anomaly Detection
- Drug Discovery & Diagnostics
- Predictive Maintenance
- Supply Chain Management
- Identity, Access Management & Others
By End-Use
- IT & Telecommunication
- Healthcare
- BFSI
- Aerospace & Defense
- Retail & E-commerce
- Public Sector & Utilities
- Automotive
- Other End-use
By Geography
- North America
- US
- Canada
- Mexico
- Rest of North America
- Europe
- Germany
- UK
- France
- Russia
- Spain
- Italy
- Rest of Europe
- Asia Pacific
- China
- Japan
- India
- South Korea
- Singapore
- Malaysia
- Rest of Asia Pacific
- LAMEA
- Brazil
- Argentina
- UAE
- Saudi Arabia
- South Africa
- Nigeria
- Rest of LAMEA
Table of Contents
Chapter 1. Market Scope & Methodology
- 1.1 Market Definition
- 1.2 Objectives
- 1.3 Market Scope
- 1.4 Segmentation
- 1.4.1 Global Explainable AI Market, by Deployment
- 1.4.2 Global Explainable AI Market, by Component
- 1.4.3 Global Explainable AI Market, by Application
- 1.4.4 Global Explainable AI Market, by End-Use
- 1.4.5 Global Explainable AI Market, by Geography
- 1.5 Methodology for the research
Chapter 2. Market at a Glance
- 2.1 Key Highlights
Chapter 3. Market Overview
- 3.1 Introduction
- 3.1.1 Overview
- 3.1.1.1 Market Composition and Scenario
- 3.1.1 Overview
- 3.2 Key Factors Impacting the Market
- 3.2.1 Market Drivers
- 3.2.2 Market Restraints
- 3.2.3 Market Opportunities
- 3.2.4 Market Challenges
Chapter 4. Competition Analysis - Global
- 4.1 KBV Cardinal Matrix
- 4.2 Recent Industry Wide Strategic Developments
- 4.2.1 Partnerships, Collaborations and Agreements
- 4.2.2 Product Launches and Product Expansions
- 4.2.3 Acquisition and Mergers
- 4.3 Market Share Analysis, 2024
- 4.4 Top Winning Strategies
- 4.4.1 Key Leading Strategies: Percentage Distribution (2021-2025)
- 4.4.2 Key Strategic Move: (Partnerships, Collaborations & Agreements: 2022, Dec - 2025, May) Leading Players
- 4.5 Porter Five Forces Analysis
Chapter 5. Value Chain Analysis of Explainable AI Market
- 5.1 Research and Development (R&D)
- 5.2 Technology Development and Integration
- 5.3 Data Acquisition and Management
- 5.4 Productization and Service Development
- 5.5 Regulatory Compliance and Ethics
- 5.6 Sales, Marketing, and Distribution
- 5.7 Customer Support and Feedback
Chapter 6. Key Costumer Criteria - Explainable AI Market
Chapter 7. Global Explainable AI Market by Deployment
- 7.1 Global Cloud Market by Region
- 7.2 Global On-premise Market by Region
Chapter 8. Global Explainable AI Market by Component
- 8.1 Global Solution Market by Region
- 8.2 Global Services Market by Region
Chapter 9. Global Explainable AI Market by Application
- 9.1 Global Fraud & Anomaly Detection Market by Region
- 9.2 Global Drug Discovery & Diagnostics Market by Region
- 9.3 Global Predictive Maintenance Market by Region
- 9.4 Global Supply Chain Management Market by Region
- 9.5 Global Identity, Access Management & Others Market by Region
Chapter 10. Global Explainable AI Market by End-use
- 10.1 Global IT & Telecommunication Market by Region
- 10.2 Global Healthcare Market by Region
- 10.3 Global BFSI Market by Region
- 10.4 Global Aerospace & Defense Market by Region
- 10.5 Global Retail & E-commerce Market by Region
- 10.6 Global Public Sector & Utilities Market by Region
- 10.7 Global Automotive Market by Region
- 10.8 Global Other End-use Market by Region
Chapter 11. Global Explainable AI Market by Region
- 11.1 North America Explainable AI Market
- 11.1.1 North America Explainable AI Market by Deployment
- 11.1.1.1 North America Cloud Market by Region
- 11.1.1.2 North America On-premise Market by Region
- 11.1.2 North America Explainable AI Market by Component
- 11.1.2.1 North America Solution Market by Country
- 11.1.2.2 North America Services Market by Country
- 11.1.3 North America Explainable AI Market by Application
- 11.1.3.1 North America Fraud & Anomaly Detection Market by Country
- 11.1.3.2 North America Drug Discovery & Diagnostics Market by Country
- 11.1.3.3 North America Predictive Maintenance Market by Country
- 11.1.3.4 North America Supply Chain Management Market by Country
- 11.1.3.5 North America Identity, Access Management & Others Market by Country
- 11.1.4 North America Explainable AI Market by End-use
- 11.1.4.1 North America IT & Telecommunication Market by Country
- 11.1.4.2 North America Healthcare Market by Country
- 11.1.4.3 North America BFSI Market by Country
- 11.1.4.4 North America Aerospace & Defense Market by Country
- 11.1.4.5 North America Retail & E-commerce Market by Country
- 11.1.4.6 North America Public Sector & Utilities Market by Country
- 11.1.4.7 North America Automotive Market by Country
- 11.1.4.8 North America Other End-use Market by Country
- 11.1.5 North America Explainable AI Market by Country
- 11.1.5.1 US Explainable AI Market
- 11.1.5.1.1 US Explainable AI Market by Deployment
- 11.1.5.1.2 US Explainable AI Market by Component
- 11.1.5.1.3 US Explainable AI Market by Application
- 11.1.5.1.4 US Explainable AI Market by End-use
- 11.1.5.2 Canada Explainable AI Market
- 11.1.5.2.1 Canada Explainable AI Market by Deployment
- 11.1.5.2.2 Canada Explainable AI Market by Component
- 11.1.5.2.3 Canada Explainable AI Market by Application
- 11.1.5.2.4 Canada Explainable AI Market by End-use
- 11.1.5.3 Mexico Explainable AI Market
- 11.1.5.3.1 Mexico Explainable AI Market by Deployment
- 11.1.5.3.2 Mexico Explainable AI Market by Component
- 11.1.5.3.3 Mexico Explainable AI Market by Application
- 11.1.5.3.4 Mexico Explainable AI Market by End-use
- 11.1.5.4 Rest of North America Explainable AI Market
- 11.1.5.4.1 Rest of North America Explainable AI Market by Deployment
- 11.1.5.4.2 Rest of North America Explainable AI Market by Component
- 11.1.5.4.3 Rest of North America Explainable AI Market by Application
- 11.1.5.4.4 Rest of North America Explainable AI Market by End-use
- 11.1.5.1 US Explainable AI Market
- 11.1.1 North America Explainable AI Market by Deployment
- 11.2 Europe Explainable AI Market
- 11.2.1 Europe Explainable AI Market by Deployment
- 11.2.1.1 Europe Cloud Market by Country
- 11.2.1.2 Europe On-premise Market by Country
- 11.2.2 Europe Explainable AI Market by Component
- 11.2.2.1 Europe Solution Market by Country
- 11.2.2.2 Europe Services Market by Country
- 11.2.3 Europe Explainable AI Market by Application
- 11.2.3.1 Europe Fraud & Anomaly Detection Market by Country
- 11.2.3.2 Europe Drug Discovery & Diagnostics Market by Country
- 11.2.3.3 Europe Predictive Maintenance Market by Country
- 11.2.3.4 Europe Supply Chain Management Market by Country
- 11.2.3.5 Europe Identity, Access Management & Others Market by Country
- 11.2.4 Europe Explainable AI Market by End-use
- 11.2.4.1 Europe IT & Telecommunication Market by Country
- 11.2.4.2 Europe Healthcare Market by Country
- 11.2.4.3 Europe BFSI Market by Country
- 11.2.4.4 Europe Aerospace & Defense Market by Country
- 11.2.4.5 Europe Retail & E-commerce Market by Country
- 11.2.4.6 Europe Public Sector & Utilities Market by Country
- 11.2.4.7 Europe Automotive Market by Country
- 11.2.4.8 Europe Other End-use Market by Country
- 11.2.5 Europe Explainable AI Market by Country
- 11.2.5.1 Germany Explainable AI Market
- 11.2.5.1.1 Germany Explainable AI Market by Deployment
- 11.2.5.1.2 Germany Explainable AI Market by Component
- 11.2.5.1.3 Germany Explainable AI Market by Application
- 11.2.5.1.4 Germany Explainable AI Market by End-use
- 11.2.5.2 UK Explainable AI Market
- 11.2.5.2.1 UK Explainable AI Market by Deployment
- 11.2.5.2.2 UK Explainable AI Market by Component
- 11.2.5.2.3 UK Explainable AI Market by Application
- 11.2.5.2.4 UK Explainable AI Market by End-use
- 11.2.5.3 France Explainable AI Market
- 11.2.5.3.1 France Explainable AI Market by Deployment
- 11.2.5.3.2 France Explainable AI Market by Component
- 11.2.5.3.3 France Explainable AI Market by Application
- 11.2.5.3.4 France Explainable AI Market by End-use
- 11.2.5.4 Russia Explainable AI Market
- 11.2.5.4.1 Russia Explainable AI Market by Deployment
- 11.2.5.4.2 Russia Explainable AI Market by Component
- 11.2.5.4.3 Russia Explainable AI Market by Application
- 11.2.5.4.4 Russia Explainable AI Market by End-use
- 11.2.5.5 Spain Explainable AI Market
- 11.2.5.5.1 Spain Explainable AI Market by Deployment
- 11.2.5.5.2 Spain Explainable AI Market by Component
- 11.2.5.5.3 Spain Explainable AI Market by Application
- 11.2.5.5.4 Spain Explainable AI Market by End-use
- 11.2.5.6 Italy Explainable AI Market
- 11.2.5.6.1 Italy Explainable AI Market by Deployment
- 11.2.5.6.2 Italy Explainable AI Market by Component
- 11.2.5.6.3 Italy Explainable AI Market by Application
- 11.2.5.6.4 Italy Explainable AI Market by End-use
- 11.2.5.7 Rest of Europe Explainable AI Market
- 11.2.5.7.1 Rest of Europe Explainable AI Market by Deployment
- 11.2.5.7.2 Rest of Europe Explainable AI Market by Component
- 11.2.5.7.3 Rest of Europe Explainable AI Market by Application
- 11.2.5.7.4 Rest of Europe Explainable AI Market by End-use
- 11.2.5.1 Germany Explainable AI Market
- 11.2.1 Europe Explainable AI Market by Deployment
- 11.3 Asia Pacific Explainable AI Market
- 11.3.1 Asia Pacific Explainable AI Market by Deployment
- 11.3.1.1 Asia Pacific Cloud Market by Country
- 11.3.1.2 Asia Pacific On-premise Market by Country
- 11.3.2 Asia Pacific Explainable AI Market by Component
- 11.3.2.1 Asia Pacific Solution Market by Country
- 11.3.2.2 Asia Pacific Services Market by Country
- 11.3.3 Asia Pacific Explainable AI Market by Application
- 11.3.3.1 Asia Pacific Fraud & Anomaly Detection Market by Country
- 11.3.3.2 Asia Pacific Drug Discovery & Diagnostics Market by Country
- 11.3.3.3 Asia Pacific Predictive Maintenance Market by Country
- 11.3.3.4 Asia Pacific Supply Chain Management Market by Country
- 11.3.3.5 Asia Pacific Identity, Access Management & Others Market by Country
- 11.3.4 Asia Pacific Explainable AI Market by End-use
- 11.3.4.1 Asia Pacific IT & Telecommunication Market by Country
- 11.3.4.2 Asia Pacific Healthcare Market by Country
- 11.3.4.3 Asia Pacific BFSI Market by Country
- 11.3.4.4 Asia Pacific Aerospace & Defense Market by Country
- 11.3.4.5 Asia Pacific Retail & E-commerce Market by Country
- 11.3.4.6 Asia Pacific Public Sector & Utilities Market by Country
- 11.3.4.7 Asia Pacific Automotive Market by Country
- 11.3.4.8 Asia Pacific Other End-use Market by Country
- 11.3.5 Asia Pacific Explainable AI Market by Country
- 11.3.5.1 China Explainable AI Market
- 11.3.5.1.1 China Explainable AI Market by Deployment
- 11.3.5.1.2 China Explainable AI Market by Component
- 11.3.5.1.3 China Explainable AI Market by Application
- 11.3.5.1.4 China Explainable AI Market by End-use
- 11.3.5.2 Japan Explainable AI Market
- 11.3.5.2.1 Japan Explainable AI Market by Deployment
- 11.3.5.2.2 Japan Explainable AI Market by Component
- 11.3.5.2.3 Japan Explainable AI Market by Application
- 11.3.5.2.4 Japan Explainable AI Market by End-use
- 11.3.5.3 India Explainable AI Market
- 11.3.5.3.1 India Explainable AI Market by Deployment
- 11.3.5.3.2 India Explainable AI Market by Component
- 11.3.5.3.3 India Explainable AI Market by Application
- 11.3.5.3.4 India Explainable AI Market by End-use
- 11.3.5.4 South Korea Explainable AI Market
- 11.3.5.4.1 South Korea Explainable AI Market by Deployment
- 11.3.5.4.2 South Korea Explainable AI Market by Component
- 11.3.5.4.3 South Korea Explainable AI Market by Application
- 11.3.5.4.4 South Korea Explainable AI Market by End-use
- 11.3.5.5 Singapore Explainable AI Market
- 11.3.5.5.1 Singapore Explainable AI Market by Deployment
- 11.3.5.5.2 Singapore Explainable AI Market by Component
- 11.3.5.5.3 Singapore Explainable AI Market by Application
- 11.3.5.5.4 Singapore Explainable AI Market by End-use
- 11.3.5.6 Malaysia Explainable AI Market
- 11.3.5.6.1 Malaysia Explainable AI Market by Deployment
- 11.3.5.6.2 Malaysia Explainable AI Market by Component
- 11.3.5.6.3 Malaysia Explainable AI Market by Application
- 11.3.5.6.4 Malaysia Explainable AI Market by End-use
- 11.3.5.7 Rest of Asia Pacific Explainable AI Market
- 11.3.5.7.1 Rest of Asia Pacific Explainable AI Market by Deployment
- 11.3.5.7.2 Rest of Asia Pacific Explainable AI Market by Component
- 11.3.5.7.3 Rest of Asia Pacific Explainable AI Market by Application
- 11.3.5.7.4 Rest of Asia Pacific Explainable AI Market by End-use
- 11.3.5.1 China Explainable AI Market
- 11.3.1 Asia Pacific Explainable AI Market by Deployment
- 11.4 LAMEA Explainable AI Market
- 11.4.1 LAMEA Explainable AI Market by Deployment
- 11.4.1.1 LAMEA Cloud Market by Country
- 11.4.1.2 LAMEA On-premise Market by Country
- 11.4.2 LAMEA Explainable AI Market by Component
- 11.4.2.1 LAMEA Solution Market by Country
- 11.4.2.2 LAMEA Services Market by Country
- 11.4.3 LAMEA Explainable AI Market by Application
- 11.4.3.1 LAMEA Fraud & Anomaly Detection Market by Country
- 11.4.3.2 LAMEA Drug Discovery & Diagnostics Market by Country
- 11.4.3.3 LAMEA Predictive Maintenance Market by Country
- 11.4.3.4 LAMEA Supply Chain Management Market by Country
- 11.4.3.5 LAMEA Identity, Access Management & Others Market by Country
- 11.4.4 LAMEA Explainable AI Market by End-use
- 11.4.4.1 LAMEA IT & Telecommunication Market by Country
- 11.4.4.2 LAMEA Healthcare Market by Country
- 11.4.4.3 LAMEA BFSI Market by Country
- 11.4.4.4 LAMEA Aerospace & Defense Market by Country
- 11.4.4.5 LAMEA Retail & E-commerce Market by Country
- 11.4.4.6 LAMEA Public Sector & Utilities Market by Country
- 11.4.4.7 LAMEA Automotive Market by Country
- 11.4.4.8 LAMEA Other End-use Market by Country
- 11.4.5 LAMEA Explainable AI Market by Country
- 11.4.5.1 Brazil Explainable AI Market
- 11.4.5.1.1 Brazil Explainable AI Market by Deployment
- 11.4.5.1.2 Brazil Explainable AI Market by Component
- 11.4.5.1.3 Brazil Explainable AI Market by Application
- 11.4.5.1.4 Brazil Explainable AI Market by End-use
- 11.4.5.2 Argentina Explainable AI Market
- 11.4.5.2.1 Argentina Explainable AI Market by Deployment
- 11.4.5.2.2 Argentina Explainable AI Market by Component
- 11.4.5.2.3 Argentina Explainable AI Market by Application
- 11.4.5.2.4 Argentina Explainable AI Market by End-use
- 11.4.5.3 UAE Explainable AI Market
- 11.4.5.3.1 UAE Explainable AI Market by Deployment
- 11.4.5.3.2 UAE Explainable AI Market by Component
- 11.4.5.3.3 UAE Explainable AI Market by Application
- 11.4.5.3.4 UAE Explainable AI Market by End-use
- 11.4.5.4 Saudi Arabia Explainable AI Market
- 11.4.5.4.1 Saudi Arabia Explainable AI Market by Deployment
- 11.4.5.4.2 Saudi Arabia Explainable AI Market by Component
- 11.4.5.4.3 Saudi Arabia Explainable AI Market by Application
- 11.4.5.4.4 Saudi Arabia Explainable AI Market by End-use
- 11.4.5.5 South Africa Explainable AI Market
- 11.4.5.5.1 South Africa Explainable AI Market by Deployment
- 11.4.5.5.2 South Africa Explainable AI Market by Component
- 11.4.5.5.3 South Africa Explainable AI Market by Application
- 11.4.5.5.4 South Africa Explainable AI Market by End-use
- 11.4.5.6 Nigeria Explainable AI Market
- 11.4.5.6.1 Nigeria Explainable AI Market by Deployment
- 11.4.5.6.2 Nigeria Explainable AI Market by Component
- 11.4.5.6.3 Nigeria Explainable AI Market by Application
- 11.4.5.6.4 Nigeria Explainable AI Market by End-use
- 11.4.5.7 Rest of LAMEA Explainable AI Market
- 11.4.5.7.1 Rest of LAMEA Explainable AI Market by Deployment
- 11.4.5.7.2 Rest of LAMEA Explainable AI Market by Component
- 11.4.5.7.3 Rest of LAMEA Explainable AI Market by Application
- 11.4.5.7.4 Rest of LAMEA Explainable AI Market by End-use
- 11.4.5.1 Brazil Explainable AI Market
- 11.4.1 LAMEA Explainable AI Market by Deployment
Chapter 12. Company Profiles
- 12.1 Microsoft Corporation
- 12.1.1 Company Overview
- 12.1.2 Financial Analysis
- 12.1.3 Segmental and Regional Analysis
- 12.1.4 Research & Development Expenses
- 12.1.5 Recent strategies and developments:
- 12.1.5.1 Partnerships, Collaborations, and Agreements:
- 12.1.5.2 Product Launches and Product Expansions:
- 12.1.6 SWOT Analysis
- 12.2 IBM Corporation
- 12.2.1 Company Overview
- 12.2.2 Financial Analysis
- 12.2.3 Regional & Segmental Analysis
- 12.2.4 Research & Development Expenses
- 12.2.5 Recent strategies and developments:
- 12.2.5.1 Partnerships, Collaborations, and Agreements:
- 12.2.5.2 Product Launches and Product Expansions:
- 12.2.5.3 Acquisition and Mergers:
- 12.2.6 SWOT Analysis
- 12.3 Google LLC (Alphabet Inc.)
- 12.3.1 Company Overview
- 12.3.2 Financial Analysis
- 12.3.3 Segmental and Regional Analysis
- 12.3.4 Research & Development Expenses
- 12.3.5 Recent strategies and developments:
- 12.3.5.1 Partnerships, Collaborations, and Agreements:
- 12.3.6 SWOT Analysis
- 12.4 Salesforce, Inc.
- 12.4.1 Company Overview
- 12.4.2 Financial Analysis
- 12.4.3 Regional Analysis
- 12.4.4 Research & Development Expenses
- 12.4.5 SWOT Analysis
- 12.5 Intel Corporation
- 12.5.1 Company Overview
- 12.5.2 Financial Analysis
- 12.5.3 Segmental and Regional Analysis
- 12.5.4 Research & Development Expenses
- 12.5.5 Recent strategies and developments:
- 12.5.5.1 Partnerships, Collaborations, and Agreements:
- 12.5.6 SWOT Analysis
- 12.6 NVIDIA Corporation
- 12.6.1 Company Overview
- 12.6.2 Financial Analysis
- 12.6.3 Segmental and Regional Analysis
- 12.6.4 Research & Development Expenses
- 12.6.5 Recent strategies and developments:
- 12.6.5.1 Partnerships, Collaborations, and Agreements:
- 12.6.6 SWOT Analysis
- 12.7 SAS Institute, Inc.
- 12.7.1 Company Overview
- 12.7.2 Recent strategies and developments:
- 12.7.2.1 Partnerships, Collaborations, and Agreements:
- 12.7.3 SWOT Analysis
- 12.8 Databricks, Inc.
- 12.8.1 Company Overview
- 12.8.2 Recent strategies and developments:
- 12.8.2.1 Partnerships, Collaborations, and Agreements:
- 12.9 Amazon Web Services, Inc. (Amazon.com, Inc.)
- 12.9.1 Company Overview
- 12.9.2 Financial Analysis
- 12.9.3 Segmental and Regional Analysis
- 12.9.4 SWOT Analysis
- 12.10. SAP SE
- 12.10.1 Company Overview
- 12.10.2 Financial Analysis
- 12.10.3 Regional Analysis
- 12.10.4 Research & Development Expense
- 12.10.5 Recent strategies and developments:
- 12.10.5.1 Partnerships, Collaborations, and Agreements:
- 12.10.6 SWOT Analysis
