
|
市場調査レポート
商品コード
1787842
説明可能なAI市場:産業動向・世界の予測 (~2035年):コンポーネントタイプ・展開タイプ・用途・エンドユーザー・企業タイプ・地域別Explainable AI Market, Till 2035: Distribution by Type of Component, Type of Deployment, Type of Application, End-User, Type of Enterprise and Geographical Regions: Industry Trends and Global Forecasts |
||||||
カスタマイズ可能
|
|||||||
| 説明可能なAI市場:産業動向・世界の予測 (~2035年):コンポーネントタイプ・展開タイプ・用途・エンドユーザー・企業タイプ・地域別 |
|
出版日: 2025年08月11日
発行: Roots Analysis
ページ情報: 英文 168 Pages
納期: 7~10営業日
|

全表示
- 概要
- 目次
説明可能なAI市場:概要
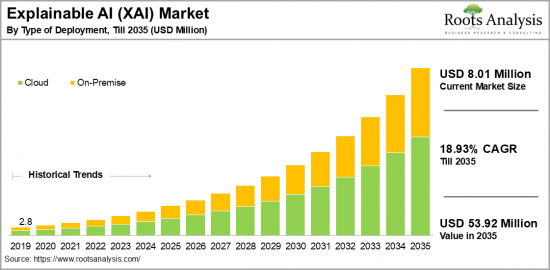
世界の説明可能なAIの市場規模は、現在の801万米ドルから、予測期間中はCAGR 18.93%で推移し、2035年には5,392万米ドルに成長すると予測されています。
説明可能なAI市場の機会:分類
コンポーネントタイプ別
- サービス
- ソリューション
展開タイプ別
- クラウド
- オンプレミス
用途別
- 創薬・診断
- 不正・異常検知
- アイデンティティとアクセス管理
- 予知保全
- サプライチェーン管理
- その他
エンドユーザー別
- 航空宇宙・防衛
- 自動車
- ヘルスケア
- IT・通信
- 公共部門・ユーティリティ
- 小売・eコマース
企業タイプ別
- 大企業
- 中小企業
地域別
- 北米
- 米国
- カナダ
- メキシコ
- その他の北米諸国
- 欧州
- オーストリア
- ベルギー
- デンマーク
- フランス
- ドイツ
- アイルランド
- イタリア
- オランダ
- ノルウェー
- ロシア
- スペイン
- スウェーデン
- スイス
- 英国
- その他の欧州諸国
- アジア
- 中国
- インド
- 日本
- シンガポール
- 韓国
- その他のアジア諸国
- ラテンアメリカ
- ブラジル
- チリ
- コロンビア
- ベネズエラ
- その他のラテンアメリカ諸国
- 中東・北アフリカ
- エジプト
- イラン
- イラク
- イスラエル
- クウェート
- サウジアラビア
- アラブ首長国連邦
- その他の中東・北アフリカ諸国
- 世界のその他の地域
- オーストラリア
- ニュージーランド
- その他の国
説明可能なAI市場:成長と動向
現在、AIユーザー数は2020年以降で2倍以上に増加し、世界で約3億人に達しています。これは、説明可能なコンピューティングとAIにおける透明性の融合における重要な節目を示しています。説明可能なAI(Explainable AI、XAI)は、AIアルゴリズムを理解可能にし、その意思決定の根拠を関係者が把握できるようにする手法を活用することで、さまざまな分野を変革すると見込まれています。説明可能なAIの主な利点には、モデル非依存型アプローチや、ユーザーの理解を促進し医療分野での創薬を加速させるインタラクティブな可視化などがあります。
さらに、説明可能なAIは、金融、医療、エネルギー、製造など複数の産業において、より深い洞察と緊急課題への効果的な解決策を提供することで、ビジネスのあり方を変えてきました。インターネットの普及や一般市民の認知度向上を背景に、主要分野でのAI活用は急速に拡大しています。
説明可能なAIは、より高い業務効率を達成するためのイノベーションとデジタルトランスフォーメーションへの世界的な移行において、重要性を増しています。自然言語処理や解釈可能な機械学習は、説明可能なAI市場の潜在能力を最大限に引き出す上で重要な役割を果たし、エネルギー効率の向上や迅速な対応に貢献しています。さらに、SHAPやLIMEといった手法は、複雑なAIモデルの解釈性を高め、AIシステムへの信頼性を向上させ、さまざまな分野での意思決定プロセス改善への道を開いており、現代における重要な発展を示しています。その結果、技術の進歩と投資関心の高まりを背景に、説明可能なAI市場は予測期間中に大きな成長を遂げると見込まれます。
当レポートでは、世界の説明可能なAIの市場を調査し、 市場概要、背景、市場影響因子の分析、市場規模の推移・予測、各種区分・地域別の詳細分析、競合情勢、主要企業のプロファイルなどをまとめています。
目次
セクションI:レポート概要
第1章 序文
第2章 調査手法
第3章 市場力学
第4章 マクロ経済指標
セクションII:定性的洞察
第5章 エグゼクティブサマリー
第6章 イントロダクション
第7章 規制シナリオ
セクションIII:市場概要
第8章 主要企業の包括的データベース
第9章 競合情勢
第10章 ホワイトスペース分析
第11章 企業の競争力分析
第12章 説明可能なAI市場におけるスタートアップエコシステム
セクションIV:企業プロファイル
第13章 企業プロファイル
- 章の概要
- Alteryx
- Amelia
- Arthur.ai
- AWS
- BuildGroup
- DarwinAI
- DataRobot
- Ditto.ai
- Factmata
- IBM
- Kyndi
- Microsoft
- Mphasis
- NVIDIA
セクションV:市場動向
第14章 メガトレンド分析
第15章 アンメットニーズの分析
第16章 特許分析
第17章 最近の動向
セクションVI:市場機会の分析
第18章 世界の説明可能なAI市場
第19章 説明可能なAI市場の機会:コンポーネントタイプ別
第20章 説明可能なAI市場の機会:展開タイプ別
第21章 説明可能なAI市場の機会:用途別
第22章 説明可能なAI市場の機会:エンドユーザー別
第23章 説明可能なAI市場の機会:企業形態別
第24章 説明可能なAI市場の機会:北米
第25章 説明可能なAI市場の機会:欧州
第26章 説明可能なAI市場の機会:アジア
第27章 説明可能なAI市場の機会:中東・北アフリカ
第28章 説明可能なAI市場の機会:ラテンアメリカ
第29章 説明可能なAI市場の機会:世界のその他の地域
第30章 市場集中分析:主要企業の分布
第31章 隣接市場の分析
セクションVII:戦略ツール
第32章 勝利の鍵となる戦略
第33章 ポーターのファイブフォース分析
第34章 SWOT分析
第35章 バリューチェーン分析
第36章 ROOTSの戦略提言
セクションVIII:その他の独占的洞察
第37章 1次調査からの洞察
第38章 報告書の結論
セクションIX:付録
第39章 表形式データ
第40章 企業・団体一覧
第41章 カスタマイズの機会
第42章 ROOTSサブスクリプションサービス
第43章 著者詳細
Explainable AI Market Overview
As per Roots Analysis, the global explainable AI market size is estimated to grow from USD 8.01 million in the current year to USD 53.92 million by 2035, at a CAGR of 18.93% during the forecast period, till 2035.
The opportunity for explainable AI market has been distributed across the following segments:
Type of Component
- Services
- Solutions
Type of Deployment
- Cloud
- On-Premise
Type of Application
- Drug Discovery & Diagnostics
- Fraud and Anomaly Detection
- Identity and Access Management
- Predictive Maintenance
- Supply Chain Management
- Others
End-User
- Aerospace & Defense
- Automotive
- Healthcare
- IT & Telecommunication
- Public Sector & Utilities
- Retail and e-commerce
Type of Enterprise
- Large Enterprises
- Small and Medium Enterprises
Geographical Regions
- North America
- US
- Canada
- Mexico
- Other North American countries
- Europe
- Austria
- Belgium
- Denmark
- France
- Germany
- Ireland
- Italy
- Netherlands
- Norway
- Russia
- Spain
- Sweden
- Switzerland
- UK
- Other European countries
- Asia
- China
- India
- Japan
- Singapore
- South Korea
- Other Asian countries
- Latin America
- Brazil
- Chile
- Colombia
- Venezuela
- Other Latin American countries
- Middle East and North Africa
- Egypt
- Iran
- Iraq
- Israel
- Kuwait
- Saudi Arabia
- UAE
- Other MENA countries
- Rest of the World
- Australia
- New Zealand
- Other countries
EXPLAINABLE AI MARKET: GROWTH AND TRENDS
As of now, the number of AI users has more than doubled since 2020, reaching approximately 300 million worldwide. This marks a significant milestone in the combination of explainable computing and transparency in artificial intelligence. It is important to note that explainable AI is set to transform various sectors by utilizing techniques that allow AI algorithms to be understood, enabling stakeholders to grasp the reasoning behind decisions made. Some of the key benefits of explainable AI include model-agnostic approaches and interactive visualizations that facilitate user comprehension and speed up drug discovery within the healthcare field.
Moreover, explainable AI has changed how businesses operate by offering deeper insights and more effective solutions to urgent challenges across multiple industries such as finance, healthcare, energy, and manufacturing. It should be emphasized that the use of AI in key sectors is increasing rapidly due to the widespread availability of the internet and growing public awareness.
The explainable AI is becoming crucial in the global transition towards innovation and digital transformation aimed at achieving greater work efficiency. Natural language processing and interpretable machine learning have been crucial in realizing the full potential of the explainable AI market, which contributes to improved energy efficiency and faster responses. Additionally, techniques like SHAP and LIME are enhancing the interpretability of intricate AI models, thereby fostering greater trust in AI systems and paving the way for improved decision-making processes across various sectors, indicating a significant modern development. As a result, with ongoing technological progress and increased investment interest, the explainable AI market is expected to experience significant growth during the forecast period.
EXPLAINABLE AI MARKET: KEY SEGMENTS
Market Share by Type of Component
Based on type of component, the global explainable AI market is segmented into software and services. According to our estimates, currently, software segment captures the majority share of the market. This can be attributed to the rising demand for transparency and accountability in AI systems, prompting organizations to adopt XAI solutions.
This helps to clarify the decision-making process, especially in critical areas like healthcare and finance, where compliance with explainable AI regulations is essential.
Market Share by Type of Deployment
Based on type of deployment, the explainable AI market is segmented into cloud and on-premise. According to our estimates, currently, the cloud computing segment captures the majority of the market. This can be attributed to its flexibility and scalability, which makes it appealing for businesses eager to utilize XAI without significant initial infrastructure costs.
However, the on-premise segment is expected to grow at a relatively higher CAGR during the forecast period. This can be attributed to its ability to enable businesses to retain full control over their sensitive data, thereby reducing the risks tied to data breaches that may occur with cloud solutions. Further, on-premise systems provide opportunities for customization and scalability, allowing organizations to adapt their AI frameworks to align with specific operational requirements.
Market Share by Type of Application
Based on type of application, the explainable AI market is segmented into drug discovery & diagnostics, fraud and anomaly detection, identity and access management, predictive maintenance, supply chain management and others. According to our estimates, currently, fraud detection segment captures the majority share of the market. This can be attributed to the growing demand for transparency and trust in automated decision-making, particularly in the realm of explainable AI in cybersecurity, where understanding AI-generated decisions is essential.
However, the drug discovery and diagnostics segment is expected to grow at a relatively higher CAGR during the forecast period. This can be attributed to the rising demand for AI technologies that improve diagnostic precision and facilitate personalized medicine. Such growth is driven by advancements in machine learning that optimize drug development procedures and enhance treatment results.
Market Share by End-User
Based on end-user, the explainable AI market is segmented into aerospace & defense, automotive, healthcare, IT & telecommunication, public sector & utilities and retail and e-commerce. According to our estimates, currently, the IT & telecommunication segment captures the majority share of the market. This growth can be attributed to the extensive data produced from various sources, which is crucial for training AI models and generating valuable insights.
However, the aerospace & defense sector is expected to grow at a relatively higher CAGR during the forecast period, owing to the rising demand for clarity and responsibility in decision-making, especially in critical contexts where AI plays a role in national security and public safety.
Market Share by Type of Enterprise
Based on type of enterprise, the explainable AI market is segmented into large and small and medium enterprise. According to our estimates, currently, the large enterprise segment captures the majority share of the market. Additionally, this segment is expected to grow at a higher CAGR during the forecast period. This can be attributed to their ability to invest in explainable AI technologies, leverage significant resources, enhance economies of scale, and foster business growth.
Market Share by Geographical Regions
Based on geographical regions, the explainable AI market is segmented into North America, Europe, Asia, Latin America, Middle East and North Africa, and the rest of the world. According to our estimates, currently, North America captures the majority share of the market. However, the market in Asia is expected to grow at a higher CAGR during the forecast period. This can be attributed to the significant investments, government initiatives, and an increasing demand for explainable AI in countries like China and India.
Example Players in Explainable AI Market
- Alteryx
- Amelia
- Arthur.ai
- AWS
- BuildGroup
- DarwinAI
- DataRobot
- Ditto.ai
- Factmata
- IBM
- Kyndi
- Microsoft
- Mphasis
- NVIDIA
EXPLAINABLE AI MARKET: RESEARCH COVERAGE
The report on the explainable AI market features insights on various sections, including:
- Market Sizing and Opportunity Analysis: An in-depth analysis of the explainable AI market, focusing on key market segments, including [A] type of component, [B] type of deployment, [C] type of application, [D] end-user, [E] type of enterprise and [F] geographical regions.
- Competitive Landscape: A comprehensive analysis of the companies engaged in the Explainable AI market, based on several relevant parameters, such as [A] year of establishment, [B] company size, [C] location of headquarters and [D] ownership structure.
- Company Profiles: Elaborate profiles of prominent players engaged in the Explainable AI market, providing details on [A] location of headquarters, [B] company size, [C] company mission, [D] company footprint, [E] management team, [F] contact details, [G] financial information, [H] operating business segments, [I] Explainable AI portfolio, [J] moat analysis, [K] recent developments, and an informed future outlook.
- Megatrends: An evaluation of ongoing megatrends in Explainable AI industry.
- Patent Analysis: An insightful analysis of patents filed / granted in the explainable AI domain, based on relevant parameters, including [A] type of patent, [B] patent publication year, [C] patent age and [D] leading players.
- Recent Developments: An overview of the recent developments made in the explainable AI market, along with analysis based on relevant parameters, including [A] year of initiative, [B] type of initiative, [C] geographical distribution and [D] most active players.
- Porter's Five Forces Analysis: An analysis of five competitive forces prevailing in the explainable AI market, including threats of new entrants, bargaining power of buyers, bargaining power of suppliers, threats of substitute products and rivalry among existing competitors.
- SWOT Analysis: An insightful SWOT framework, highlighting the strengths, weaknesses, opportunities and threats in the domain. Additionally, it provides Harvey ball analysis, highlighting the relative impact of each SWOT parameter.
- Value Chain Analysis: A comprehensive analysis of the value chain, providing information on the different phases and stakeholders involved in the Explainable AI market.
KEY QUESTIONS ANSWERED IN THIS REPORT
- How many companies are currently engaged in explainable AI market?
- Which are the leading companies in this market?
- What factors are likely to influence the evolution of this market?
- What is the current and future market size?
- What is the CAGR of this market?
- How is the current and future market opportunity likely to be distributed across key market segments?
REASONS TO BUY THIS REPORT
- The report provides a comprehensive market analysis, offering detailed revenue projections of the overall market and its specific sub-segments. This information is valuable to both established market leaders and emerging entrants.
- Stakeholders can leverage the report to gain a deeper understanding of the competitive dynamics within the market. By analyzing the competitive landscape, businesses can make informed decisions to optimize their market positioning and develop effective go-to-market strategies.
- The report offers stakeholders a comprehensive overview of the market, including key drivers, barriers, opportunities, and challenges. This information empowers stakeholders to stay abreast of market trends and make data-driven decisions to capitalize on growth prospects.
ADDITIONAL BENEFITS
- Complimentary Excel Data Packs for all Analytical Modules in the Report
- 15% Free Content Customization
- Detailed Report Walkthrough Session with Research Team
- Free Updated report if the report is 6-12 months old or older
TABLE OF CONTENTS
SECTION I: REPORT OVERVIEW
1. PREFACE
- 1.1. Introduction
- 1.2. Market Share Insights
- 1.3. Key Market Insights
- 1.4. Report Coverage
- 1.5. Key Questions Answered
- 1.6. Chapter Outlines
2. RESEARCH METHODOLOGY
- 2.1. Chapter Overview
- 2.2. Research Assumptions
- 2.3. Database Building
- 2.3.1. Data Collection
- 2.3.2. Data Validation
- 2.3.3. Data Analysis
- 2.4. Project Methodology
- 2.4.1. Secondary Research
- 2.4.1.1. Annual Reports
- 2.4.1.2. Academic Research Papers
- 2.4.1.3. Company Websites
- 2.4.1.4. Investor Presentations
- 2.4.1.5. Regulatory Filings
- 2.4.1.6. White Papers
- 2.4.1.7. Industry Publications
- 2.4.1.8. Conferences and Seminars
- 2.4.1.9. Government Portals
- 2.4.1.10. Media and Press Releases
- 2.4.1.11. Newsletters
- 2.4.1.12. Industry Databases
- 2.4.1.13. Roots Proprietary Databases
- 2.4.1.14. Paid Databases and Sources
- 2.4.1.15. Social Media Portals
- 2.4.1.16. Other Secondary Sources
- 2.4.2. Primary Research
- 2.4.2.1. Introduction
- 2.4.2.2. Types
- 2.4.2.2.1. Qualitative
- 2.4.2.2.2. Quantitative
- 2.4.2.3. Advantages
- 2.4.2.4. Techniques
- 2.4.2.4.1. Interviews
- 2.4.2.4.2. Surveys
- 2.4.2.4.3. Focus Groups
- 2.4.2.4.4. Observational Research
- 2.4.2.4.5. Social Media Interactions
- 2.4.2.5. Stakeholders
- 2.4.2.5.1. Company Executives (CXOs)
- 2.4.2.5.2. Board of Directors
- 2.4.2.5.3. Company Presidents and Vice Presidents
- 2.4.2.5.4. Key Opinion Leaders
- 2.4.2.5.5. Research and Development Heads
- 2.4.2.5.6. Technical Experts
- 2.4.2.5.7. Subject Matter Experts
- 2.4.2.5.8. Scientists
- 2.4.2.5.9. Doctors and Other Healthcare Providers
- 2.4.2.6. Ethics and Integrity
- 2.4.2.6.1. Research Ethics
- 2.4.2.6.2. Data Integrity
- 2.4.3. Analytical Tools and Databases
- 2.4.1. Secondary Research
3. MARKET DYNAMICS
- 3.1. Forecast Methodology
- 3.1.1. Top-Down Approach
- 3.1.2. Bottom-Up Approach
- 3.1.3. Hybrid Approach
- 3.2. Market Assessment Framework
- 3.2.1. Total Addressable Market (TAM)
- 3.2.2. Serviceable Addressable Market (SAM)
- 3.2.3. Serviceable Obtainable Market (SOM)
- 3.2.4. Currently Acquired Market (CAM)
- 3.3. Forecasting Tools and Techniques
- 3.3.1. Qualitative Forecasting
- 3.3.2. Correlation
- 3.3.3. Regression
- 3.3.4. Time Series Analysis
- 3.3.5. Extrapolation
- 3.3.6. Convergence
- 3.3.7. Forecast Error Analysis
- 3.3.8. Data Visualization
- 3.3.9. Scenario Planning
- 3.3.10. Sensitivity Analysis
- 3.4. Key Considerations
- 3.4.1. Demographics
- 3.4.2. Market Access
- 3.4.3. Reimbursement Scenarios
- 3.4.4. Industry Consolidation
- 3.5. Robust Quality Control
- 3.6. Key Market Segmentations
- 3.7. Limitations
4. MACRO-ECONOMIC INDICATORS
- 4.1. Chapter Overview
- 4.2. Market Dynamics
- 4.2.1. Time Period
- 4.2.1.1. Historical Trends
- 4.2.1.2. Current and Forecasted Estimates
- 4.2.2. Currency Coverage
- 4.2.2.1. Overview of Major Currencies Affecting the Market
- 4.2.2.2. Impact of Currency Fluctuations on the Industry
- 4.2.3. Foreign Exchange Impact
- 4.2.3.1. Evaluation of Foreign Exchange Rates and Their Impact on Market
- 4.2.3.2. Strategies for Mitigating Foreign Exchange Risk
- 4.2.4. Recession
- 4.2.4.1. Historical Analysis of Past Recessions and Lessons Learnt
- 4.2.4.2. Assessment of Current Economic Conditions and Potential Impact on the Market
- 4.2.5. Inflation
- 4.2.5.1. Measurement and Analysis of Inflationary Pressures in the Economy
- 4.2.5.2. Potential Impact of Inflation on the Market Evolution
- 4.2.6. Interest Rates
- 4.2.6.1. Overview of Interest Rates and Their Impact on the Market
- 4.2.6.2. Strategies for Managing Interest Rate Risk
- 4.2.7. Commodity Flow Analysis
- 4.2.7.1. Type of Commodity
- 4.2.7.2. Origins and Destinations
- 4.2.7.3. Values and Weights
- 4.2.7.4. Modes of Transportation
- 4.2.8. Global Trade Dynamics
- 4.2.8.1. Import Scenario
- 4.2.8.2. Export Scenario
- 4.2.9. War Impact Analysis
- 4.2.9.1. Russian-Ukraine War
- 4.2.9.2. Israel-Hamas War
- 4.2.10. COVID Impact / Related Factors
- 4.2.10.1. Global Economic Impact
- 4.2.10.2. Industry-specific Impact
- 4.2.10.3. Government Response and Stimulus Measures
- 4.2.10.4. Future Outlook and Adaptation Strategies
- 4.2.11. Other Indicators
- 4.2.11.1. Fiscal Policy
- 4.2.11.2. Consumer Spending
- 4.2.11.3. Gross Domestic Product (GDP)
- 4.2.11.4. Employment
- 4.2.11.5. Taxes
- 4.2.11.6. R&D Innovation
- 4.2.11.7. Stock Market Performance
- 4.2.11.8. Supply Chain
- 4.2.11.9. Cross-Border Dynamics
- 4.2.1. Time Period
SECTION II: QUALITATIVE INSIGHTS
5. EXECUTIVE SUMMARY
6. INTRODUCTION
- 6.1. Chapter Overview
- 6.2. Overview of Explainable AI Market
- 6.2.1. Type of Component
- 6.2.2. Type of Deployment
- 6.2.3. Type of Application
- 6.2.4. Type of End-User
- 6.2.5. Type of Enterprise
- 6.3. Future Perspective
7. REGULATORY SCENARIO
SECTION III: MARKET OVERVIEW
8. COMPREHENSIVE DATABASE OF LEADING PLAYERS
9. COMPETITIVE LANDSCAPE
- 9.1. Chapter Overview
- 9.2. Explainable AI: Overall Market Landscape
- 9.2.1. Analysis by Year of Establishment
- 9.2.2. Analysis by Company Size
- 9.2.3. Analysis by Location of Headquarters
- 9.2.4. Analysis by Ownership Structure
10. WHITE SPACE ANALYSIS
11. COMPANY COMPETITIVENESS ANALYSIS
12. STARTUP ECOSYSTEM IN THE EXPLAINABLE AI MARKET
- 12.1. Explainable AI Market: Market Landscape of Startups
- 12.1.1. Analysis by Year of Establishment
- 12.1.2. Analysis by Company Size
- 12.1.3. Analysis by Company Size and Year of Establishment
- 12.1.4. Analysis by Location of Headquarters
- 12.1.5. Analysis by Company Size and Location of Headquarters
- 12.1.6. Analysis by Ownership Structure
- 12.2. Key Findings
SECTION IV: COMPANY PROFILES
13. COMPANY PROFILES
- 13.1. Chapter Overview
- 13.2. Alteryx *
- 13.2.1. Company Overview
- 13.2.2. Company Mission
- 13.2.3. Company Footprint
- 13.2.4. Management Team
- 13.2.5. Contact Details
- 13.2.6. Financial Performance
- 13.2.7. Operating Business Segments
- 13.2.8. Service / Product Portfolio (project specific)
- 13.2.9. MOAT Analysis
- 13.2.10. Recent Developments and Future Outlook
- 13.3. Amelia
- 13.4. Arthur.ai
- 13.5. AWS
- 13.6. BuildGroup
- 13.7. DarwinAI
- 13.8. DataRobot
- 13.9. Ditto.ai
- 13.10. Factmata
- 13.11. Google
- 13.12. IBM
- 13.13. Kyndi
- 13.14. Microsoft
- 13.15. Mphasis
- 13.16. NVIDIA
SECTION V: MARKET TRENDS
14. MEGA TRENDS ANALYSIS
15. UNMEET NEED ANALYSIS
16. PATENT ANALYSIS
17. RECENT DEVELOPMENTS
- 17.1. Chapter Overview
- 17.2. Recent Funding
- 17.3. Recent Partnerships
- 17.4. Other Recent Initiatives
SECTION VI: MARKET OPPORTUNITY ANALYSIS
18. GLOBAL EXPLAINABLE AI MARKET
- 18.1. Chapter Overview
- 18.2. Key Assumptions and Methodology
- 18.3. Trends Disruption Impacting Market
- 18.4. Demand Side Trends
- 18.5. Supply Side Trends
- 18.6. Global Explainable AI Market, Historical Trends (Since 2019) and Forecasted Estimates (Till 2035)
- 18.7. Multivariate Scenario Analysis
- 18.7.1. Conservative Scenario
- 18.7.2. Optimistic Scenario
- 18.8. Investment Feasibility Index
- 18.9. Key Market Segmentations
19. EXPLAINABLE AI MARKET OPPORTUNITY BASED ON TYPE OF COMPONENT
- 19.1. Chapter Overview
- 19.2. Key Assumptions and Methodology
- 19.3. Revenue Shift Analysis
- 19.4. Market Movement Analysis
- 19.5. Penetration-Growth (P-G) Matrix
- 19.6. Explainable AI Market for Services: Historical Trends (Since 2019) and Forecasted Estimates (Till 2035)
- 19.7. Explainable AI Market for Software: Historical Trends (Since 2019) and Forecasted Estimates (Till 2035)
- 19.8. Data Triangulation and Validation
- 19.8.1. Secondary Sources
- 19.8.2. Primary Sources
- 19.8.3. Statistical Modeling
20. MARKET OPPORTUNITIES BASED ON TYPE OF DEPLOYMENT
- 20.1. Chapter Overview
- 20.2. Key Assumptions and Methodology
- 20.3. Revenue Shift Analysis
- 20.4. Market Movement Analysis
- 20.5. Penetration-Growth (P-G) Matrix
- 20.6. Explainable AI Market for Cloud: Historical Trends (Since 2019) and Forecasted Estimates (Till 2035)
- 20.7. Explainable AI Market for On-Premise: Historical Trends (Since 2019) and Forecasted Estimates (Till 2035)
- 20.8. Data Triangulation and Validation
- 20.8.1. Secondary Sources
- 20.8.2. Primary Sources
- 20.8.3. Statistical Modeling
21. MARKET OPPORTUNITIES BASED ON TYPE OF APPLICATION
- 21.1. Chapter Overview
- 21.2. Key Assumptions and Methodology
- 21.3. Revenue Shift Analysis
- 21.4. Market Movement Analysis
- 21.5. Penetration-Growth (P-G) Matrix
- 21.6. Explainable AI Market for Drug Discovery & Diagnostics: Historical Trends (Since 2019) and Forecasted Estimates (Till 2035)
- 21.7. Explainable AI Market for Fraud and Anomaly Detection: Historical Trends (Since 2019) and Forecasted Estimates (Till 2035)
- 21.8. Explainable AI Market for Identity and Access Management: Historical Trends (Since 2019) and Forecasted Estimates (Till 2035)
- 21.9. Explainable AI Market for Predictive Maintenance: Historical Trends (Since 2019) and Forecasted Estimates (Till 2035)
- 21.10. Explainable AI Market for Supply Chain Management: Historical Trends (Since 2019) and Forecasted Estimates (Till 2035)
- 21.11. Explainable AI Market for Others: Historical Trends (Since 2019) and Forecasted Estimates (Till 2035)
- 21.12. Data Triangulation and Validation
- 21.12.1. Secondary Sources
- 21.12.2. Primary Sources
- 21.12.3. Statistical Modeling
22. MARKET OPPORTUNITIES BASED ON END-USER
- 22.1. Chapter Overview
- 22.2. Key Assumptions and Methodology
- 22.3. Revenue Shift Analysis
- 22.4. Market Movement Analysis
- 22.5. Penetration-Growth (P-G) Matrix
- 22.6. Explainable AI Market for Aerospace & Defense: Historical Trends (Since 2019) and Forecasted Estimates (Till 2035)
- 22.7. Explainable AI Market for Automotive: Historical Trends (Since 2019) and Forecasted Estimates (Till 2035)
- 22.8. Explainable AI Market for Healthcare: Historical Trends (Since 2019) and Forecasted Estimates (Till 2035)
- 22.9. Explainable AI Market for IT & Telecommunication: Historical Trends (Since 2019) and Forecasted Estimates (Till 2035)
- 22.10. Explainable AI Market for Public Sector & Utilities: Historical Trends (Since 2019) and Forecasted Estimates (Till 2035)
- 22.11. Explainable AI Market for Retail and E-commerce: Historical Trends (Since 2019) and Forecasted Estimates (Till 2035)
- 22.12. Data Triangulation and Validation
- 22.12.1. Secondary Sources
- 22.12.2. Primary Sources
- 22.12.3. Statistical Modeling
23. MARKET OPPORTUNITIES BASED ON TYPE OF ENTERPRISE
- 23.1. Chapter Overview
- 23.2. Key Assumptions and Methodology
- 23.3. Revenue Shift Analysis
- 23.4. Market Movement Analysis
- 23.5. Penetration-Growth (P-G) Matrix
- 23.6. Explainable AI Market for Large: Historical Trends (Since 2019) and Forecasted Estimates (Till 2035)
- 23.7. Explainable AI Market for Small and Medium Enterprise: Historical Trends (Since 2019) and Forecasted Estimates (Till 2035)
- 23.8. Data Triangulation and Validation
- 23.8.1. Secondary Sources
- 23.8.2. Primary Sources
- 23.8.3. Statistical Modeling
24. MARKET OPPORTUNITIES FOR EXPLAINABLE AI IN NORTH AMERICA
- 24.1. Chapter Overview
- 24.2. Key Assumptions and Methodology
- 24.3. Revenue Shift Analysis
- 24.4. Market Movement Analysis
- 24.5. Penetration-Growth (P-G) Matrix
- 24.6. Explainable AI Market in North America: Historical Trends (Since 2019) and Forecasted Estimates (Till 2035)
- 24.6.1. Explainable AI Market in the US: Historical Trends (Since 2019) and Forecasted Estimates (Till 2035)
- 24.6.2. Explainable AI Market in Canada: Historical Trends (Since 2019) and Forecasted Estimates (Till 2035)
- 24.6.3. Explainable AI Market in Mexico: Historical Trends (Since 2019) and Forecasted Estimates (Till 2035)
- 24.6.4. Explainable AI Market in Other North American Countries: Historical Trends (Since 2019) and Forecasted Estimates (Till 2035)
- 24.7. Data Triangulation and Validation
25. MARKET OPPORTUNITIES FOR EXPLAINABLE AI IN EUROPE
- 25.1. Chapter Overview
- 25.2. Key Assumptions and Methodology
- 25.3. Revenue Shift Analysis
- 25.4. Market Movement Analysis
- 25.5. Penetration-Growth (P-G) Matrix
- 25.6. Explainable AI Market in Europe: Historical Trends (Since 2019) and Forecasted Estimates (Till 2035)
- 25.6.1. Explainable AI Market in Austria: Historical Trends (Since 2019) and Forecasted Estimates (Till 2035)
- 25.6.2. Explainable AI Market in Belgium: Historical Trends (Since 2019) and Forecasted Estimates (Till 2035)
- 25.6.3. Explainable AI Market in Denmark: Historical Trends (Since 2019) and Forecasted Estimates (Till 2035)
- 25.6.4. Explainable AI Market in France: Historical Trends (Since 2019) and Forecasted Estimates (Till 2035)
- 25.6.5. Explainable AI Market in Germany: Historical Trends (Since 2019) and Forecasted Estimates (Till 2035)
- 25.6.6. Explainable AI Market in Ireland: Historical Trends (Since 2019) and Forecasted Estimates (Till 2035)
- 25.6.7. Explainable AI Market in Italy: Historical Trends (Since 2019) and Forecasted Estimates (Till 2035)
- 25.6.8. Explainable AI Market in Netherlands: Historical Trends (Since 2019) and Forecasted Estimates (Till 2035)
- 25.6.9. Explainable AI Market in Norway: Historical Trends (Since 2019) and Forecasted Estimates (Till 2035)
- 25.6.10. Explainable AI Market in Russia: Historical Trends (Since 2019) and Forecasted Estimates (Till 2035)
- 25.6.11. Explainable AI Market in Spain: Historical Trends (Since 2019) and Forecasted Estimates (Till 2035)
- 25.6.12. Explainable AI Market in Sweden: Historical Trends (Since 2019) and Forecasted Estimates (Till 2035)
- 25.6.13. Explainable AI Market in Sweden: Historical Trends (Since 2019) and Forecasted Estimates (Till 2035)
- 25.6.14. Explainable AI Market in Switzerland: Historical Trends (Since 2019) and Forecasted Estimates (Till 2035)
- 25.6.15. Explainable AI Market in the UK: Historical Trends (Since 2019) and Forecasted Estimates (Till 2035)
- 25.6.16. Explainable AI Market in Other European Countries: Historical Trends (Since 2019) and Forecasted Estimates (Till 2035)
- 25.7. Data Triangulation and Validation
26. MARKET OPPORTUNITIES FOR EXPLAINABLE AI IN ASIA
- 26.1. Chapter Overview
- 26.2. Key Assumptions and Methodology
- 26.3. Revenue Shift Analysis
- 26.4. Market Movement Analysis
- 26.5. Penetration-Growth (P-G) Matrix
- 26.6. Explainable AI Market in Asia: Historical Trends (Since 2019) and Forecasted Estimates (Till 2035)
- 26.6.1. Explainable AI Market in China: Historical Trends (Since 2019) and Forecasted Estimates (Till 2035)
- 26.6.2. Explainable AI Market in India: Historical Trends (Since 2019) and Forecasted Estimates (Till 2035)
- 26.6.3. Explainable AI Market in Japan: Historical Trends (Since 2019) and Forecasted Estimates (Till 2035)
- 26.6.4. Explainable AI Market in Singapore: Historical Trends (Since 2019) and Forecasted Estimates (Till 2035)
- 26.6.5. Explainable AI Market in South Korea: Historical Trends (Since 2019) and Forecasted Estimates (Till 2035)
- 26.6.6. Explainable AI Market in Other Asian Countries: Historical Trends (Since 2019) and Forecasted Estimates (Till 2035)
- 26.7. Data Triangulation and Validation
27. MARKET OPPORTUNITIES FOR EXPLAINABLE AI IN MIDDLE EAST AND NORTH AFRICA (MENA)
- 27.1. Chapter Overview
- 27.2. Key Assumptions and Methodology
- 27.3. Revenue Shift Analysis
- 27.4. Market Movement Analysis
- 27.5. Penetration-Growth (P-G) Matrix
- 27.6. Explainable AI Market in Middle East and North Africa (MENA): Historical Trends (Since 2019) and Forecasted Estimates (Till 2035)
- 27.6.1. Explainable AI Market in Egypt: Historical Trends (Since 2019) and Forecasted Estimates (Till 205)
- 27.6.2. Explainable AI Market in Iran: Historical Trends (Since 2019) and Forecasted Estimates (Till 2035)
- 27.6.3. Explainable AI Market in Iraq: Historical Trends (Since 2019) and Forecasted Estimates (Till 2035)
- 27.6.4. Explainable AI Market in Israel: Historical Trends (Since 2019) and Forecasted Estimates (Till 2035)
- 27.6.5. Explainable AI Market in Kuwait: Historical Trends (Since 2019) and Forecasted Estimates (Till 2035)
- 27.6.6. Explainable AI Market in Saudi Arabia: Historical Trends (Since 2019) and Forecasted Estimates (Till 2035)
- 27.6.7. Explainable AI Market in United Arab Emirates (UAE): Historical Trends (Since 2019) and Forecasted Estimates (Till 2035)
- 27.6.8. Explainable AI Market in Other MENA Countries: Historical Trends (Since 2019) and Forecasted Estimates (Till 2035)
- 27.7. Data Triangulation and Validation
28. MARKET OPPORTUNITIES FOR EXPLAINABLE AI IN LATIN AMERICA
- 28.1. Chapter Overview
- 28.2. Key Assumptions and Methodology
- 28.3. Revenue Shift Analysis
- 28.4. Market Movement Analysis
- 28.5. Penetration-Growth (P-G) Matrix
- 28.6. Explainable AI Market in Latin America: Historical Trends (Since 2019) and Forecasted Estimates (Till 2035)
- 28.6.1. Explainable AI Market in Argentina: Historical Trends (Since 2019) and Forecasted Estimates (Till 2035)
- 28.6.2. Explainable AI Market in Brazil: Historical Trends (Since 2019) and Forecasted Estimates (Till 2035)
- 28.6.3. Explainable AI Market in Chile: Historical Trends (Since 2019) and Forecasted Estimates (Till 2035)
- 28.6.4. Explainable AI Market in Colombia Historical Trends (Since 2019) and Forecasted Estimates (Till 2035)
- 28.6.5. Explainable AI Market in Venezuela: Historical Trends (Since 2019) and Forecasted Estimates (Till 2035)
- 28.6.6. Explainable AI Market in Other Latin American Countries: Historical Trends (Since 2019) and Forecasted Estimates (Till 2035)
- 28.7. Data Triangulation and Validation
29. MARKET OPPORTUNITIES FOR EXPLAINABLE AI IN REST OF THE WORLD
- 29.1. Chapter Overview
- 29.2. Key Assumptions and Methodology
- 29.3. Revenue Shift Analysis
- 29.4. Market Movement Analysis
- 29.5. Penetration-Growth (P-G) Matrix
- 29.6. Explainable AI Market in Rest of the World: Historical Trends (Since 2019) and Forecasted Estimates (Till 2035)
- 29.6.1. Explainable AI Market in Australia: Historical Trends (Since 2019) and Forecasted Estimates (Till 2035)
- 29.6.2. Explainable AI Market in New Zealand: Historical Trends (Since 2019) and Forecasted Estimates (Till 2035)
- 29.6.3. Explainable AI Market in Other Countries
- 29.7. Data Triangulation and Validation
30. MARKET CONCENTRATION ANALYSIS: DISTRIBUTION BY LEADING PLAYERS
- 30.1. Leading Player 1
- 30.2. Leading Player 2
- 30.3. Leading Player 3
- 30.4. Leading Player 4
- 30.5. Leading Player 5
- 30.6. Leading Player 6
- 30.7. Leading Player 7
- 30.8. Leading Player 8
31. ADJACENT MARKET ANALYSIS
SECTION VII: STRATEGIC TOOLS
32. KEY WINNING STRATEGIES
33. PORTER'S FIVE FORCES ANALYSIS
34. SWOT ANALYSIS
35. VALUE CHAIN ANALYSIS
36. ROOTS STRATEGIC RECOMMENDATIONS
- 36.1. Chapter Overview
- 36.2. Key Business-related Strategies
- 36.2.1. Research & Development
- 36.2.2. Product Manufacturing
- 36.2.3. Commercialization / Go-to-Market
- 36.2.4. Sales and Marketing
- 36.3. Key Operations-related Strategies
- 36.3.1. Risk Management
- 36.3.2. Workforce
- 36.3.3. Finance
- 36.3.4. Others
