|
|
市場調査レポート
商品コード
1593659
産業安全における複合現実アプリケーションの世界市場:市場規模、シェア、動向分析レポート - コンポーネント別、用途別、デバイスタイプ別、地域別展望と予測、2024年~2031年Global Mixed Reality Applications in Industrial Safety Market Size, Share & Trends Analysis Report By Component (Hardware, and Software), By Application, By Device Type (Wireless, and Wired), By Regional Outlook and Forecast, 2024 - 2031 |
||||||

|
|||||||
|
|||||||

| 産業安全における複合現実アプリケーションの世界市場:市場規模、シェア、動向分析レポート - コンポーネント別、用途別、デバイスタイプ別、地域別展望と予測、2024年~2031年 |
|
出版日: 2024年11月15日
発行: KBV Research
ページ情報: 英文 243 Pages
納期: 即納可能
|

全表示
- 概要
- 図表
- 目次
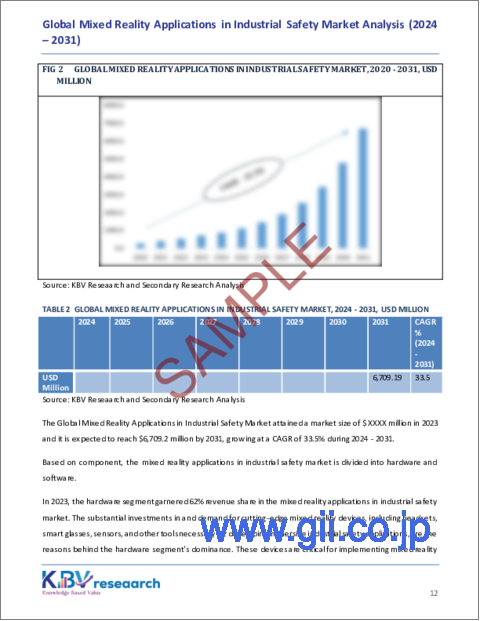
産業安全における複合現実アプリケーション市場規模は、予測期間中に33.5%のCAGRで市場成長し、2031年までに67億米ドルに達すると予想されています。
さらに、産業現場でのリアルタイム監視の重要性が高まっていることから、複合現実アプリケーションの需要が高まっています。従来の安全対策では、定期的な検査や事後対応策が求められることが多く、事故を時間内に防ぐことができない場合があります。MRの統合により、センサー、機器、環境要因からのリアルタイムデータを作業者の視界に重ねて表示し、潜在的な危険に関する即時のフィードバックを提供できます。このように、リアルタイム監視と予防的安全対策への注目が高まることで、市場の成長が促進されます。
しかし、これを広く採用する上での大きな課題の1つは、初期投資と統合コストが高いことです。MRソリューションを実装するには、ヘッドセット、センサー、コンピューティングインフラストラクチャ、特定の業界ニーズに合わせたソフトウェア開発などの特殊なハードウェアに企業が投資する必要があります。そのため、初期投資と統合コストが高いことが市場の成長を妨げています。
コンポーネントの展望
コンポーネントに基づいて、産業安全における複合現実アプリケーション市場は、ハードウェアとソフトウェアに分かれています。ソフトウェアセグメントは、2023年にこの市場で38%の収益シェアを獲得しました。複合現実体験を促進する特殊なアプリとプラットフォームの需要の高まりが、ソフトウェアセグメントの拡大を後押ししています。これには、シミュレーション、トレーニング、リアルタイムのデータ視覚化、リモートコラボレーション用のソフトウェアが含まれ、これらはすべて産業安全の向上に重要な役割を果たします。
用途の展望
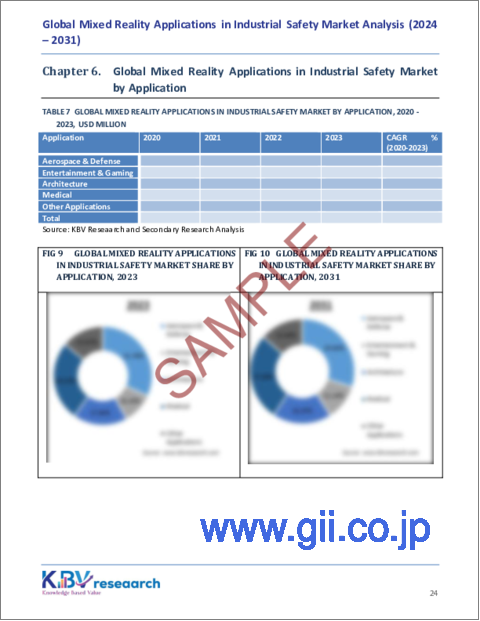
用途別に見ると、産業安全における複合現実アプリケーション市場は、航空宇宙および防衛、エンターテインメントおよびゲーム、アーキテクチャ、医療、その他に分類されます。医療セグメントは、2023年にこの市場で26%の収益シェアを獲得しました。医療分野での複合現実の採用は、高度なトレーニングツール、正確な手術計画、および患者の転帰の改善に対するニーズによって推進されています。医療専門家は、没入型のトレーニング体験を提供するMRアプリケーションの助けを借りて、リスクのない仮想環境でプロセスを練習できます。
デバイスタイプの展望
デバイスの種類に基づいて、産業安全における複合現実アプリケーション市場は、ワイヤレスと有線に分類されます。2023年には、有線セグメントがこの市場で30%の収益シェアを獲得しました。有線の複合現実デバイスは、詳細なシミュレーションや複雑なトレーニングプログラムなど、忠実度の高いグラフィックスと安定した接続を必要とするアプリケーションでよく使用されます。これらのデバイスは通常、優れた遅延と視覚品質のパフォーマンスを提供し、精度と正確さが求められるタスクに不可欠です。
地域展望
地域別に見ると、産業安全における複合現実アプリケーション市場は、北米、欧州、アジア太平洋、ラテンアメリカ・中東・アフリカ、で分析されています。2023年には、欧州地域がこの市場で30%の収益シェアを生み出しました。欧州の大きなシェアは、職場の安全規制を重視し、厳格な安全基準に準拠するための革新的なテクノロジーを採用していることによって推進されています。特にドイツ、英国、フランスなどの国では、欧州の産業が、労働者のトレーニング、遠隔検査の実施、安全プロトコルの強化のために、複合現実アプリケーションをますます活用しています。
目次
第1章 市場範囲と調査手法
- 市場の定義
- 目的
- 市場範囲
- セグメンテーション
- 調査手法
第2章 市場要覧
- 主なハイライト
第3章 市場概要
- イントロダクション
- 概要
- 市場構成とシナリオ
- 概要
- 市場に影響を与える主な要因
- 市場促進要因
- 市場抑制要因
- 市場機会
- 市場の課題
第4章 競合分析- 世界
- 市場シェア分析2023
- ポーターのファイブフォース分析
第5章 世界市場:コンポーネント別
- 世界のハードウェア市場:地域別
- 世界のソフトウェア市場:地域別
第6章 世界市場:用途別
- 世界の航空宇宙・防衛市場:地域別
- 世界のエンターテイメントとゲーム市場:地域別
- 世界のアーキテクチャ市場:地域別
- 世界の医療市場:地域別
- 世界のその他の用途市場:地域別
第7章 世界市場:デバイスタイプ別
- 世界のワイヤレス市場:地域別
- 世界の有線市場:地域別
第8章 世界市場:地域別
- 北米
- 北米の市場:国別
- 米国
- カナダ
- メキシコ
- その他北米地域
- 北米の市場:国別
- 欧州
- 欧州の市場:国別
- ドイツ
- 英国
- フランス
- ロシア
- スペイン
- イタリア
- その他欧州地域
- 欧州の市場:国別
- アジア太平洋地域
- アジア太平洋の市場:国別
- 中国
- 日本
- インド
- 韓国
- シンガポール
- マレーシア
- その他アジア太平洋地域
- アジア太平洋の市場:国別
- ラテンアメリカ・中東・アフリカ
- ラテンアメリカ・中東・アフリカの市場:国別
- ブラジル
- アルゼンチン
- アラブ首長国連邦
- サウジアラビア
- 南アフリカ
- ナイジェリア
- その他ラテンアメリカ・中東・アフリカ地域
- ラテンアメリカ・中東・アフリカの市場:国別
第9章 企業プロファイル
- Microsoft Corporation
- Google LLC(Alphabet Inc)
- Canon, Inc
- Samsung Electronics Co, Ltd.(Samsung Health)
- Meta Platforms, Inc
- HTC Corporation
- Dell Technologies, Inc
- PTC, Inc
- Hewlett Packard Enterprise Company
- Niantic, Inc
第10章 産業安全における複合現実アプリケーション市場の成功必須条件
LIST OF TABLES
- TABLE 1 Global Mixed Reality Applications in Industrial Safety Market, 2020 - 2023, USD Million
- TABLE 2 Global Mixed Reality Applications in Industrial Safety Market, 2024 - 2031, USD Million
- TABLE 3 Global Mixed Reality Applications in Industrial Safety Market by Component, 2020 - 2023, USD Million
- TABLE 4 Global Mixed Reality Applications in Industrial Safety Market by Component, 2024 - 2031, USD Million
- TABLE 5 Global Hardware Market by Region, 2020 - 2023, USD Million
- TABLE 6 Global Hardware Market by Region, 2024 - 2031, USD Million
- TABLE 7 Global Software Market by Region, 2020 - 2023, USD Million
- TABLE 8 Global Software Market by Region, 2024 - 2031, USD Million
- TABLE 9 Global Mixed Reality Applications in Industrial Safety Market by Application, 2020 - 2023, USD Million
- TABLE 10 Global Mixed Reality Applications in Industrial Safety Market by Application, 2024 - 2031, USD Million
- TABLE 11 Global Aerospace & Defense Market by Region, 2020 - 2023, USD Million
- TABLE 12 Global Aerospace & Defense Market by Region, 2024 - 2031, USD Million
- TABLE 13 Global Entertainment & Gaming Market by Region, 2020 - 2023, USD Million
- TABLE 14 Global Entertainment & Gaming Market by Region, 2024 - 2031, USD Million
- TABLE 15 Global Architecture Market by Region, 2020 - 2023, USD Million
- TABLE 16 Global Architecture Market by Region, 2024 - 2031, USD Million
- TABLE 17 Global Medical Market by Region, 2020 - 2023, USD Million
- TABLE 18 Global Medical Market by Region, 2024 - 2031, USD Million
- TABLE 19 Global Other Applications Market by Region, 2020 - 2023, USD Million
- TABLE 20 Global Other Applications Market by Region, 2024 - 2031, USD Million
- TABLE 21 Global Mixed Reality Applications in Industrial Safety Market by Device Type, 2020 - 2023, USD Million
- TABLE 22 Global Mixed Reality Applications in Industrial Safety Market by Device Type, 2024 - 2031, USD Million
- TABLE 23 Global Wireless Market by Region, 2020 - 2023, USD Million
- TABLE 24 Global Wireless Market by Region, 2024 - 2031, USD Million
- TABLE 25 Global Wired Market by Region, 2020 - 2023, USD Million
- TABLE 26 Global Wired Market by Region, 2024 - 2031, USD Million
- TABLE 27 Global Mixed Reality Applications in Industrial Safety Market by Region, 2020 - 2023, USD Million
- TABLE 28 Global Mixed Reality Applications in Industrial Safety Market by Region, 2024 - 2031, USD Million
- TABLE 29 North America Mixed Reality Applications in Industrial Safety Market, 2020 - 2023, USD Million
- TABLE 30 North America Mixed Reality Applications in Industrial Safety Market, 2024 - 2031, USD Million
- TABLE 31 North America Mixed Reality Applications in Industrial Safety Market by Component, 2020 - 2023, USD Million
- TABLE 32 North America Mixed Reality Applications in Industrial Safety Market by Component, 2024 - 2031, USD Million
- TABLE 33 North America Hardware Market by Country, 2020 - 2023, USD Million
- TABLE 34 North America Hardware Market by Country, 2024 - 2031, USD Million
- TABLE 35 North America Software Market by Country, 2020 - 2023, USD Million
- TABLE 36 North America Software Market by Country, 2024 - 2031, USD Million
- TABLE 37 North America Mixed Reality Applications in Industrial Safety Market by Application, 2020 - 2023, USD Million
- TABLE 38 North America Mixed Reality Applications in Industrial Safety Market by Application, 2024 - 2031, USD Million
- TABLE 39 North America Aerospace & Defense Market by Country, 2020 - 2023, USD Million
- TABLE 40 North America Aerospace & Defense Market by Country, 2024 - 2031, USD Million
- TABLE 41 North America Entertainment & Gaming Market by Country, 2020 - 2023, USD Million
- TABLE 42 North America Entertainment & Gaming Market by Country, 2024 - 2031, USD Million
- TABLE 43 North America Architecture Market by Country, 2020 - 2023, USD Million
- TABLE 44 North America Architecture Market by Country, 2024 - 2031, USD Million
- TABLE 45 North America Medical Market by Country, 2020 - 2023, USD Million
- TABLE 46 North America Medical Market by Country, 2024 - 2031, USD Million
- TABLE 47 North America Other Applications Market by Country, 2020 - 2023, USD Million
- TABLE 48 North America Other Applications Market by Country, 2024 - 2031, USD Million
- TABLE 49 North America Mixed Reality Applications in Industrial Safety Market by Device Type, 2020 - 2023, USD Million
- TABLE 50 North America Mixed Reality Applications in Industrial Safety Market by Device Type, 2024 - 2031, USD Million
- TABLE 51 North America Wireless Market by Country, 2020 - 2023, USD Million
- TABLE 52 North America Wireless Market by Country, 2024 - 2031, USD Million
- TABLE 53 North America Wired Market by Country, 2020 - 2023, USD Million
- TABLE 54 North America Wired Market by Country, 2024 - 2031, USD Million
- TABLE 55 North America Mixed Reality Applications in Industrial Safety Market by Country, 2020 - 2023, USD Million
- TABLE 56 North America Mixed Reality Applications in Industrial Safety Market by Country, 2024 - 2031, USD Million
- TABLE 57 US Mixed Reality Applications in Industrial Safety Market, 2020 - 2023, USD Million
- TABLE 58 US Mixed Reality Applications in Industrial Safety Market, 2024 - 2031, USD Million
- TABLE 59 US Mixed Reality Applications in Industrial Safety Market by Component, 2020 - 2023, USD Million
- TABLE 60 US Mixed Reality Applications in Industrial Safety Market by Component, 2024 - 2031, USD Million
- TABLE 61 US Mixed Reality Applications in Industrial Safety Market by Application, 2020 - 2023, USD Million
- TABLE 62 US Mixed Reality Applications in Industrial Safety Market by Application, 2024 - 2031, USD Million
- TABLE 63 US Mixed Reality Applications in Industrial Safety Market by Device Type, 2020 - 2023, USD Million
- TABLE 64 US Mixed Reality Applications in Industrial Safety Market by Device Type, 2024 - 2031, USD Million
- TABLE 65 Canada Mixed Reality Applications in Industrial Safety Market, 2020 - 2023, USD Million
- TABLE 66 Canada Mixed Reality Applications in Industrial Safety Market, 2024 - 2031, USD Million
- TABLE 67 Canada Mixed Reality Applications in Industrial Safety Market by Component, 2020 - 2023, USD Million
- TABLE 68 Canada Mixed Reality Applications in Industrial Safety Market by Component, 2024 - 2031, USD Million
- TABLE 69 Canada Mixed Reality Applications in Industrial Safety Market by Application, 2020 - 2023, USD Million
- TABLE 70 Canada Mixed Reality Applications in Industrial Safety Market by Application, 2024 - 2031, USD Million
- TABLE 71 Canada Mixed Reality Applications in Industrial Safety Market by Device Type, 2020 - 2023, USD Million
- TABLE 72 Canada Mixed Reality Applications in Industrial Safety Market by Device Type, 2024 - 2031, USD Million
- TABLE 73 Mexico Mixed Reality Applications in Industrial Safety Market, 2020 - 2023, USD Million
- TABLE 74 Mexico Mixed Reality Applications in Industrial Safety Market, 2024 - 2031, USD Million
- TABLE 75 Mexico Mixed Reality Applications in Industrial Safety Market by Component, 2020 - 2023, USD Million
- TABLE 76 Mexico Mixed Reality Applications in Industrial Safety Market by Component, 2024 - 2031, USD Million
- TABLE 77 Mexico Mixed Reality Applications in Industrial Safety Market by Application, 2020 - 2023, USD Million
- TABLE 78 Mexico Mixed Reality Applications in Industrial Safety Market by Application, 2024 - 2031, USD Million
- TABLE 79 Mexico Mixed Reality Applications in Industrial Safety Market by Device Type, 2020 - 2023, USD Million
- TABLE 80 Mexico Mixed Reality Applications in Industrial Safety Market by Device Type, 2024 - 2031, USD Million
- TABLE 81 Rest of North America Mixed Reality Applications in Industrial Safety Market, 2020 - 2023, USD Million
- TABLE 82 Rest of North America Mixed Reality Applications in Industrial Safety Market, 2024 - 2031, USD Million
- TABLE 83 Rest of North America Mixed Reality Applications in Industrial Safety Market by Component, 2020 - 2023, USD Million
- TABLE 84 Rest of North America Mixed Reality Applications in Industrial Safety Market by Component, 2024 - 2031, USD Million
- TABLE 85 Rest of North America Mixed Reality Applications in Industrial Safety Market by Application, 2020 - 2023, USD Million
- TABLE 86 Rest of North America Mixed Reality Applications in Industrial Safety Market by Application, 2024 - 2031, USD Million
- TABLE 87 Rest of North America Mixed Reality Applications in Industrial Safety Market by Device Type, 2020 - 2023, USD Million
- TABLE 88 Rest of North America Mixed Reality Applications in Industrial Safety Market by Device Type, 2024 - 2031, USD Million
- TABLE 89 Europe Mixed Reality Applications in Industrial Safety Market, 2020 - 2023, USD Million
- TABLE 90 Europe Mixed Reality Applications in Industrial Safety Market, 2024 - 2031, USD Million
- TABLE 91 Europe Mixed Reality Applications in Industrial Safety Market by Component, 2020 - 2023, USD Million
- TABLE 92 Europe Mixed Reality Applications in Industrial Safety Market by Component, 2024 - 2031, USD Million
- TABLE 93 Europe Hardware Market by Country, 2020 - 2023, USD Million
- TABLE 94 Europe Hardware Market by Country, 2024 - 2031, USD Million
- TABLE 95 Europe Software Market by Country, 2020 - 2023, USD Million
- TABLE 96 Europe Software Market by Country, 2024 - 2031, USD Million
- TABLE 97 Europe Mixed Reality Applications in Industrial Safety Market by Application, 2020 - 2023, USD Million
- TABLE 98 Europe Mixed Reality Applications in Industrial Safety Market by Application, 2024 - 2031, USD Million
- TABLE 99 Europe Aerospace & Defense Market by Country, 2020 - 2023, USD Million
- TABLE 100 Europe Aerospace & Defense Market by Country, 2024 - 2031, USD Million
- TABLE 101 Europe Entertainment & Gaming Market by Country, 2020 - 2023, USD Million
- TABLE 102 Europe Entertainment & Gaming Market by Country, 2024 - 2031, USD Million
- TABLE 103 Europe Architecture Market by Country, 2020 - 2023, USD Million
- TABLE 104 Europe Architecture Market by Country, 2024 - 2031, USD Million
- TABLE 105 Europe Medical Market by Country, 2020 - 2023, USD Million
- TABLE 106 Europe Medical Market by Country, 2024 - 2031, USD Million
- TABLE 107 Europe Other Applications Market by Country, 2020 - 2023, USD Million
- TABLE 108 Europe Other Applications Market by Country, 2024 - 2031, USD Million
- TABLE 109 Europe Mixed Reality Applications in Industrial Safety Market by Device Type, 2020 - 2023, USD Million
- TABLE 110 Europe Mixed Reality Applications in Industrial Safety Market by Device Type, 2024 - 2031, USD Million
- TABLE 111 Europe Wireless Market by Country, 2020 - 2023, USD Million
- TABLE 112 Europe Wireless Market by Country, 2024 - 2031, USD Million
- TABLE 113 Europe Wired Market by Country, 2020 - 2023, USD Million
- TABLE 114 Europe Wired Market by Country, 2024 - 2031, USD Million
- TABLE 115 Europe Mixed Reality Applications in Industrial Safety Market by Country, 2020 - 2023, USD Million
- TABLE 116 Europe Mixed Reality Applications in Industrial Safety Market by Country, 2024 - 2031, USD Million
- TABLE 117 Germany Mixed Reality Applications in Industrial Safety Market, 2020 - 2023, USD Million
- TABLE 118 Germany Mixed Reality Applications in Industrial Safety Market, 2024 - 2031, USD Million
- TABLE 119 Germany Mixed Reality Applications in Industrial Safety Market by Component, 2020 - 2023, USD Million
- TABLE 120 Germany Mixed Reality Applications in Industrial Safety Market by Component, 2024 - 2031, USD Million
- TABLE 121 Germany Mixed Reality Applications in Industrial Safety Market by Application, 2020 - 2023, USD Million
- TABLE 122 Germany Mixed Reality Applications in Industrial Safety Market by Application, 2024 - 2031, USD Million
- TABLE 123 Germany Mixed Reality Applications in Industrial Safety Market by Device Type, 2020 - 2023, USD Million
- TABLE 124 Germany Mixed Reality Applications in Industrial Safety Market by Device Type, 2024 - 2031, USD Million
- TABLE 125 UK Mixed Reality Applications in Industrial Safety Market, 2020 - 2023, USD Million
- TABLE 126 UK Mixed Reality Applications in Industrial Safety Market, 2024 - 2031, USD Million
- TABLE 127 UK Mixed Reality Applications in Industrial Safety Market by Component, 2020 - 2023, USD Million
- TABLE 128 UK Mixed Reality Applications in Industrial Safety Market by Component, 2024 - 2031, USD Million
- TABLE 129 UK Mixed Reality Applications in Industrial Safety Market by Application, 2020 - 2023, USD Million
- TABLE 130 UK Mixed Reality Applications in Industrial Safety Market by Application, 2024 - 2031, USD Million
- TABLE 131 UK Mixed Reality Applications in Industrial Safety Market by Device Type, 2020 - 2023, USD Million
- TABLE 132 UK Mixed Reality Applications in Industrial Safety Market by Device Type, 2024 - 2031, USD Million
- TABLE 133 France Mixed Reality Applications in Industrial Safety Market, 2020 - 2023, USD Million
- TABLE 134 France Mixed Reality Applications in Industrial Safety Market, 2024 - 2031, USD Million
- TABLE 135 France Mixed Reality Applications in Industrial Safety Market by Component, 2020 - 2023, USD Million
- TABLE 136 France Mixed Reality Applications in Industrial Safety Market by Component, 2024 - 2031, USD Million
- TABLE 137 France Mixed Reality Applications in Industrial Safety Market by Application, 2020 - 2023, USD Million
- TABLE 138 France Mixed Reality Applications in Industrial Safety Market by Application, 2024 - 2031, USD Million
- TABLE 139 France Mixed Reality Applications in Industrial Safety Market by Device Type, 2020 - 2023, USD Million
- TABLE 140 France Mixed Reality Applications in Industrial Safety Market by Device Type, 2024 - 2031, USD Million
- TABLE 141 Russia Mixed Reality Applications in Industrial Safety Market, 2020 - 2023, USD Million
- TABLE 142 Russia Mixed Reality Applications in Industrial Safety Market, 2024 - 2031, USD Million
- TABLE 143 Russia Mixed Reality Applications in Industrial Safety Market by Component, 2020 - 2023, USD Million
- TABLE 144 Russia Mixed Reality Applications in Industrial Safety Market by Component, 2024 - 2031, USD Million
- TABLE 145 Russia Mixed Reality Applications in Industrial Safety Market by Application, 2020 - 2023, USD Million
- TABLE 146 Russia Mixed Reality Applications in Industrial Safety Market by Application, 2024 - 2031, USD Million
- TABLE 147 Russia Mixed Reality Applications in Industrial Safety Market by Device Type, 2020 - 2023, USD Million
- TABLE 148 Russia Mixed Reality Applications in Industrial Safety Market by Device Type, 2024 - 2031, USD Million
- TABLE 149 Spain Mixed Reality Applications in Industrial Safety Market, 2020 - 2023, USD Million
- TABLE 150 Spain Mixed Reality Applications in Industrial Safety Market, 2024 - 2031, USD Million
- TABLE 151 Spain Mixed Reality Applications in Industrial Safety Market by Component, 2020 - 2023, USD Million
- TABLE 152 Spain Mixed Reality Applications in Industrial Safety Market by Component, 2024 - 2031, USD Million
- TABLE 153 Spain Mixed Reality Applications in Industrial Safety Market by Application, 2020 - 2023, USD Million
- TABLE 154 Spain Mixed Reality Applications in Industrial Safety Market by Application, 2024 - 2031, USD Million
- TABLE 155 Spain Mixed Reality Applications in Industrial Safety Market by Device Type, 2020 - 2023, USD Million
- TABLE 156 Spain Mixed Reality Applications in Industrial Safety Market by Device Type, 2024 - 2031, USD Million
- TABLE 157 Italy Mixed Reality Applications in Industrial Safety Market, 2020 - 2023, USD Million
- TABLE 158 Italy Mixed Reality Applications in Industrial Safety Market, 2024 - 2031, USD Million
- TABLE 159 Italy Mixed Reality Applications in Industrial Safety Market by Component, 2020 - 2023, USD Million
- TABLE 160 Italy Mixed Reality Applications in Industrial Safety Market by Component, 2024 - 2031, USD Million
- TABLE 161 Italy Mixed Reality Applications in Industrial Safety Market by Application, 2020 - 2023, USD Million
- TABLE 162 Italy Mixed Reality Applications in Industrial Safety Market by Application, 2024 - 2031, USD Million
- TABLE 163 Italy Mixed Reality Applications in Industrial Safety Market by Device Type, 2020 - 2023, USD Million
- TABLE 164 Italy Mixed Reality Applications in Industrial Safety Market by Device Type, 2024 - 2031, USD Million
- TABLE 165 Rest of Europe Mixed Reality Applications in Industrial Safety Market, 2020 - 2023, USD Million
- TABLE 166 Rest of Europe Mixed Reality Applications in Industrial Safety Market, 2024 - 2031, USD Million
- TABLE 167 Rest of Europe Mixed Reality Applications in Industrial Safety Market by Component, 2020 - 2023, USD Million
- TABLE 168 Rest of Europe Mixed Reality Applications in Industrial Safety Market by Component, 2024 - 2031, USD Million
- TABLE 169 Rest of Europe Mixed Reality Applications in Industrial Safety Market by Application, 2020 - 2023, USD Million
- TABLE 170 Rest of Europe Mixed Reality Applications in Industrial Safety Market by Application, 2024 - 2031, USD Million
- TABLE 171 Rest of Europe Mixed Reality Applications in Industrial Safety Market by Device Type, 2020 - 2023, USD Million
- TABLE 172 Rest of Europe Mixed Reality Applications in Industrial Safety Market by Device Type, 2024 - 2031, USD Million
- TABLE 173 Asia Pacific Mixed Reality Applications in Industrial Safety Market, 2020 - 2023, USD Million
- TABLE 174 Asia Pacific Mixed Reality Applications in Industrial Safety Market, 2024 - 2031, USD Million
- TABLE 175 Asia Pacific Mixed Reality Applications in Industrial Safety Market by Component, 2020 - 2023, USD Million
- TABLE 176 Asia Pacific Mixed Reality Applications in Industrial Safety Market by Component, 2024 - 2031, USD Million
- TABLE 177 Asia Pacific Hardware Market by Country, 2020 - 2023, USD Million
- TABLE 178 Asia Pacific Hardware Market by Country, 2024 - 2031, USD Million
- TABLE 179 Asia Pacific Software Market by Country, 2020 - 2023, USD Million
- TABLE 180 Asia Pacific Software Market by Country, 2024 - 2031, USD Million
- TABLE 181 Asia Pacific Mixed Reality Applications in Industrial Safety Market by Application, 2020 - 2023, USD Million
- TABLE 182 Asia Pacific Mixed Reality Applications in Industrial Safety Market by Application, 2024 - 2031, USD Million
- TABLE 183 Asia Pacific Aerospace & Defense Market by Country, 2020 - 2023, USD Million
- TABLE 184 Asia Pacific Aerospace & Defense Market by Country, 2024 - 2031, USD Million
- TABLE 185 Asia Pacific Entertainment & Gaming Market by Country, 2020 - 2023, USD Million
- TABLE 186 Asia Pacific Entertainment & Gaming Market by Country, 2024 - 2031, USD Million
- TABLE 187 Asia Pacific Architecture Market by Country, 2020 - 2023, USD Million
- TABLE 188 Asia Pacific Architecture Market by Country, 2024 - 2031, USD Million
- TABLE 189 Asia Pacific Medical Market by Country, 2020 - 2023, USD Million
- TABLE 190 Asia Pacific Medical Market by Country, 2024 - 2031, USD Million
- TABLE 191 Asia Pacific Other Applications Market by Country, 2020 - 2023, USD Million
- TABLE 192 Asia Pacific Other Applications Market by Country, 2024 - 2031, USD Million
- TABLE 193 Asia Pacific Mixed Reality Applications in Industrial Safety Market by Device Type, 2020 - 2023, USD Million
- TABLE 194 Asia Pacific Mixed Reality Applications in Industrial Safety Market by Device Type, 2024 - 2031, USD Million
- TABLE 195 Asia Pacific Wireless Market by Country, 2020 - 2023, USD Million
- TABLE 196 Asia Pacific Wireless Market by Country, 2024 - 2031, USD Million
- TABLE 197 Asia Pacific Wired Market by Country, 2020 - 2023, USD Million
- TABLE 198 Asia Pacific Wired Market by Country, 2024 - 2031, USD Million
- TABLE 199 Asia Pacific Mixed Reality Applications in Industrial Safety Market by Country, 2020 - 2023, USD Million
- TABLE 200 Asia Pacific Mixed Reality Applications in Industrial Safety Market by Country, 2024 - 2031, USD Million
- TABLE 201 China Mixed Reality Applications in Industrial Safety Market, 2020 - 2023, USD Million
- TABLE 202 China Mixed Reality Applications in Industrial Safety Market, 2024 - 2031, USD Million
- TABLE 203 China Mixed Reality Applications in Industrial Safety Market by Component, 2020 - 2023, USD Million
- TABLE 204 China Mixed Reality Applications in Industrial Safety Market by Component, 2024 - 2031, USD Million
- TABLE 205 China Mixed Reality Applications in Industrial Safety Market by Application, 2020 - 2023, USD Million
- TABLE 206 China Mixed Reality Applications in Industrial Safety Market by Application, 2024 - 2031, USD Million
- TABLE 207 China Mixed Reality Applications in Industrial Safety Market by Device Type, 2020 - 2023, USD Million
- TABLE 208 China Mixed Reality Applications in Industrial Safety Market by Device Type, 2024 - 2031, USD Million
- TABLE 209 Japan Mixed Reality Applications in Industrial Safety Market, 2020 - 2023, USD Million
- TABLE 210 Japan Mixed Reality Applications in Industrial Safety Market, 2024 - 2031, USD Million
- TABLE 211 Japan Mixed Reality Applications in Industrial Safety Market by Component, 2020 - 2023, USD Million
- TABLE 212 Japan Mixed Reality Applications in Industrial Safety Market by Component, 2024 - 2031, USD Million
- TABLE 213 Japan Mixed Reality Applications in Industrial Safety Market by Application, 2020 - 2023, USD Million
- TABLE 214 Japan Mixed Reality Applications in Industrial Safety Market by Application, 2024 - 2031, USD Million
- TABLE 215 Japan Mixed Reality Applications in Industrial Safety Market by Device Type, 2020 - 2023, USD Million
- TABLE 216 Japan Mixed Reality Applications in Industrial Safety Market by Device Type, 2024 - 2031, USD Million
- TABLE 217 India Mixed Reality Applications in Industrial Safety Market, 2020 - 2023, USD Million
- TABLE 218 India Mixed Reality Applications in Industrial Safety Market, 2024 - 2031, USD Million
- TABLE 219 India Mixed Reality Applications in Industrial Safety Market by Component, 2020 - 2023, USD Million
- TABLE 220 India Mixed Reality Applications in Industrial Safety Market by Component, 2024 - 2031, USD Million
- TABLE 221 India Mixed Reality Applications in Industrial Safety Market by Application, 2020 - 2023, USD Million
- TABLE 222 India Mixed Reality Applications in Industrial Safety Market by Application, 2024 - 2031, USD Million
- TABLE 223 India Mixed Reality Applications in Industrial Safety Market by Device Type, 2020 - 2023, USD Million
- TABLE 224 India Mixed Reality Applications in Industrial Safety Market by Device Type, 2024 - 2031, USD Million
- TABLE 225 South Korea Mixed Reality Applications in Industrial Safety Market, 2020 - 2023, USD Million
- TABLE 226 South Korea Mixed Reality Applications in Industrial Safety Market, 2024 - 2031, USD Million
- TABLE 227 South Korea Mixed Reality Applications in Industrial Safety Market by Component, 2020 - 2023, USD Million
- TABLE 228 South Korea Mixed Reality Applications in Industrial Safety Market by Component, 2024 - 2031, USD Million
- TABLE 229 South Korea Mixed Reality Applications in Industrial Safety Market by Application, 2020 - 2023, USD Million
- TABLE 230 South Korea Mixed Reality Applications in Industrial Safety Market by Application, 2024 - 2031, USD Million
- TABLE 231 South Korea Mixed Reality Applications in Industrial Safety Market by Device Type, 2020 - 2023, USD Million
- TABLE 232 South Korea Mixed Reality Applications in Industrial Safety Market by Device Type, 2024 - 2031, USD Million
- TABLE 233 Singapore Mixed Reality Applications in Industrial Safety Market, 2020 - 2023, USD Million
- TABLE 234 Singapore Mixed Reality Applications in Industrial Safety Market, 2024 - 2031, USD Million
- TABLE 235 Singapore Mixed Reality Applications in Industrial Safety Market by Component, 2020 - 2023, USD Million
- TABLE 236 Singapore Mixed Reality Applications in Industrial Safety Market by Component, 2024 - 2031, USD Million
- TABLE 237 Singapore Mixed Reality Applications in Industrial Safety Market by Application, 2020 - 2023, USD Million
- TABLE 238 Singapore Mixed Reality Applications in Industrial Safety Market by Application, 2024 - 2031, USD Million
- TABLE 239 Singapore Mixed Reality Applications in Industrial Safety Market by Device Type, 2020 - 2023, USD Million
- TABLE 240 Singapore Mixed Reality Applications in Industrial Safety Market by Device Type, 2024 - 2031, USD Million
- TABLE 241 Malaysia Mixed Reality Applications in Industrial Safety Market, 2020 - 2023, USD Million
- TABLE 242 Malaysia Mixed Reality Applications in Industrial Safety Market, 2024 - 2031, USD Million
- TABLE 243 Malaysia Mixed Reality Applications in Industrial Safety Market by Component, 2020 - 2023, USD Million
- TABLE 244 Malaysia Mixed Reality Applications in Industrial Safety Market by Component, 2024 - 2031, USD Million
- TABLE 245 Malaysia Mixed Reality Applications in Industrial Safety Market by Application, 2020 - 2023, USD Million
- TABLE 246 Malaysia Mixed Reality Applications in Industrial Safety Market by Application, 2024 - 2031, USD Million
- TABLE 247 Malaysia Mixed Reality Applications in Industrial Safety Market by Device Type, 2020 - 2023, USD Million
- TABLE 248 Malaysia Mixed Reality Applications in Industrial Safety Market by Device Type, 2024 - 2031, USD Million
- TABLE 249 Rest of Asia Pacific Mixed Reality Applications in Industrial Safety Market, 2020 - 2023, USD Million
- TABLE 250 Rest of Asia Pacific Mixed Reality Applications in Industrial Safety Market, 2024 - 2031, USD Million
- TABLE 251 Rest of Asia Pacific Mixed Reality Applications in Industrial Safety Market by Component, 2020 - 2023, USD Million
- TABLE 252 Rest of Asia Pacific Mixed Reality Applications in Industrial Safety Market by Component, 2024 - 2031, USD Million
- TABLE 253 Rest of Asia Pacific Mixed Reality Applications in Industrial Safety Market by Application, 2020 - 2023, USD Million
- TABLE 254 Rest of Asia Pacific Mixed Reality Applications in Industrial Safety Market by Application, 2024 - 2031, USD Million
- TABLE 255 Rest of Asia Pacific Mixed Reality Applications in Industrial Safety Market by Device Type, 2020 - 2023, USD Million
- TABLE 256 Rest of Asia Pacific Mixed Reality Applications in Industrial Safety Market by Device Type, 2024 - 2031, USD Million
- TABLE 257 LAMEA Mixed Reality Applications in Industrial Safety Market, 2020 - 2023, USD Million
- TABLE 258 LAMEA Mixed Reality Applications in Industrial Safety Market, 2024 - 2031, USD Million
- TABLE 259 LAMEA Mixed Reality Applications in Industrial Safety Market by Component, 2020 - 2023, USD Million
- TABLE 260 LAMEA Mixed Reality Applications in Industrial Safety Market by Component, 2024 - 2031, USD Million
- TABLE 261 LAMEA Hardware Market by Country, 2020 - 2023, USD Million
- TABLE 262 LAMEA Hardware Market by Country, 2024 - 2031, USD Million
- TABLE 263 LAMEA Software Market by Country, 2020 - 2023, USD Million
- TABLE 264 LAMEA Software Market by Country, 2024 - 2031, USD Million
- TABLE 265 LAMEA Mixed Reality Applications in Industrial Safety Market by Application, 2020 - 2023, USD Million
- TABLE 266 LAMEA Mixed Reality Applications in Industrial Safety Market by Application, 2024 - 2031, USD Million
- TABLE 267 LAMEA Aerospace & Defense Market by Country, 2020 - 2023, USD Million
- TABLE 268 LAMEA Aerospace & Defense Market by Country, 2024 - 2031, USD Million
- TABLE 269 LAMEA Entertainment & Gaming Market by Country, 2020 - 2023, USD Million
- TABLE 270 LAMEA Entertainment & Gaming Market by Country, 2024 - 2031, USD Million
- TABLE 271 LAMEA Architecture Market by Country, 2020 - 2023, USD Million
- TABLE 272 LAMEA Architecture Market by Country, 2024 - 2031, USD Million
- TABLE 273 LAMEA Medical Market by Country, 2020 - 2023, USD Million
- TABLE 274 LAMEA Medical Market by Country, 2024 - 2031, USD Million
- TABLE 275 LAMEA Other Applications Market by Country, 2020 - 2023, USD Million
- TABLE 276 LAMEA Other Applications Market by Country, 2024 - 2031, USD Million
- TABLE 277 LAMEA Mixed Reality Applications in Industrial Safety Market by Device Type, 2020 - 2023, USD Million
- TABLE 278 LAMEA Mixed Reality Applications in Industrial Safety Market by Device Type, 2024 - 2031, USD Million
- TABLE 279 LAMEA Wireless Market by Country, 2020 - 2023, USD Million
- TABLE 280 LAMEA Wireless Market by Country, 2024 - 2031, USD Million
- TABLE 281 LAMEA Wired Market by Country, 2020 - 2023, USD Million
- TABLE 282 LAMEA Wired Market by Country, 2024 - 2031, USD Million
- TABLE 283 LAMEA Mixed Reality Applications in Industrial Safety Market by Country, 2020 - 2023, USD Million
- TABLE 284 LAMEA Mixed Reality Applications in Industrial Safety Market by Country, 2024 - 2031, USD Million
- TABLE 285 Brazil Mixed Reality Applications in Industrial Safety Market, 2020 - 2023, USD Million
- TABLE 286 Brazil Mixed Reality Applications in Industrial Safety Market, 2024 - 2031, USD Million
- TABLE 287 Brazil Mixed Reality Applications in Industrial Safety Market by Component, 2020 - 2023, USD Million
- TABLE 288 Brazil Mixed Reality Applications in Industrial Safety Market by Component, 2024 - 2031, USD Million
- TABLE 289 Brazil Mixed Reality Applications in Industrial Safety Market by Application, 2020 - 2023, USD Million
- TABLE 290 Brazil Mixed Reality Applications in Industrial Safety Market by Application, 2024 - 2031, USD Million
- TABLE 291 Brazil Mixed Reality Applications in Industrial Safety Market by Device Type, 2020 - 2023, USD Million
- TABLE 292 Brazil Mixed Reality Applications in Industrial Safety Market by Device Type, 2024 - 2031, USD Million
- TABLE 293 Argentina Mixed Reality Applications in Industrial Safety Market, 2020 - 2023, USD Million
- TABLE 294 Argentina Mixed Reality Applications in Industrial Safety Market, 2024 - 2031, USD Million
- TABLE 295 Argentina Mixed Reality Applications in Industrial Safety Market by Component, 2020 - 2023, USD Million
- TABLE 296 Argentina Mixed Reality Applications in Industrial Safety Market by Component, 2024 - 2031, USD Million
- TABLE 297 Argentina Mixed Reality Applications in Industrial Safety Market by Application, 2020 - 2023, USD Million
- TABLE 298 Argentina Mixed Reality Applications in Industrial Safety Market by Application, 2024 - 2031, USD Million
- TABLE 299 Argentina Mixed Reality Applications in Industrial Safety Market by Device Type, 2020 - 2023, USD Million
- TABLE 300 Argentina Mixed Reality Applications in Industrial Safety Market by Device Type, 2024 - 2031, USD Million
- TABLE 301 UAE Mixed Reality Applications in Industrial Safety Market, 2020 - 2023, USD Million
- TABLE 302 UAE Mixed Reality Applications in Industrial Safety Market, 2024 - 2031, USD Million
- TABLE 303 UAE Mixed Reality Applications in Industrial Safety Market by Component, 2020 - 2023, USD Million
- TABLE 304 UAE Mixed Reality Applications in Industrial Safety Market by Component, 2024 - 2031, USD Million
- TABLE 305 UAE Mixed Reality Applications in Industrial Safety Market by Application, 2020 - 2023, USD Million
- TABLE 306 UAE Mixed Reality Applications in Industrial Safety Market by Application, 2024 - 2031, USD Million
- TABLE 307 UAE Mixed Reality Applications in Industrial Safety Market by Device Type, 2020 - 2023, USD Million
- TABLE 308 UAE Mixed Reality Applications in Industrial Safety Market by Device Type, 2024 - 2031, USD Million
- TABLE 309 Saudi Arabia Mixed Reality Applications in Industrial Safety Market, 2020 - 2023, USD Million
- TABLE 310 Saudi Arabia Mixed Reality Applications in Industrial Safety Market, 2024 - 2031, USD Million
- TABLE 311 Saudi Arabia Mixed Reality Applications in Industrial Safety Market by Component, 2020 - 2023, USD Million
- TABLE 312 Saudi Arabia Mixed Reality Applications in Industrial Safety Market by Component, 2024 - 2031, USD Million
- TABLE 313 Saudi Arabia Mixed Reality Applications in Industrial Safety Market by Application, 2020 - 2023, USD Million
- TABLE 314 Saudi Arabia Mixed Reality Applications in Industrial Safety Market by Application, 2024 - 2031, USD Million
- TABLE 315 Saudi Arabia Mixed Reality Applications in Industrial Safety Market by Device Type, 2020 - 2023, USD Million
- TABLE 316 Saudi Arabia Mixed Reality Applications in Industrial Safety Market by Device Type, 2024 - 2031, USD Million
- TABLE 317 South Africa Mixed Reality Applications in Industrial Safety Market, 2020 - 2023, USD Million
- TABLE 318 South Africa Mixed Reality Applications in Industrial Safety Market, 2024 - 2031, USD Million
- TABLE 319 South Africa Mixed Reality Applications in Industrial Safety Market by Component, 2020 - 2023, USD Million
- TABLE 320 South Africa Mixed Reality Applications in Industrial Safety Market by Component, 2024 - 2031, USD Million
- TABLE 321 South Africa Mixed Reality Applications in Industrial Safety Market by Application, 2020 - 2023, USD Million
- TABLE 322 South Africa Mixed Reality Applications in Industrial Safety Market by Application, 2024 - 2031, USD Million
- TABLE 323 South Africa Mixed Reality Applications in Industrial Safety Market by Device Type, 2020 - 2023, USD Million
- TABLE 324 South Africa Mixed Reality Applications in Industrial Safety Market by Device Type, 2024 - 2031, USD Million
- TABLE 325 Nigeria Mixed Reality Applications in Industrial Safety Market, 2020 - 20
The Global Mixed Reality Applications in Industrial Safety Market size is expected to reach $6.7 billion by 2031, rising at a market growth of 33.5% CAGR during the forecast period.
The North America region witnessed 38% revenue share in this market in 2023. The sophisticated technological infrastructure, large investments in innovation, and the existence of important market players in the area are all responsible for this dominant position. The strong focus on improving workplace safety and enhancing operational efficiency through cutting-edge technologies has driven the adoption of mixed reality solutions in manufacturing, construction, and energy industries.
Workplace safety is a growing concern, particularly in high-risk manufacturing, construction, and oil and gas sectors. The increasing number of workplace accidents and fatalities has pressured organizations to adopt more effective safety measures. Mixed reality (MR) applications provide a solution by allowing workers to be trained in immersive environments that simulate real-life hazardous situations. Therefore, the rising demand for enhanced workplace safety and risk management solutions propels the market's growth.
Additionally, The growing emphasis on real-time monitoring in industrial settings drives the demand for mixed reality applications. Traditional safety methods often involve periodic inspections or reactive measures, which can fail to prevent accidents in time. With the integration of MR, real-time data from sensors, equipment, and environmental factors can be overlaid on workers' vision, providing instant feedback on potential hazards. Thus, increasing focus on real-time monitoring and preventive safety measures propels the market's growth.
However, One of the major challenges for the widespread adoption of this is the high initial investment and integration costs. Implementing MR solutions requires businesses to invest in specialized hardware such as headsets, sensors, computing infrastructure, and software development tailored to specific industrial needs. Therefore, high initial investment and integration costs hinder the market's growth.
Component Outlook
Based on component, the mixed reality applications in industrial safety market is divided into hardware and software. The software segment procured 38% revenue share in this market in 2023. The growing demand for specialized apps and platforms facilitating mixed reality experiences fuels the software segment's expansion. This includes software for simulation, training, real-time data visualization, and remote collaboration, all of which play a vital role in enhancing industrial safety.
Application Outlook
By application, the mixed reality applications in industrial safety market is divided into aerospace & defense, entertainment & gaming, architecture, medical, and others. The medical segment attained 26% revenue share in this market in 2023. Adopting mixed reality in the medical field is driven by the need for advanced training tools, precise surgical planning, and improved patient outcomes. Medical professionals can practice processes in a risk-free virtual environment with the help of MR applications, which provide immersive training experiences.
Device Type Outlook
On the basis of device type, the mixed reality applications in industrial safety market is segmented into wireless and wired. In 2023, the wired segment attained 30% revenue share in this market. Wired mixed reality devices are often preferred for applications that require high-fidelity graphics and stable connectivity, such as detailed simulations and complex training programs. These devices typically offer superior latency and visual quality performance, crucial for tasks that demand precision and accuracy.
Regional Outlook
Region-wise, the mixed reality applications in industrial safety market is analyzed across North America, Europe, Asia Pacific, and LAMEA. In 2023, the Europe region generated 30% revenue share in this market. Europe's significant share is driven by the region's strong emphasis on workplace safety regulations and the adoption of innovative technologies to comply with stringent safety standards. European industries, particularly in countries like Germany, the UK, and France, increasingly leverage mixed reality applications to train workers, conduct remote inspections, and enhance safety protocols.
List of Key Companies Profiled
- Microsoft Corporation
- Google LLC
- Canon, Inc. (Canon Medical Systems Corporation)
- Samsung Electronics Co., Ltd. (Samsung Health)
- Meta Platforms, Inc.
- HTC Corporation
- Dell Technologies, Inc.
- PTC Inc.
- Hewlett Packard Enterprise Company
- Niantic, Inc.
Global Mixed Reality Applications in Industrial Safety Market Report Segmentation
By Component
- Hardware
- Software
By Application
- Aerospace & Defense
- Entertainment & Gaming
- Architecture
- Medical
- Other Applications
By Device Type
- Wireless
- Wired
By Geography
- North America
- US
- Canada
- Mexico
- Rest of North America
- Europe
- Germany
- UK
- France
- Russia
- Spain
- Italy
- Rest of Europe
- Asia Pacific
- China
- Japan
- India
- South Korea
- Singapore
- Malaysia
- Rest of Asia Pacific
- LAMEA
- Brazil
- Argentina
- UAE
- Saudi Arabia
- South Africa
- Nigeria
- Rest of LAMEA
Table of Contents
Chapter 1. Market Scope & Methodology
- 1.1 Market Definition
- 1.2 Objectives
- 1.3 Market Scope
- 1.4 Segmentation
- 1.4.1 Global Mixed Reality Applications in Industrial Safety Market, by Component
- 1.4.2 Global Mixed Reality Applications in Industrial Safety Market, by Application
- 1.4.3 Global Mixed Reality Applications in Industrial Safety Market, by Device Type
- 1.4.4 Global Mixed Reality Applications in Industrial Safety Market, by Geography
- 1.5 Methodology for the research
Chapter 2. Market at a Glance
- 2.1 Key Highlights
Chapter 3. Market Overview
- 3.1 Introduction
- 3.1.1 Overview
- 3.1.1.1 Market Composition and Scenario
- 3.1.1 Overview
- 3.2 Key Factors Impacting the Market
- 3.2.1 Market Drivers
- 3.2.2 Market Restraints
- 3.2.3 Market Opportunities
- 3.2.4 Market Challenges
Chapter 4. Competition Analysis - Global
- 4.1 Market Share Analysis, 2023
- 4.2 Porter Five Forces Analysis
Chapter 5. Global Mixed Reality Applications in Industrial Safety Market by Component
- 5.1 Global Hardware Market by Region
- 5.2 Global Software Market by Region
Chapter 6. Global Mixed Reality Applications in Industrial Safety Market by Application
- 6.1 Global Aerospace & Defense Market by Region
- 6.2 Global Entertainment & Gaming Market by Region
- 6.3 Global Architecture Market by Region
- 6.4 Global Medical Market by Region
- 6.5 Global Other Applications Market by Region
Chapter 7. Global Mixed Reality Applications in Industrial Safety Market by Device Type
- 7.1 Global Wireless Market by Region
- 7.2 Global Wired Market by Region
Chapter 8. Global Mixed Reality Applications in Industrial Safety Market by Region
- 8.1 North America Mixed Reality Applications in Industrial Safety Market
- 8.1.1 North America Mixed Reality Applications in Industrial Safety Market by Component
- 8.1.1.1 North America Hardware Market by Country
- 8.1.1.2 North America Software Market by Country
- 8.1.2 North America Mixed Reality Applications in Industrial Safety Market by Application
- 8.1.2.1 North America Aerospace & Defense Market by Country
- 8.1.2.2 North America Entertainment & Gaming Market by Country
- 8.1.2.3 North America Architecture Market by Country
- 8.1.2.4 North America Medical Market by Country
- 8.1.2.5 North America Other Applications Market by Country
- 8.1.3 North America Mixed Reality Applications in Industrial Safety Market by Device Type
- 8.1.3.1 North America Wireless Market by Country
- 8.1.3.2 North America Wired Market by Country
- 8.1.4 North America Mixed Reality Applications in Industrial Safety Market by Country
- 8.1.4.1 US Mixed Reality Applications in Industrial Safety Market
- 8.1.4.1.1 US Mixed Reality Applications in Industrial Safety Market by Component
- 8.1.4.1.2 US Mixed Reality Applications in Industrial Safety Market by Application
- 8.1.4.1.3 US Mixed Reality Applications in Industrial Safety Market by Device Type
- 8.1.4.2 Canada Mixed Reality Applications in Industrial Safety Market
- 8.1.4.2.1 Canada Mixed Reality Applications in Industrial Safety Market by Component
- 8.1.4.2.2 Canada Mixed Reality Applications in Industrial Safety Market by Application
- 8.1.4.2.3 Canada Mixed Reality Applications in Industrial Safety Market by Device Type
- 8.1.4.3 Mexico Mixed Reality Applications in Industrial Safety Market
- 8.1.4.3.1 Mexico Mixed Reality Applications in Industrial Safety Market by Component
- 8.1.4.3.2 Mexico Mixed Reality Applications in Industrial Safety Market by Application
- 8.1.4.3.3 Mexico Mixed Reality Applications in Industrial Safety Market by Device Type
- 8.1.4.4 Rest of North America Mixed Reality Applications in Industrial Safety Market
- 8.1.4.4.1 Rest of North America Mixed Reality Applications in Industrial Safety Market by Component
- 8.1.4.4.2 Rest of North America Mixed Reality Applications in Industrial Safety Market by Application
- 8.1.4.4.3 Rest of North America Mixed Reality Applications in Industrial Safety Market by Device Type
- 8.1.4.1 US Mixed Reality Applications in Industrial Safety Market
- 8.1.1 North America Mixed Reality Applications in Industrial Safety Market by Component
- 8.2 Europe Mixed Reality Applications in Industrial Safety Market
- 8.2.1 Europe Mixed Reality Applications in Industrial Safety Market by Component
- 8.2.1.1 Europe Hardware Market by Country
- 8.2.1.2 Europe Software Market by Country
- 8.2.2 Europe Mixed Reality Applications in Industrial Safety Market by Application
- 8.2.2.1 Europe Aerospace & Defense Market by Country
- 8.2.2.2 Europe Entertainment & Gaming Market by Country
- 8.2.2.3 Europe Architecture Market by Country
- 8.2.2.4 Europe Medical Market by Country
- 8.2.2.5 Europe Other Applications Market by Country
- 8.2.3 Europe Mixed Reality Applications in Industrial Safety Market by Device Type
- 8.2.3.1 Europe Wireless Market by Country
- 8.2.3.2 Europe Wired Market by Country
- 8.2.4 Europe Mixed Reality Applications in Industrial Safety Market by Country
- 8.2.4.1 Germany Mixed Reality Applications in Industrial Safety Market
- 8.2.4.1.1 Germany Mixed Reality Applications in Industrial Safety Market by Component
- 8.2.4.1.2 Germany Mixed Reality Applications in Industrial Safety Market by Application
- 8.2.4.1.3 Germany Mixed Reality Applications in Industrial Safety Market by Device Type
- 8.2.4.2 UK Mixed Reality Applications in Industrial Safety Market
- 8.2.4.2.1 UK Mixed Reality Applications in Industrial Safety Market by Component
- 8.2.4.2.2 UK Mixed Reality Applications in Industrial Safety Market by Application
- 8.2.4.2.3 UK Mixed Reality Applications in Industrial Safety Market by Device Type
- 8.2.4.3 France Mixed Reality Applications in Industrial Safety Market
- 8.2.4.3.1 France Mixed Reality Applications in Industrial Safety Market by Component
- 8.2.4.3.2 France Mixed Reality Applications in Industrial Safety Market by Application
- 8.2.4.3.3 France Mixed Reality Applications in Industrial Safety Market by Device Type
- 8.2.4.4 Russia Mixed Reality Applications in Industrial Safety Market
- 8.2.4.4.1 Russia Mixed Reality Applications in Industrial Safety Market by Component
- 8.2.4.4.2 Russia Mixed Reality Applications in Industrial Safety Market by Application
- 8.2.4.4.3 Russia Mixed Reality Applications in Industrial Safety Market by Device Type
- 8.2.4.5 Spain Mixed Reality Applications in Industrial Safety Market
- 8.2.4.5.1 Spain Mixed Reality Applications in Industrial Safety Market by Component
- 8.2.4.5.2 Spain Mixed Reality Applications in Industrial Safety Market by Application
- 8.2.4.5.3 Spain Mixed Reality Applications in Industrial Safety Market by Device Type
- 8.2.4.6 Italy Mixed Reality Applications in Industrial Safety Market
- 8.2.4.6.1 Italy Mixed Reality Applications in Industrial Safety Market by Component
- 8.2.4.6.2 Italy Mixed Reality Applications in Industrial Safety Market by Application
- 8.2.4.6.3 Italy Mixed Reality Applications in Industrial Safety Market by Device Type
- 8.2.4.7 Rest of Europe Mixed Reality Applications in Industrial Safety Market
- 8.2.4.7.1 Rest of Europe Mixed Reality Applications in Industrial Safety Market by Component
- 8.2.4.7.2 Rest of Europe Mixed Reality Applications in Industrial Safety Market by Application
- 8.2.4.7.3 Rest of Europe Mixed Reality Applications in Industrial Safety Market by Device Type
- 8.2.4.1 Germany Mixed Reality Applications in Industrial Safety Market
- 8.2.1 Europe Mixed Reality Applications in Industrial Safety Market by Component
- 8.3 Asia Pacific Mixed Reality Applications in Industrial Safety Market
- 8.3.1 Asia Pacific Mixed Reality Applications in Industrial Safety Market by Component
- 8.3.1.1 Asia Pacific Hardware Market by Country
- 8.3.1.2 Asia Pacific Software Market by Country
- 8.3.2 Asia Pacific Mixed Reality Applications in Industrial Safety Market by Application
- 8.3.2.1 Asia Pacific Aerospace & Defense Market by Country
- 8.3.2.2 Asia Pacific Entertainment & Gaming Market by Country
- 8.3.2.3 Asia Pacific Architecture Market by Country
- 8.3.2.4 Asia Pacific Medical Market by Country
- 8.3.2.5 Asia Pacific Other Applications Market by Country
- 8.3.3 Asia Pacific Mixed Reality Applications in Industrial Safety Market by Device Type
- 8.3.3.1 Asia Pacific Wireless Market by Country
- 8.3.3.2 Asia Pacific Wired Market by Country
- 8.3.4 Asia Pacific Mixed Reality Applications in Industrial Safety Market by Country
- 8.3.4.1 China Mixed Reality Applications in Industrial Safety Market
- 8.3.4.1.1 China Mixed Reality Applications in Industrial Safety Market by Component
- 8.3.4.1.2 China Mixed Reality Applications in Industrial Safety Market by Application
- 8.3.4.1.3 China Mixed Reality Applications in Industrial Safety Market by Device Type
- 8.3.4.2 Japan Mixed Reality Applications in Industrial Safety Market
- 8.3.4.2.1 Japan Mixed Reality Applications in Industrial Safety Market by Component
- 8.3.4.2.2 Japan Mixed Reality Applications in Industrial Safety Market by Application
- 8.3.4.2.3 Japan Mixed Reality Applications in Industrial Safety Market by Device Type
- 8.3.4.3 India Mixed Reality Applications in Industrial Safety Market
- 8.3.4.3.1 India Mixed Reality Applications in Industrial Safety Market by Component
- 8.3.4.3.2 India Mixed Reality Applications in Industrial Safety Market by Application
- 8.3.4.3.3 India Mixed Reality Applications in Industrial Safety Market by Device Type
- 8.3.4.4 South Korea Mixed Reality Applications in Industrial Safety Market
- 8.3.4.4.1 South Korea Mixed Reality Applications in Industrial Safety Market by Component
- 8.3.4.4.2 South Korea Mixed Reality Applications in Industrial Safety Market by Application
- 8.3.4.4.3 South Korea Mixed Reality Applications in Industrial Safety Market by Device Type
- 8.3.4.5 Singapore Mixed Reality Applications in Industrial Safety Market
- 8.3.4.5.1 Singapore Mixed Reality Applications in Industrial Safety Market by Component
- 8.3.4.5.2 Singapore Mixed Reality Applications in Industrial Safety Market by Application
- 8.3.4.5.3 Singapore Mixed Reality Applications in Industrial Safety Market by Device Type
- 8.3.4.6 Malaysia Mixed Reality Applications in Industrial Safety Market
- 8.3.4.6.1 Malaysia Mixed Reality Applications in Industrial Safety Market by Component
- 8.3.4.6.2 Malaysia Mixed Reality Applications in Industrial Safety Market by Application
- 8.3.4.6.3 Malaysia Mixed Reality Applications in Industrial Safety Market by Device Type
- 8.3.4.7 Rest of Asia Pacific Mixed Reality Applications in Industrial Safety Market
- 8.3.4.7.1 Rest of Asia Pacific Mixed Reality Applications in Industrial Safety Market by Component
- 8.3.4.7.2 Rest of Asia Pacific Mixed Reality Applications in Industrial Safety Market by Application
- 8.3.4.7.3 Rest of Asia Pacific Mixed Reality Applications in Industrial Safety Market by Device Type
- 8.3.4.1 China Mixed Reality Applications in Industrial Safety Market
- 8.3.1 Asia Pacific Mixed Reality Applications in Industrial Safety Market by Component
- 8.4 LAMEA Mixed Reality Applications in Industrial Safety Market
- 8.4.1 LAMEA Mixed Reality Applications in Industrial Safety Market by Component
- 8.4.1.1 LAMEA Hardware Market by Country
- 8.4.1.2 LAMEA Software Market by Country
- 8.4.2 LAMEA Mixed Reality Applications in Industrial Safety Market by Application
- 8.4.2.1 LAMEA Aerospace & Defense Market by Country
- 8.4.2.2 LAMEA Entertainment & Gaming Market by Country
- 8.4.2.3 LAMEA Architecture Market by Country
- 8.4.2.4 LAMEA Medical Market by Country
- 8.4.2.5 LAMEA Other Applications Market by Country
- 8.4.3 LAMEA Mixed Reality Applications in Industrial Safety Market by Device Type
- 8.4.3.1 LAMEA Wireless Market by Country
- 8.4.3.2 LAMEA Wired Market by Country
- 8.4.4 LAMEA Mixed Reality Applications in Industrial Safety Market by Country
- 8.4.4.1 Brazil Mixed Reality Applications in Industrial Safety Market
- 8.4.4.1.1 Brazil Mixed Reality Applications in Industrial Safety Market by Component
- 8.4.4.1.2 Brazil Mixed Reality Applications in Industrial Safety Market by Application
- 8.4.4.1.3 Brazil Mixed Reality Applications in Industrial Safety Market by Device Type
- 8.4.4.2 Argentina Mixed Reality Applications in Industrial Safety Market
- 8.4.4.2.1 Argentina Mixed Reality Applications in Industrial Safety Market by Component
- 8.4.4.2.2 Argentina Mixed Reality Applications in Industrial Safety Market by Application
- 8.4.4.2.3 Argentina Mixed Reality Applications in Industrial Safety Market by Device Type
- 8.4.4.3 UAE Mixed Reality Applications in Industrial Safety Market
- 8.4.4.3.1 UAE Mixed Reality Applications in Industrial Safety Market by Component
- 8.4.4.3.2 UAE Mixed Reality Applications in Industrial Safety Market by Application
- 8.4.4.3.3 UAE Mixed Reality Applications in Industrial Safety Market by Device Type
- 8.4.4.4 Saudi Arabia Mixed Reality Applications in Industrial Safety Market
- 8.4.4.4.1 Saudi Arabia Mixed Reality Applications in Industrial Safety Market by Component
- 8.4.4.4.2 Saudi Arabia Mixed Reality Applications in Industrial Safety Market by Application
- 8.4.4.4.3 Saudi Arabia Mixed Reality Applications in Industrial Safety Market by Device Type
- 8.4.4.5 South Africa Mixed Reality Applications in Industrial Safety Market
- 8.4.4.5.1 South Africa Mixed Reality Applications in Industrial Safety Market by Component
- 8.4.4.5.2 South Africa Mixed Reality Applications in Industrial Safety Market by Application
- 8.4.4.5.3 South Africa Mixed Reality Applications in Industrial Safety Market by Device Type
- 8.4.4.6 Nigeria Mixed Reality Applications in Industrial Safety Market
- 8.4.4.6.1 Nigeria Mixed Reality Applications in Industrial Safety Market by Component
- 8.4.4.6.2 Nigeria Mixed Reality Applications in Industrial Safety Market by Application
- 8.4.4.6.3 Nigeria Mixed Reality Applications in Industrial Safety Market by Device Type
- 8.4.4.7 Rest of LAMEA Mixed Reality Applications in Industrial Safety Market
- 8.4.4.7.1 Rest of LAMEA Mixed Reality Applications in Industrial Safety Market by Component
- 8.4.4.7.2 Rest of LAMEA Mixed Reality Applications in Industrial Safety Market by Application
- 8.4.4.7.3 Rest of LAMEA Mixed Reality Applications in Industrial Safety Market by Device Type
- 8.4.4.1 Brazil Mixed Reality Applications in Industrial Safety Market
- 8.4.1 LAMEA Mixed Reality Applications in Industrial Safety Market by Component
Chapter 9. Company Profiles
- 9.1 Microsoft Corporation
- 9.1.1 Company Overview
- 9.1.2 Financial Analysis
- 9.1.3 Segmental and Regional Analysis
- 9.1.4 Research & Development Expenses
- 9.1.5 Recent strategies and developments:
- 9.1.5.1 Product Launches and Product Expansions:
- 9.1.6 SWOT Analysis
- 9.2 Google LLC (Alphabet Inc.)
- 9.2.1 Company Overview
- 9.2.2 Financial Analysis
- 9.2.3 Segmental and Regional Analysis
- 9.2.4 Research & Development Expense
- 9.2.5 Recent strategies and developments:
- 9.2.5.1 Partnerships, Collaborations, and Agreements:
- 9.2.6 SWOT Analysis
- 9.3 Canon, Inc.
- 9.3.1 Company Overview
- 9.3.2 Financial Analysis
- 9.3.3 Segmental and Regional Analysis
- 9.3.4 Research & Development Expenses
- 9.3.5 SWOT Analysis
- 9.4 Samsung Electronics Co., Ltd. (Samsung Health)
- 9.4.1 Company Overview
- 9.4.2 Financial Analysis
- 9.4.3 Segmental and Regional Analysis
- 9.4.4 Research & Development Expenses
- 9.4.5 SWOT Analysis
- 9.5 Meta Platforms, Inc.
- 9.5.1 Company Overview
- 9.5.2 Financial Analysis
- 9.5.3 Segment and Regional Analysis
- 9.5.4 Research & Development Expense
- 9.5.5 SWOT Analysis
- 9.6 HTC Corporation
- 9.6.1 Company Overview
- 9.6.2 Financial Analysis
- 9.6.3 Research & Development Expenses
- 9.6.4 SWOT Analysis
- 9.7 Dell Technologies, Inc.
- 9.7.1 Company Overview
- 9.7.2 Financial Analysis
- 9.7.3 Segmental and Regional Analysis
- 9.7.4 Research & Development Expense
- 9.7.5 SWOT Analysis
- 9.8 PTC, Inc.
- 9.8.1 Company Overview
- 9.8.2 Financial Analysis
- 9.8.3 Regional Analysis
- 9.8.4 Research & Development Expenses
- 9.8.5 SWOT Analysis
- 9.9 Hewlett Packard Enterprise Company
- 9.9.1 Company Overview
- 9.9.2 Financial Analysis
- 9.9.3 Segmental and Regional Analysis
- 9.9.4 Research & Development Expense
- 9.9.5 SWOT Analysis
- 9.10. Niantic, Inc.
- 9.10.1 Company Overview
