|
|
市場調査レポート
商品コード
1401280
バーチャルスポーツの世界市場規模、シェア、産業動向分析レポート:ゲーム別、コンポーネント別、デモグラフィック別、地域別展望と予測、2023年~2030年Global Virtual Sports Market Size, Share & Industry Trends Analysis Report By Game, By Component, By Demographic, By Regional Outlook and Forecast, 2023 - 2030 |
||||||

|
|||||||
|
|||||||

| バーチャルスポーツの世界市場規模、シェア、産業動向分析レポート:ゲーム別、コンポーネント別、デモグラフィック別、地域別展望と予測、2023年~2030年 |
|
出版日: 2023年12月21日
発行: KBV Research
ページ情報: 英文 266 Pages
納期: 即納可能
|

全表示
- 概要
- 図表
- 目次
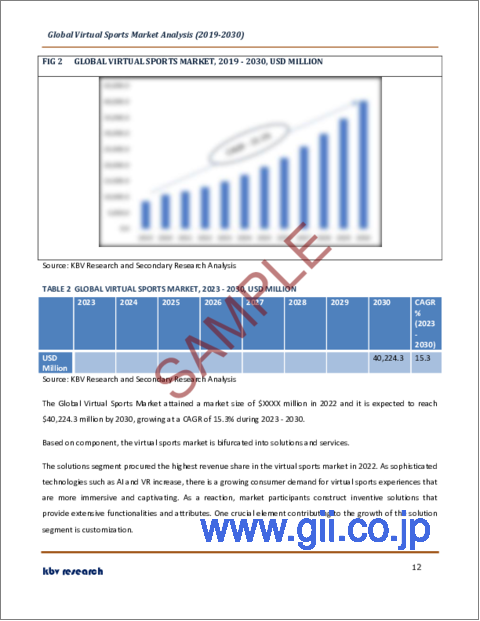
バーチャルスポーツの市場規模は、2030年までに402億米ドルに達すると予測され、予測期間中のCAGRは15.3%の市場成長率で上昇します。
しかし、ライセンシング、データ保護、消費者保護プロトコルの実施などが前提条件となる可能性があります。バーチャルスポーツ事業者は、これらの規制を遵守するために時間とコストがかかり、市場に参入できる事業者の数が制限される可能性があります。さらに、消費者が利用できるサービスやソリューションの幅が狭まり、市場の拡大が阻害される可能性もあります。さらに、バーチャル・スポーツを管理する規制環境は刻々と変化するため、不確実性が生じ、市場投資が制限される可能性があります。そのため、規制や法的枠組みの変更は、市場の拡大や進展に影響を与える可能性があります。
ゲームの展望
ゲームは、サッカー、クリケット、レース、ゴルフ、バスケットボール、スキー、テニス、MMA、その他に分類されます。サッカー分野は2022年に市場で最大の収益シェアを記録しました。esportsが脚光を浴びるにつれ、好みのスポーツに参加する革新的でスリリングな方法としてバーチャルスポーツを選ぶ個人が増加しています。サッカーゲームはこの現象の先陣を切っており、プレイヤーは有名なサッカーリーグやチームと仮想対戦を行うことができます。バーチャル・スポーツのスリルと手軽さを知る人が増えるにつれ、この拡大は今後も続くと予想されます。
コンポーネントの展望
コンポーネントに基づき、市場はソリューションとサービスに二分されます。2022年には、サービス分野が市場で大きな収益シェアを獲得しました。バーチャル・スポーツ・ソフトウェア・メーカーは、バーチャル・スポーツ・ベッティング・アプリケーションを作成するためのホワイトラベル・サービスや専門サービスを提供しています。サービスは、ユーザーの興味を引く、視覚的に華やかでインタラクティブなバーチャル・スポーツ・アプリケーションの作成を支援するために利用することができます。数多くのサービスプロバイダーはさらに、費用対効果の高いサービス、完全にカスタマイズされたバーチャルスポーツ開発サービス、24時間体制のカスタマーサポート、最先端技術の統合、時間厳守の納品、カスタマイズされたソリューションを提供しています。
デモグラフィック
デモグラフィックは21歳以下、21~35歳、35~54歳、54歳以上に分類されます。21~35歳のセグメントは、2022年の市場で最大の収益シェアを獲得しました。この年齢層は、テクノロジーやオンライン・エンターテインメントに精通したデジタル・ネイティブです。彼らは、オンライン・プラットフォーム、モバイル・デバイス、ゲーム機から簡単にアクセスできるバーチャル・スポーツを探求し、夢中になる傾向が強いです。バーチャル・スポーツは、オンデマンドで利用でき、さまざまなデジタル・プラットフォームからアクセスできるため、利便性が高いです。いつでもシミュレーション・スポーツ・イベントに参加できる柔軟性は、利便性と柔軟性を重視するこの年齢層のライフスタイルに合致しています。
地域別展望
地域別に見ると、市場は北米、欧州、アジア太平洋、LAMEAで分析されます。2022年には、アジア太平洋地域が市場で最大の収益シェアを獲得しました。急速な拡大は、この地域が最先端技術を広く採用していることが寄与しています。韓国、日本、中国などの著名な国々が、その強力なインフラによってこの技術革命の先陣を切っており、市場の拡大を促進しています。堅牢なゲーム機、高性能パーソナル・コンピューターの出現、バーチャル・リアリティ(VR)および拡張現実(AR)デバイスの普及的な統合が、バーチャル・スポーツの進歩と広範な受容のための強力な基盤を確立しました。
目次
第1章 市場範囲と調査手法
- 市場の定義
- 目的
- 市場範囲
- セグメンテーション
- 調査手法
第2章 市場要覧
- 主なハイライト
第3章 市場概要
- イントロダクション
- 概要
- 市場構成とシナリオ
- 概要
- 市場に影響を与える主な要因
- 市場促進要因
- 市場抑制要因
- ポーターのファイブフォース分析
第4章 バーチャルスポーツ市場で展開される戦略
第5章 世界市場:ゲーム別
- 世界のサッカー市場:地域別
- 世界のレーシング市場:地域別
- 世界のゴルフ市場:地域別
- 世界のバスケットボール市場:地域別
- 世界のクリケット市場:地域別
- 世界のスキー市場:地域別
- 世界のテニス市場:地域別
- 世界のMMA市場:地域別
- 世界のその他の市場:地域別
第6章 世界市場:コンポーネント別
- 世界のソリューション市場:地域別
- 世界のサービス市場:地域別
第7章 世界市場:デモグラフィック別
- 世界の21~35歳市場:地域別
- 世界の21歳未満市場:地域別
- 世界の35~54歳市場:地域別
- 世界の54歳超市場:地域別
第8章 世界市場:地域別
- 北米
- 北米の市場:国別
- 米国
- カナダ
- メキシコ
- その他北米地域
- 北米の市場:国別
- 欧州
- 欧州の市場:国別
- ドイツ
- 英国
- フランス
- ロシア
- スペイン
- イタリア
- その他欧州地域
- 欧州の市場:国別
- アジア太平洋
- アジア太平洋の市場:国別
- 中国
- 日本
- インド
- 韓国
- シンガポール
- マレーシア
- その他アジア太平洋地域
- アジア太平洋の市場:国別
- ラテンアメリカ・中東・アフリカ
- ラテンアメリカ・中東・アフリカの市場:国別
- ブラジル
- アルゼンチン
- アラブ首長国連邦
- サウジアラビア
- 南アフリカ
- ナイジェリア
- その他ラテンアメリカ・中東・アフリカ地域
- ラテンアメリカ・中東・アフリカの市場:国別
第9章 企業プロファイル
- Activision Blizzard, Inc(Microsoft Corporation)
- Electronic Arts, Inc
- Konami Holdings Corporation
- Nintendo Co, Ltd.(Nintendo)
- NACON(BIGBEN group)
- Dovetail Games(Focus Entertainment)
- Take-Two Interactive Software, Inc
- Milestone Sr.L.(Plaion)
- Netmarble Corp
- Square Enix Holdings Co, Ltd.(Square Enix)
第10章 市場の成功必須条件
LIST OF TABLES
- TABLE 1 Global Virtual Sports Market, 2019 - 2022, USD Million
- TABLE 2 Global Virtual Sports Market, 2023 - 2030, USD Million
- TABLE 3 Global Virtual Sports Market by Game, 2019 - 2022, USD Million
- TABLE 4 Global Virtual Sports Market by Game, 2023 - 2030, USD Million
- TABLE 5 Global Football Market by Region, 2019 - 2022, USD Million
- TABLE 6 Global Football Market by Region, 2023 - 2030, USD Million
- TABLE 7 Global Racing Market by Region, 2019 - 2022, USD Million
- TABLE 8 Global Racing Market by Region, 2023 - 2030, USD Million
- TABLE 9 Global Golf Market by Region, 2019 - 2022, USD Million
- TABLE 10 Global Golf Market by Region, 2023 - 2030, USD Million
- TABLE 11 Global Basketball Market by Region, 2019 - 2022, USD Million
- TABLE 12 Global Basketball Market by Region, 2023 - 2030, USD Million
- TABLE 13 Global Cricket Market by Region, 2019 - 2022, USD Million
- TABLE 14 Global Cricket Market by Region, 2023 - 2030, USD Million
- TABLE 15 Global Skiing Market by Region, 2019 - 2022, USD Million
- TABLE 16 Global Skiing Market by Region, 2023 - 2030, USD Million
- TABLE 17 Global Tennis Market by Region, 2019 - 2022, USD Million
- TABLE 18 Global Tennis Market by Region, 2023 - 2030, USD Million
- TABLE 19 Global MMA Market by Region, 2019 - 2022, USD Million
- TABLE 20 Global MMA Market by Region, 2023 - 2030, USD Million
- TABLE 21 Global Others Market by Region, 2019 - 2022, USD Million
- TABLE 22 Global Others Market by Region, 2023 - 2030, USD Million
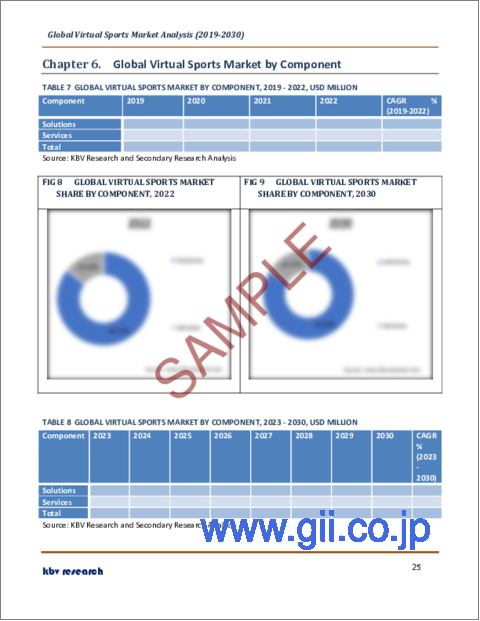
- TABLE 23 Global Virtual Sports Market by Component, 2019 - 2022, USD Million
- TABLE 24 Global Virtual Sports Market by Component, 2023 - 2030, USD Million
- TABLE 25 Global Solutions Market by Region, 2019 - 2022, USD Million
- TABLE 26 Global Solutions Market by Region, 2023 - 2030, USD Million
- TABLE 27 Global Services Market by Region, 2019 - 2022, USD Million
- TABLE 28 Global Services Market by Region, 2023 - 2030, USD Million
- TABLE 29 Global Virtual Sports Market by Demographic, 2019 - 2022, USD Million
- TABLE 30 Global Virtual Sports Market by Demographic, 2023 - 2030, USD Million
- TABLE 31 Global 21 to 35 Years Market by Region, 2019 - 2022, USD Million
- TABLE 32 Global 21 to 35 Years Market by Region, 2023 - 2030, USD Million
- TABLE 33 Global Below 21 Years Market by Region, 2019 - 2022, USD Million
- TABLE 34 Global Below 21 Years Market by Region, 2023 - 2030, USD Million
- TABLE 35 Global 35 to 54 Years Market by Region, 2019 - 2022, USD Million
- TABLE 36 Global 35 to 54 Years Market by Region, 2023 - 2030, USD Million
- TABLE 37 Global 54 Years and Above Market by Region, 2019 - 2022, USD Million
- TABLE 38 Global 54 Years and Above Market by Region, 2023 - 2030, USD Million
- TABLE 39 Global Virtual Sports Market by Region, 2019 - 2022, USD Million
- TABLE 40 Global Virtual Sports Market by Region, 2023 - 2030, USD Million
- TABLE 41 North America Virtual Sports Market, 2019 - 2022, USD Million
- TABLE 42 North America Virtual Sports Market, 2023 - 2030, USD Million
- TABLE 43 North America Virtual Sports Market by Game, 2019 - 2022, USD Million
- TABLE 44 North America Virtual Sports Market by Game, 2023 - 2030, USD Million
- TABLE 45 North America Football Market by Country, 2019 - 2022, USD Million
- TABLE 46 North America Football Market by Country, 2023 - 2030, USD Million
- TABLE 47 North America Racing Market by Country, 2019 - 2022, USD Million
- TABLE 48 North America Racing Market by Country, 2023 - 2030, USD Million
- TABLE 49 North America Golf Market by Country, 2019 - 2022, USD Million
- TABLE 50 North America Golf Market by Country, 2023 - 2030, USD Million
- TABLE 51 North America Basketball Market by Country, 2019 - 2022, USD Million
- TABLE 52 North America Basketball Market by Country, 2023 - 2030, USD Million
- TABLE 53 North America Cricket Market by Country, 2019 - 2022, USD Million
- TABLE 54 North America Cricket Market by Country, 2023 - 2030, USD Million
- TABLE 55 North America Skiing Market by Country, 2019 - 2022, USD Million
- TABLE 56 North America Skiing Market by Country, 2023 - 2030, USD Million
- TABLE 57 North America Tennis Market by Country, 2019 - 2022, USD Million
- TABLE 58 North America Tennis Market by Country, 2023 - 2030, USD Million
- TABLE 59 North America MMA Market by Country, 2019 - 2022, USD Million
- TABLE 60 North America MMA Market by Country, 2023 - 2030, USD Million
- TABLE 61 North America Others Market by Country, 2019 - 2022, USD Million
- TABLE 62 North America Others Market by Country, 2023 - 2030, USD Million
- TABLE 63 North America Virtual Sports Market by Component, 2019 - 2022, USD Million
- TABLE 64 North America Virtual Sports Market by Component, 2023 - 2030, USD Million
- TABLE 65 North America Solutions Market by Country, 2019 - 2022, USD Million
- TABLE 66 North America Solutions Market by Country, 2023 - 2030, USD Million
- TABLE 67 North America Services Market by Country, 2019 - 2022, USD Million
- TABLE 68 North America Services Market by Country, 2023 - 2030, USD Million
- TABLE 69 North America Virtual Sports Market by Demographic, 2019 - 2022, USD Million
- TABLE 70 North America Virtual Sports Market by Demographic, 2023 - 2030, USD Million
- TABLE 71 North America 21 to 35 Years Market by Country, 2019 - 2022, USD Million
- TABLE 72 North America 21 to 35 Years Market by Country, 2023 - 2030, USD Million
- TABLE 73 North America Below 21 Years Market by Country, 2019 - 2022, USD Million
- TABLE 74 North America Below 21 Years Market by Country, 2023 - 2030, USD Million
- TABLE 75 North America 35 to 54 Years Market by Country, 2019 - 2022, USD Million
- TABLE 76 North America 35 to 54 Years Market by Country, 2023 - 2030, USD Million
- TABLE 77 North America 54 Years and Above Market by Country, 2019 - 2022, USD Million
- TABLE 78 North America 54 Years and Above Market by Country, 2023 - 2030, USD Million
- TABLE 79 North America Virtual Sports Market by Country, 2019 - 2022, USD Million
- TABLE 80 North America Virtual Sports Market by Country, 2023 - 2030, USD Million
- TABLE 81 US Virtual Sports Market, 2019 - 2022, USD Million
- TABLE 82 US Virtual Sports Market, 2023 - 2030, USD Million
- TABLE 83 US Virtual Sports Market by Game, 2019 - 2022, USD Million
- TABLE 84 US Virtual Sports Market by Game, 2023 - 2030, USD Million
- TABLE 85 US Virtual Sports Market by Component, 2019 - 2022, USD Million
- TABLE 86 US Virtual Sports Market by Component, 2023 - 2030, USD Million
- TABLE 87 US Virtual Sports Market by Demographic, 2019 - 2022, USD Million
- TABLE 88 US Virtual Sports Market by Demographic, 2023 - 2030, USD Million
- TABLE 89 Canada Virtual Sports Market, 2019 - 2022, USD Million
- TABLE 90 Canada Virtual Sports Market, 2023 - 2030, USD Million
- TABLE 91 Canada Virtual Sports Market by Game, 2019 - 2022, USD Million
- TABLE 92 Canada Virtual Sports Market by Game, 2023 - 2030, USD Million
- TABLE 93 Canada Virtual Sports Market by Component, 2019 - 2022, USD Million
- TABLE 94 Canada Virtual Sports Market by Component, 2023 - 2030, USD Million
- TABLE 95 Canada Virtual Sports Market by Demographic, 2019 - 2022, USD Million
- TABLE 96 Canada Virtual Sports Market by Demographic, 2023 - 2030, USD Million
- TABLE 97 Mexico Virtual Sports Market, 2019 - 2022, USD Million
- TABLE 98 Mexico Virtual Sports Market, 2023 - 2030, USD Million
- TABLE 99 Mexico Virtual Sports Market by Game, 2019 - 2022, USD Million
- TABLE 100 Mexico Virtual Sports Market by Game, 2023 - 2030, USD Million
- TABLE 101 Mexico Virtual Sports Market by Component, 2019 - 2022, USD Million
- TABLE 102 Mexico Virtual Sports Market by Component, 2023 - 2030, USD Million
- TABLE 103 Mexico Virtual Sports Market by Demographic, 2019 - 2022, USD Million
- TABLE 104 Mexico Virtual Sports Market by Demographic, 2023 - 2030, USD Million
- TABLE 105 Rest of North America Virtual Sports Market, 2019 - 2022, USD Million
- TABLE 106 Rest of North America Virtual Sports Market, 2023 - 2030, USD Million
- TABLE 107 Rest of North America Virtual Sports Market by Game, 2019 - 2022, USD Million
- TABLE 108 Rest of North America Virtual Sports Market by Game, 2023 - 2030, USD Million
- TABLE 109 Rest of North America Virtual Sports Market by Component, 2019 - 2022, USD Million
- TABLE 110 Rest of North America Virtual Sports Market by Component, 2023 - 2030, USD Million
- TABLE 111 Rest of North America Virtual Sports Market by Demographic, 2019 - 2022, USD Million
- TABLE 112 Rest of North America Virtual Sports Market by Demographic, 2023 - 2030, USD Million
- TABLE 113 Europe Virtual Sports Market, 2019 - 2022, USD Million
- TABLE 114 Europe Virtual Sports Market, 2023 - 2030, USD Million
- TABLE 115 Europe Virtual Sports Market by Game, 2019 - 2022, USD Million
- TABLE 116 Europe Virtual Sports Market by Game, 2023 - 2030, USD Million
- TABLE 117 Europe Football Market by Country, 2019 - 2022, USD Million
- TABLE 118 Europe Football Market by Country, 2023 - 2030, USD Million
- TABLE 119 Europe Racing Market by Country, 2019 - 2022, USD Million
- TABLE 120 Europe Racing Market by Country, 2023 - 2030, USD Million
- TABLE 121 Europe Golf Market by Country, 2019 - 2022, USD Million
- TABLE 122 Europe Golf Market by Country, 2023 - 2030, USD Million
- TABLE 123 Europe Basketball Market by Country, 2019 - 2022, USD Million
- TABLE 124 Europe Basketball Market by Country, 2023 - 2030, USD Million
- TABLE 125 Europe Cricket Market by Country, 2019 - 2022, USD Million
- TABLE 126 Europe Cricket Market by Country, 2023 - 2030, USD Million
- TABLE 127 Europe Skiing Market by Country, 2019 - 2022, USD Million
- TABLE 128 Europe Skiing Market by Country, 2023 - 2030, USD Million
- TABLE 129 Europe Tennis Market by Country, 2019 - 2022, USD Million
- TABLE 130 Europe Tennis Market by Country, 2023 - 2030, USD Million
- TABLE 131 Europe MMA Market by Country, 2019 - 2022, USD Million
- TABLE 132 Europe MMA Market by Country, 2023 - 2030, USD Million
- TABLE 133 Europe Others Market by Country, 2019 - 2022, USD Million
- TABLE 134 Europe Others Market by Country, 2023 - 2030, USD Million
- TABLE 135 Europe Virtual Sports Market by Component, 2019 - 2022, USD Million
- TABLE 136 Europe Virtual Sports Market by Component, 2023 - 2030, USD Million
- TABLE 137 Europe Solutions Market by Country, 2019 - 2022, USD Million
- TABLE 138 Europe Solutions Market by Country, 2023 - 2030, USD Million
- TABLE 139 Europe Services Market by Country, 2019 - 2022, USD Million
- TABLE 140 Europe Services Market by Country, 2023 - 2030, USD Million
- TABLE 141 Europe Virtual Sports Market by Demographic, 2019 - 2022, USD Million
- TABLE 142 Europe Virtual Sports Market by Demographic, 2023 - 2030, USD Million
- TABLE 143 Europe 21 to 35 Years Market by Country, 2019 - 2022, USD Million
- TABLE 144 Europe 21 to 35 Years Market by Country, 2023 - 2030, USD Million
- TABLE 145 Europe Below 21 Years Market by Country, 2019 - 2022, USD Million
- TABLE 146 Europe Below 21 Years Market by Country, 2023 - 2030, USD Million
- TABLE 147 Europe 35 to 54 Years Market by Country, 2019 - 2022, USD Million
- TABLE 148 Europe 35 to 54 Years Market by Country, 2023 - 2030, USD Million
- TABLE 149 Europe 54 Years and Above Market by Country, 2019 - 2022, USD Million
- TABLE 150 Europe 54 Years and Above Market by Country, 2023 - 2030, USD Million
- TABLE 151 Europe Virtual Sports Market by Country, 2019 - 2022, USD Million
- TABLE 152 Europe Virtual Sports Market by Country, 2023 - 2030, USD Million
- TABLE 153 Germany Virtual Sports Market, 2019 - 2022, USD Million
- TABLE 154 Germany Virtual Sports Market, 2023 - 2030, USD Million
- TABLE 155 Germany Virtual Sports Market by Game, 2019 - 2022, USD Million
- TABLE 156 Germany Virtual Sports Market by Game, 2023 - 2030, USD Million
- TABLE 157 Germany Virtual Sports Market by Component, 2019 - 2022, USD Million
- TABLE 158 Germany Virtual Sports Market by Component, 2023 - 2030, USD Million
- TABLE 159 Germany Virtual Sports Market by Demographic, 2019 - 2022, USD Million
- TABLE 160 Germany Virtual Sports Market by Demographic, 2023 - 2030, USD Million
- TABLE 161 UK Virtual Sports Market, 2019 - 2022, USD Million
- TABLE 162 UK Virtual Sports Market, 2023 - 2030, USD Million
- TABLE 163 UK Virtual Sports Market by Game, 2019 - 2022, USD Million
- TABLE 164 UK Virtual Sports Market by Game, 2023 - 2030, USD Million
- TABLE 165 UK Virtual Sports Market by Component, 2019 - 2022, USD Million
- TABLE 166 UK Virtual Sports Market by Component, 2023 - 2030, USD Million
- TABLE 167 UK Virtual Sports Market by Demographic, 2019 - 2022, USD Million
- TABLE 168 UK Virtual Sports Market by Demographic, 2023 - 2030, USD Million
- TABLE 169 France Virtual Sports Market, 2019 - 2022, USD Million
- TABLE 170 France Virtual Sports Market, 2023 - 2030, USD Million
- TABLE 171 France Virtual Sports Market by Game, 2019 - 2022, USD Million
- TABLE 172 France Virtual Sports Market by Game, 2023 - 2030, USD Million
- TABLE 173 France Virtual Sports Market by Component, 2019 - 2022, USD Million
- TABLE 174 France Virtual Sports Market by Component, 2023 - 2030, USD Million
- TABLE 175 France Virtual Sports Market by Demographic, 2019 - 2022, USD Million
- TABLE 176 France Virtual Sports Market by Demographic, 2023 - 2030, USD Million
- TABLE 177 Russia Virtual Sports Market, 2019 - 2022, USD Million
- TABLE 178 Russia Virtual Sports Market, 2023 - 2030, USD Million
- TABLE 179 Russia Virtual Sports Market by Game, 2019 - 2022, USD Million
- TABLE 180 Russia Virtual Sports Market by Game, 2023 - 2030, USD Million
- TABLE 181 Russia Virtual Sports Market by Component, 2019 - 2022, USD Million
- TABLE 182 Russia Virtual Sports Market by Component, 2023 - 2030, USD Million
- TABLE 183 Russia Virtual Sports Market by Demographic, 2019 - 2022, USD Million
- TABLE 184 Russia Virtual Sports Market by Demographic, 2023 - 2030, USD Million
- TABLE 185 Spain Virtual Sports Market, 2019 - 2022, USD Million
- TABLE 186 Spain Virtual Sports Market, 2023 - 2030, USD Million
- TABLE 187 Spain Virtual Sports Market by Game, 2019 - 2022, USD Million
- TABLE 188 Spain Virtual Sports Market by Game, 2023 - 2030, USD Million
- TABLE 189 Spain Virtual Sports Market by Component, 2019 - 2022, USD Million
- TABLE 190 Spain Virtual Sports Market by Component, 2023 - 2030, USD Million
- TABLE 191 Spain Virtual Sports Market by Demographic, 2019 - 2022, USD Million
- TABLE 192 Spain Virtual Sports Market by Demographic, 2023 - 2030, USD Million
- TABLE 193 Italy Virtual Sports Market, 2019 - 2022, USD Million
- TABLE 194 Italy Virtual Sports Market, 2023 - 2030, USD Million
- TABLE 195 Italy Virtual Sports Market by Game, 2019 - 2022, USD Million
- TABLE 196 Italy Virtual Sports Market by Game, 2023 - 2030, USD Million
- TABLE 197 Italy Virtual Sports Market by Component, 2019 - 2022, USD Million
- TABLE 198 Italy Virtual Sports Market by Component, 2023 - 2030, USD Million
- TABLE 199 Italy Virtual Sports Market by Demographic, 2019 - 2022, USD Million
- TABLE 200 Italy Virtual Sports Market by Demographic, 2023 - 2030, USD Million
- TABLE 201 Rest of Europe Virtual Sports Market, 2019 - 2022, USD Million
- TABLE 202 Rest of Europe Virtual Sports Market, 2023 - 2030, USD Million
- TABLE 203 Rest of Europe Virtual Sports Market by Game, 2019 - 2022, USD Million
- TABLE 204 Rest of Europe Virtual Sports Market by Game, 2023 - 2030, USD Million
- TABLE 205 Rest of Europe Virtual Sports Market by Component, 2019 - 2022, USD Million
- TABLE 206 Rest of Europe Virtual Sports Market by Component, 2023 - 2030, USD Million
- TABLE 207 Rest of Europe Virtual Sports Market by Demographic, 2019 - 2022, USD Million
- TABLE 208 Rest of Europe Virtual Sports Market by Demographic, 2023 - 2030, USD Million
- TABLE 209 Asia Pacific Virtual Sports Market, 2019 - 2022, USD Million
- TABLE 210 Asia Pacific Virtual Sports Market, 2023 - 2030, USD Million
- TABLE 211 Asia Pacific Virtual Sports Market by Game, 2019 - 2022, USD Million
- TABLE 212 Asia Pacific Virtual Sports Market by Game, 2023 - 2030, USD Million
- TABLE 213 Asia Pacific Football Market by Country, 2019 - 2022, USD Million
- TABLE 214 Asia Pacific Football Market by Country, 2023 - 2030, USD Million
- TABLE 215 Asia Pacific Racing Market by Country, 2019 - 2022, USD Million
- TABLE 216 Asia Pacific Racing Market by Country, 2023 - 2030, USD Million
- TABLE 217 Asia Pacific Golf Market by Country, 2019 - 2022, USD Million
- TABLE 218 Asia Pacific Golf Market by Country, 2023 - 2030, USD Million
- TABLE 219 Asia Pacific Basketball Market by Country, 2019 - 2022, USD Million
- TABLE 220 Asia Pacific Basketball Market by Country, 2023 - 2030, USD Million
- TABLE 221 Asia Pacific Cricket Market by Country, 2019 - 2022, USD Million
- TABLE 222 Asia Pacific Cricket Market by Country, 2023 - 2030, USD Million
- TABLE 223 Asia Pacific Skiing Market by Country, 2019 - 2022, USD Million
- TABLE 224 Asia Pacific Skiing Market by Country, 2023 - 2030, USD Million
- TABLE 225 Asia Pacific Tennis Market by Country, 2019 - 2022, USD Million
- TABLE 226 Asia Pacific Tennis Market by Country, 2023 - 2030, USD Million
- TABLE 227 Asia Pacific MMA Market by Country, 2019 - 2022, USD Million
- TABLE 228 Asia Pacific MMA Market by Country, 2023 - 2030, USD Million
- TABLE 229 Asia Pacific Others Market by Country, 2019 - 2022, USD Million
- TABLE 230 Asia Pacific Others Market by Country, 2023 - 2030, USD Million
- TABLE 231 Asia Pacific Virtual Sports Market by Component, 2019 - 2022, USD Million
- TABLE 232 Asia Pacific Virtual Sports Market by Component, 2023 - 2030, USD Million
- TABLE 233 Asia Pacific Solutions Market by Country, 2019 - 2022, USD Million
- TABLE 234 Asia Pacific Solutions Market by Country, 2023 - 2030, USD Million
- TABLE 235 Asia Pacific Services Market by Country, 2019 - 2022, USD Million
- TABLE 236 Asia Pacific Services Market by Country, 2023 - 2030, USD Million
- TABLE 237 Asia Pacific Virtual Sports Market by Demographic, 2019 - 2022, USD Million
- TABLE 238 Asia Pacific Virtual Sports Market by Demographic, 2023 - 2030, USD Million
- TABLE 239 Asia Pacific 21 to 35 Years Market by Country, 2019 - 2022, USD Million
- TABLE 240 Asia Pacific 21 to 35 Years Market by Country, 2023 - 2030, USD Million
- TABLE 241 Asia Pacific Below 21 Years Market by Country, 2019 - 2022, USD Million
- TABLE 242 Asia Pacific Below 21 Years Market by Country, 2023 - 2030, USD Million
- TABLE 243 Asia Pacific 35 to 54 Years Market by Country, 2019 - 2022, USD Million
- TABLE 244 Asia Pacific 35 to 54 Years Market by Country, 2023 - 2030, USD Million
- TABLE 245 Asia Pacific 54 Years and Above Market by Country, 2019 - 2022, USD Million
- TABLE 246 Asia Pacific 54 Years and Above Market by Country, 2023 - 2030, USD Million
- TABLE 247 Asia Pacific Virtual Sports Market by Country, 2019 - 2022, USD Million
- TABLE 248 Asia Pacific Virtual Sports Market by Country, 2023 - 2030, USD Million
- TABLE 249 China Virtual Sports Market, 2019 - 2022, USD Million
- TABLE 250 China Virtual Sports Market, 2023 - 2030, USD Million
- TABLE 251 China Virtual Sports Market by Game, 2019 - 2022, USD Million
- TABLE 252 China Virtual Sports Market by Game, 2023 - 2030, USD Million
- TABLE 253 China Virtual Sports Market by Component, 2019 - 2022, USD Million
- TABLE 254 China Virtual Sports Market by Component, 2023 - 2030, USD Million
- TABLE 255 China Virtual Sports Market by Demographic, 2019 - 2022, USD Million
- TABLE 256 China Virtual Sports Market by Demographic, 2023 - 2030, USD Million
- TABLE 257 Japan Virtual Sports Market, 2019 - 2022, USD Million
- TABLE 258 Japan Virtual Sports Market, 2023 - 2030, USD Million
- TABLE 259 Japan Virtual Sports Market by Game, 2019 - 2022, USD Million
- TABLE 260 Japan Virtual Sports Market by Game, 2023 - 2030, USD Million
- TABLE 261 Japan Virtual Sports Market by Component, 2019 - 2022, USD Million
- TABLE 262 Japan Virtual Sports Market by Component, 2023 - 2030, USD Million
- TABLE 263 Japan Virtual Sports Market by Demographic, 2019 - 2022, USD Million
- TABLE 264 Japan Virtual Sports Market by Demographic, 2023 - 2030, USD Million
- TABLE 265 India Virtual Sports Market, 2019 - 2022, USD Million
- TABLE 266 India Virtual Sports Market, 2023 - 2030, USD Million
- TABLE 267 India Virtual Sports Market by Game, 2019 - 2022, USD Million
- TABLE 268 India Virtual Sports Market by Game, 2023 - 2030, USD Million
- TABLE 269 India Virtual Sports Market by Component, 2019 - 2022, USD Million
- TABLE 270 India Virtual Sports Market by Component, 2023 - 2030, USD Million
- TABLE 271 India Virtual Sports Market by Demographic, 2019 - 2022, USD Million
- TABLE 272 India Virtual Sports Market by Demographic, 2023 - 2030, USD Million
- TABLE 273 South Korea Virtual Sports Market, 2019 - 2022, USD Million
- TABLE 274 South Korea Virtual Sports Market, 2023 - 2030, USD Million
- TABLE 275 South Korea Virtual Sports Market by Game, 2019 - 2022, USD Million
- TABLE 276 South Korea Virtual Sports Market by Game, 2023 - 2030, USD Million
- TABLE 277 South Korea Virtual Sports Market by Component, 2019 - 2022, USD Million
- TABLE 278 South Korea Virtual Sports Market by Component, 2023 - 2030, USD Million
- TABLE 279 South Korea Virtual Sports Market by Demographic, 2019 - 2022, USD Million
- TABLE 280 South Korea Virtual Sports Market by Demographic, 2023 - 2030, USD Million
- TABLE 281 Singapore Virtual Sports Market, 2019 - 2022, USD Million
- TABLE 282 Singapore Virtual Sports Market, 2023 - 2030, USD Million
- TABLE 283 Singapore Virtual Sports Market by Game, 2019 - 2022, USD Million
- TABLE 284 Singapore Virtual Sports Market by Game, 2023 - 2030, USD Million
- TABLE 285 Singapore Virtual Sports Market by Component, 2019 - 2022, USD Million
- TABLE 286 Singapore Virtual Sports Market by Component, 2023 - 2030, USD Million
- TABLE 287 Singapore Virtual Sports Market by Demographic, 2019 - 2022, USD Million
- TABLE 288 Singapore Virtual Sports Market by Demographic, 2023 - 2030, USD Million
- TABLE 289 Malaysia Virtual Sports Market, 2019 - 2022, USD Million
- TABLE 290 Malaysia Virtual Sports Market, 2023 - 2030, USD Million
- TABLE 291 Malaysia Virtual Sports Market by Game, 2019 - 2022, USD Million
- TABLE 292 Malaysia Virtual Sports Market by Game, 2023 - 2030, USD Million
- TABLE 293 Malaysia Virtual Sports Market by Component, 2019 - 2022, USD Million
- TABLE 294 Malaysia Virtual Sports Market by Component, 2023 - 2030, USD Million
- TABLE 295 Malaysia Virtual Sports Market by Demographic, 2019 - 2022, USD Million
- TABLE 296 Malaysia Virtual Sports Market by Demographic, 2023 - 2030, USD Million
- TABLE 297 Rest of Asia Pacific Virtual Sports Market, 2019 - 2022, USD Million
- TABLE 298 Rest of Asia Pacific Virtual Sports Market, 2023 - 2030, USD Million
- TABLE 299 Rest of Asia Pacific Virtual Sports Market by Game, 2019 - 2022, USD Million
- TABLE 300 Rest of Asia Pacific Virtual Sports Market by Game, 2023 - 2030, USD Million
- TABLE 301 Rest of Asia Pacific Virtual Sports Market by Component, 2019 - 2022, USD Million
- TABLE 302 Rest of Asia Pacific Virtual Sports Market by Component, 2023 - 2030, USD Million
- TABLE 303 Rest of Asia Pacific Virtual Sports Market by Demographic, 2019 - 2022, USD Million
- TABLE 304 Rest of Asia Pacific Virtual Sports Market by Demographic, 2023 - 2030, USD Million
The Global Virtual Sports Market size is expected to reach $40.2 billion by 2030, rising at a market growth of 15.3% CAGR during the forecast period.
The gaming sector is experiencing substantial expansion in emerging markets, particularly in Africa, Latin America, and the Middle East. Therefore, LAMEA segment generated $969.7 million revenue in the market in 2022. These regions, distinguished by a youthful populace and a swiftly expanding integration of mobile technology, present game developers with novel and stimulating prospects. According to the GSMA Mobile Economy 2023 report, the quantity of distinct mobile subscribers was anticipated to exceed 5 billion by 2025, with these regions contributing significantly to that expansion. Some of the factors impacting the market are technological improvements in virtual sports, growing preference for online gaming and increasing usage of social media and regulatory and legal restrictions.
Technological advances are a significant factor propelling the market, as they facilitate the development of more immersive and captivating client experiences. Virtual reality technology promotes the development of immersive and authentic virtual sports experiences. Virtual reality enables users to virtually experience sporting events as in an actual arena or stadium. The importance of superior-quality 3D graphics is growing in the marketplace. By allowing the creation of more realistic characters and environments, 3D graphics can increase user engagement and contentment. Additionally, the convergence of online gaming platforms, social media usage, and the interactive nature of virtual sports has created an ecosystem that fosters engagement, exposure, and interest in simulated sports events. As online gaming and social media continue to evolve, their impact on the demand for virtual sports is likely to persist and grow. Therefore, rising technological improvements in virtual sports development are significantly aiding in the expansion of the market and the increasing preference for online gaming and social media is supporting the growth of the market.
However, Possible prerequisites consist of licensing, safeguarding of data, and implementation of consumer protection protocols. Virtual sports operators may find it time-consuming and costly to comply with these regulations, restricting the number of operators that can enter the market. Additionally, this may limit the range of offerings and solutions accessible to consumers, potentially impeding the market's expansion. Moreover, the ever-changing regulatory environment governing virtual sports can generate uncertainty and restrict market investment. Therefore, regulatory or legal framework modifications may affect the expansion and progress of the market.
Game Outlook
On the basis of the game, the market is categorized into football, cricket, racing, golf, basketball, skiing, tennis, MMA, and others. The football segment recorded the largest revenue share in the market in 2022. As esports gain prominence, increasing numbers of individuals opt for virtual sports as an innovative and thrilling method to participate in their preferred sports. Football games are at the vanguard of this phenomenon, allowing players to engage in virtual competitions against renowned football leagues and teams. It is anticipated that this expansion will persist in the years to come as an increasing number of individuals become aware of the thrill and ease connected to virtual sports.
Component Outlook
Based on component, the market is bifurcated into solutions and services. In 2022, the services segment garnered a significant revenue share in the market. Virtual sports software manufacturers provide white-label and specialized services to create virtual sports betting applications. Services may be utilized to assist in the creation of a visually spectacular and interactive virtual sports application that commands the user's interest. Numerous service providers additionally provide cost-effective services, entirely customized virtual sports development services, round-the-clock customer support, integration of cutting-edge technologies, punctual delivery, and customized solutions.
Demographic Outlook
Based on demographic, the market is categorized into below 21 years, 21 to 35 years, 35 to 54 years, and 54 years to above. The 21 to 35 years segment garnered the largest revenue share in the market in 2022. This age group comprises digital natives who are highly familiar with technology and online entertainment. They are more inclined to explore and engage with virtual sports, easily accessible through online platforms, mobile devices, and gaming consoles. Virtual sports offer convenience by being available on-demand and accessible via various digital platforms. The flexibility to engage in simulated sports events at any time aligns with the lifestyle of this age group, which values convenience and flexibility.
Regional Outlook
Region-wise, the market is analyzed across North America, Europe, Asia Pacific, and LAMEA. In 2022, the Asia Pacific region generated the maximum revenue share in the market. Rapid expansion is aided by the region's widespread adoption of cutting-edge technologies. Prominent nations such as South Korea, Japan, and China have spearheaded this technological revolution due to their formidable infrastructures, facilitating the market's expansion. The emergence of robust gaming consoles, high-performance personal computers, and the pervasive integration of virtual reality (VR) and augmented reality (AR) devices have established a strong groundwork for the advancement and extensive acceptance of virtual sports.
The market research report covers the analysis of key stake holders of the market. Key companies profiled in the report include Activision Blizzard, Inc. (Microsoft Corporation), Electronic Arts, Inc., Konami Holdings Corporation, Nintendo Co., Ltd. (Nintendo), NACON (BIGBEN group), Dovetail Games (Focus Entertainment), Take-Two Interactive Software, Inc., Milestone S.r.L. (Plaion), Netmarble Corp, and Square Enix Holdings Co., Ltd.
Strategies Deployed in Virtual Sports Market
Oct-2023: Activision Blizzard, Inc. launched Warcraft Rumble, the new mobile action strategy game. The launched product would enable players to build and command miniature armies composed of famous heroes, villains, and creatures from the Warcraft universe.
Jun-2023: Electronic Arts, Inc. came into partnership with Nike Virtual Studios, the digital-focused arm of the sportswear giant. This partnership aimed to select virtual creations created by members of the.Swoosh community would be made available in future EA Sports titles for fans to purchase and use in-game.
Apr-2023: Netmarble launched Meta World: My City, a new metaverse board game featuring virtual real estate and building collections. The launched product would feature board game mechanics and the chance to have virtual land and buildings in the metaverse.
Apr-2023: Netmarble partnered with Sandbox, an online gaming platform that offers a unique and immersive gaming experience. This partnership aimed to improve gaming content and offer various experiences to players.
Apr-2023: Square Enix partnered with Elixir Games, the leading web3 gaming distribution platform. This partnership aimed to enable millions of gamers to explore quality web3 games through a platform that hides web3 technology under the hood and provides a simple seamless experience to the traditional gamer.
Feb-2023: Nintendo Co., Ltd. signed an agreement with Microsoft Corp., an American multinational technology corporation. This agreement aimed to bring Call of Duty to Nintendo platforms for a decade, a move created to allay fears about the blockbuster game becoming an Xbox exclusive.
Jun-2022: Milestone S.r.L. took over Victoria Distillers Inc., one of the oldest artisan distilleries in Canada. This acquisition aimed to empower Milestone's strategic Position.
May-2022: Take Two Interactive, Inc. acquired Zynga, the mobile games giant. This acquisition aimed to bring Zynga's popular games including Farmville and Words With Friends under Take-Two ownership.
Feb-2022: Nintendo Co., Ltd. unveiled Nintendo Switch Sports, a game mirroring the activities. The launched product would be a sports simulation video game.
Jun-2021: Take-Two Interactive Software, Inc. took over Nordeus, a Serbian mobile game developer. This acquisition aimed to empower further Take-Two's mobile game business, which would be highly complementary to Social Point and Playdots and widen our sports portfolio with first-ever soccer offerings.
Nov-2020: Take-Two Interactive Software, Inc. signed an agreement with the Board of Codemasters, the UK-based game publisher and developer. Through this agreement, Codemaster's portfolio would be highly complementary to Take-Two Interactive Software, Inc.'s sports portfolio and improve further their organization's long-term growth.
Scope of the Study
Market Segments covered in the Report:
By Game
- Football
- Racing
- Golf
- Basketball
- Cricket
- Skiing
- Tennis
- MMA
- Others
By Component
- Solutions
- Services
By Demographic
- 21 to 35 Years
- Below 21 Years
- 35 to 54 Years
- 54 Years and Above
By Geography
- North America
- US
- Canada
- Mexico
- Rest of North America
- Europe
- Germany
- UK
- France
- Russia
- Spain
- Italy
- Rest of Europe
- Asia Pacific
- China
- Japan
- India
- South Korea
- Singapore
- Malaysia
- Rest of Asia Pacific
- LAMEA
- Brazil
- Argentina
- UAE
- Saudi Arabia
- South Africa
- Nigeria
- Rest of LAMEA
Companies Profiled
- Activision Blizzard, Inc. (Microsoft Corporation)
- Electronic Arts, Inc.
- Konami Holdings Corporation
- Nintendo Co., Ltd. (Nintendo)
- NACON (BIGBEN group)
- Dovetail Games (Focus Entertainment)
- Take-Two Interactive Software, Inc.
- Milestone S.r.L. (Plaion)
- Netmarble Corp
- Square Enix Holdings Co., Ltd.
Unique Offerings from KBV Research
- Exhaustive coverage
- Highest number of market tables and figures
- Subscription based model available
- Guaranteed best price
- Assured post sales research support with 10% customization free
Table of Contents
Chapter 1. Market Scope & Methodology
- 1.1 Market Definition
- 1.2 Objectives
- 1.3 Market Scope
- 1.4 Segmentation
- 1.4.1 Global Virtual Sports Market, by Game
- 1.4.2 Global Virtual Sports Market, by Component
- 1.4.3 Global Virtual Sports Market, by Demographic
- 1.4.4 Global Virtual Sports Market, by Geography
- 1.5 Methodology for the research
Chapter 2. Market at a Glance
- 2.1 Key Highlights
Chapter 3. Market Overview
- 3.1 Introduction
- 3.1.1 Overview
- 3.1.1.1 Market Composition and Scenario
- 3.1.1 Overview
- 3.2 Key Factors Impacting the Market
- 3.2.1 Market Drivers
- 3.2.2 Market Restraints
- 3.3 Porter's Five Force Analysis
Chapter 4. Strategies Deployed in Virtual Sports Market
Chapter 5. Global Virtual Sports Market by Game
- 5.1 Global Football Market by Region
- 5.2 Global Racing Market by Region
- 5.3 Global Golf Market by Region
- 5.4 Global Basketball Market by Region
- 5.5 Global Cricket Market by Region
- 5.6 Global Skiing Market by Region
- 5.7 Global Tennis Market by Region
- 5.8 Global MMA Market by Region
- 5.9 Global Others Market by Region
Chapter 6. Global Virtual Sports Market by Component
- 6.1 Global Solutions Market by Region
- 6.2 Global Services Market by Region
Chapter 7. Global Virtual Sports Market by Demographic
- 7.1 Global 21 to 35 Years Market by Region
- 7.2 Global Below 21 Years Market by Region
- 7.3 Global 35 to 54 Years Market by Region
- 7.4 Global 54 Years and Above Market by Region
Chapter 8. Global Virtual Sports Market by Region
- 8.1 North America Virtual Sports Market
- 8.1.1 North America Virtual Sports Market by Game
- 8.1.1.1 North America Football Market by Country
- 8.1.1.2 North America Racing Market by Country
- 8.1.1.3 North America Golf Market by Country
- 8.1.1.4 North America Basketball Market by Country
- 8.1.1.5 North America Cricket Market by Country
- 8.1.1.6 North America Skiing Market by Country
- 8.1.1.7 North America Tennis Market by Country
- 8.1.1.8 North America MMA Market by Country
- 8.1.1.9 North America Others Market by Country
- 8.1.2 North America Virtual Sports Market by Component
- 8.1.2.1 North America Solutions Market by Country
- 8.1.2.2 North America Services Market by Country
- 8.1.3 North America Virtual Sports Market by Demographic
- 8.1.3.1 North America 21 to 35 Years Market by Country
- 8.1.3.2 North America Below 21 Years Market by Country
- 8.1.3.3 North America 35 to 54 Years Market by Country
- 8.1.3.4 North America 54 Years and Above Market by Country
- 8.1.4 North America Virtual Sports Market by Country
- 8.1.4.1 US Virtual Sports Market
- 8.1.4.1.1 US Virtual Sports Market by Game
- 8.1.4.1.2 US Virtual Sports Market by Component
- 8.1.4.1.3 US Virtual Sports Market by Demographic
- 8.1.4.2 Canada Virtual Sports Market
- 8.1.4.2.1 Canada Virtual Sports Market by Game
- 8.1.4.2.2 Canada Virtual Sports Market by Component
- 8.1.4.2.3 Canada Virtual Sports Market by Demographic
- 8.1.4.3 Mexico Virtual Sports Market
- 8.1.4.3.1 Mexico Virtual Sports Market by Game
- 8.1.4.3.2 Mexico Virtual Sports Market by Component
- 8.1.4.3.3 Mexico Virtual Sports Market by Demographic
- 8.1.4.4 Rest of North America Virtual Sports Market
- 8.1.4.4.1 Rest of North America Virtual Sports Market by Game
- 8.1.4.4.2 Rest of North America Virtual Sports Market by Component
- 8.1.4.4.3 Rest of North America Virtual Sports Market by Demographic
- 8.1.4.1 US Virtual Sports Market
- 8.1.1 North America Virtual Sports Market by Game
- 8.2 Europe Virtual Sports Market
- 8.2.1 Europe Virtual Sports Market by Game
- 8.2.1.1 Europe Football Market by Country
- 8.2.1.2 Europe Racing Market by Country
- 8.2.1.3 Europe Golf Market by Country
- 8.2.1.4 Europe Basketball Market by Country
- 8.2.1.5 Europe Cricket Market by Country
- 8.2.1.6 Europe Skiing Market by Country
- 8.2.1.7 Europe Tennis Market by Country
- 8.2.1.8 Europe MMA Market by Country
- 8.2.1.9 Europe Others Market by Country
- 8.2.2 Europe Virtual Sports Market by Component
- 8.2.2.1 Europe Solutions Market by Country
- 8.2.2.2 Europe Services Market by Country
- 8.2.3 Europe Virtual Sports Market by Demographic
- 8.2.3.1 Europe 21 to 35 Years Market by Country
- 8.2.3.2 Europe Below 21 Years Market by Country
- 8.2.3.3 Europe 35 to 54 Years Market by Country
- 8.2.3.4 Europe 54 Years and Above Market by Country
- 8.2.4 Europe Virtual Sports Market by Country
- 8.2.4.1 Germany Virtual Sports Market
- 8.2.4.1.1 Germany Virtual Sports Market by Game
- 8.2.4.1.2 Germany Virtual Sports Market by Component
- 8.2.4.1.3 Germany Virtual Sports Market by Demographic
- 8.2.4.2 UK Virtual Sports Market
- 8.2.4.2.1 UK Virtual Sports Market by Game
- 8.2.4.2.2 UK Virtual Sports Market by Component
- 8.2.4.2.3 UK Virtual Sports Market by Demographic
- 8.2.4.3 France Virtual Sports Market
- 8.2.4.3.1 France Virtual Sports Market by Game
- 8.2.4.3.2 France Virtual Sports Market by Component
- 8.2.4.3.3 France Virtual Sports Market by Demographic
- 8.2.4.4 Russia Virtual Sports Market
- 8.2.4.4.1 Russia Virtual Sports Market by Game
- 8.2.4.4.2 Russia Virtual Sports Market by Component
- 8.2.4.4.3 Russia Virtual Sports Market by Demographic
- 8.2.4.5 Spain Virtual Sports Market
- 8.2.4.5.1 Spain Virtual Sports Market by Game
- 8.2.4.5.2 Spain Virtual Sports Market by Component
- 8.2.4.5.3 Spain Virtual Sports Market by Demographic
- 8.2.4.6 Italy Virtual Sports Market
- 8.2.4.6.1 Italy Virtual Sports Market by Game
- 8.2.4.6.2 Italy Virtual Sports Market by Component
- 8.2.4.6.3 Italy Virtual Sports Market by Demographic
- 8.2.4.7 Rest of Europe Virtual Sports Market
- 8.2.4.7.1 Rest of Europe Virtual Sports Market by Game
- 8.2.4.7.2 Rest of Europe Virtual Sports Market by Component
- 8.2.4.7.3 Rest of Europe Virtual Sports Market by Demographic
- 8.2.4.1 Germany Virtual Sports Market
- 8.2.1 Europe Virtual Sports Market by Game
- 8.3 Asia Pacific Virtual Sports Market
- 8.3.1 Asia Pacific Virtual Sports Market by Game
- 8.3.1.1 Asia Pacific Football Market by Country
- 8.3.1.2 Asia Pacific Racing Market by Country
- 8.3.1.3 Asia Pacific Golf Market by Country
- 8.3.1.4 Asia Pacific Basketball Market by Country
- 8.3.1.5 Asia Pacific Cricket Market by Country
- 8.3.1.6 Asia Pacific Skiing Market by Country
- 8.3.1.7 Asia Pacific Tennis Market by Country
- 8.3.1.8 Asia Pacific MMA Market by Country
- 8.3.1.9 Asia Pacific Others Market by Country
- 8.3.2 Asia Pacific Virtual Sports Market by Component
- 8.3.2.1 Asia Pacific Solutions Market by Country
- 8.3.2.2 Asia Pacific Services Market by Country
- 8.3.3 Asia Pacific Virtual Sports Market by Demographic
- 8.3.3.1 Asia Pacific 21 to 35 Years Market by Country
- 8.3.3.2 Asia Pacific Below 21 Years Market by Country
- 8.3.3.3 Asia Pacific 35 to 54 Years Market by Country
- 8.3.3.4 Asia Pacific 54 Years and Above Market by Country
- 8.3.4 Asia Pacific Virtual Sports Market by Country
- 8.3.4.1 China Virtual Sports Market
- 8.3.4.1.1 China Virtual Sports Market by Game
- 8.3.4.1.2 China Virtual Sports Market by Component
- 8.3.4.1.3 China Virtual Sports Market by Demographic
- 8.3.4.2 Japan Virtual Sports Market
- 8.3.4.2.1 Japan Virtual Sports Market by Game
- 8.3.4.2.2 Japan Virtual Sports Market by Component
- 8.3.4.2.3 Japan Virtual Sports Market by Demographic
- 8.3.4.3 India Virtual Sports Market
- 8.3.4.3.1 India Virtual Sports Market by Game
- 8.3.4.3.2 India Virtual Sports Market by Component
- 8.3.4.3.3 India Virtual Sports Market by Demographic
- 8.3.4.4 South Korea Virtual Sports Market
- 8.3.4.4.1 South Korea Virtual Sports Market by Game
- 8.3.4.4.2 South Korea Virtual Sports Market by Component
- 8.3.4.4.3 South Korea Virtual Sports Market by Demographic
- 8.3.4.5 Singapore Virtual Sports Market
- 8.3.4.5.1 Singapore Virtual Sports Market by Game
- 8.3.4.5.2 Singapore Virtual Sports Market by Component
- 8.3.4.5.3 Singapore Virtual Sports Market by Demographic
- 8.3.4.6 Malaysia Virtual Sports Market
- 8.3.4.6.1 Malaysia Virtual Sports Market by Game
- 8.3.4.6.2 Malaysia Virtual Sports Market by Component
- 8.3.4.6.3 Malaysia Virtual Sports Market by Demographic
- 8.3.4.7 Rest of Asia Pacific Virtual Sports Market
- 8.3.4.7.1 Rest of Asia Pacific Virtual Sports Market by Game
- 8.3.4.7.2 Rest of Asia Pacific Virtual Sports Market by Component
- 8.3.4.7.3 Rest of Asia Pacific Virtual Sports Market by Demographic
- 8.3.4.1 China Virtual Sports Market
- 8.3.1 Asia Pacific Virtual Sports Market by Game
- 8.4 LAMEA Virtual Sports Market
- 8.4.1 LAMEA Virtual Sports Market by Game
- 8.4.1.1 LAMEA Football Market by Country
- 8.4.1.2 LAMEA Racing Market by Country
- 8.4.1.3 LAMEA Golf Market by Country
- 8.4.1.4 LAMEA Basketball Market by Country
- 8.4.1.5 LAMEA Cricket Market by Country
- 8.4.1.6 LAMEA Skiing Market by Country
- 8.4.1.7 LAMEA Tennis Market by Country
- 8.4.1.8 LAMEA MMA Market by Country
- 8.4.1.9 LAMEA Others Market by Country
- 8.4.2 LAMEA Virtual Sports Market by Component
- 8.4.2.1 LAMEA Solutions Market by Country
- 8.4.2.2 LAMEA Services Market by Country
- 8.4.3 LAMEA Virtual Sports Market by Demographic
- 8.4.3.1 LAMEA 21 to 35 Years Market by Country
- 8.4.3.2 LAMEA Below 21 Years Market by Country
- 8.4.3.3 LAMEA 35 to 54 Years Market by Country
- 8.4.3.4 LAMEA 54 Years and Above Market by Country
- 8.4.4 LAMEA Virtual Sports Market by Country
- 8.4.4.1 Brazil Virtual Sports Market
- 8.4.4.1.1 Brazil Virtual Sports Market by Game
- 8.4.4.1.2 Brazil Virtual Sports Market by Component
- 8.4.4.1.3 Brazil Virtual Sports Market by Demographic
- 8.4.4.2 Argentina Virtual Sports Market
- 8.4.4.2.1 Argentina Virtual Sports Market by Game
- 8.4.4.2.2 Argentina Virtual Sports Market by Component
- 8.4.4.2.3 Argentina Virtual Sports Market by Demographic
- 8.4.4.3 UAE Virtual Sports Market
- 8.4.4.3.1 UAE Virtual Sports Market by Game
- 8.4.4.3.2 UAE Virtual Sports Market by Component
- 8.4.4.3.3 UAE Virtual Sports Market by Demographic
- 8.4.4.4 Saudi Arabia Virtual Sports Market
- 8.4.4.4.1 Saudi Arabia Virtual Sports Market by Game
- 8.4.4.4.2 Saudi Arabia Virtual Sports Market by Component
- 8.4.4.4.3 Saudi Arabia Virtual Sports Market by Demographic
- 8.4.4.5 South Africa Virtual Sports Market
- 8.4.4.5.1 South Africa Virtual Sports Market by Game
- 8.4.4.5.2 South Africa Virtual Sports Market by Component
- 8.4.4.5.3 South Africa Virtual Sports Market by Demographic
- 8.4.4.6 Nigeria Virtual Sports Market
- 8.4.4.6.1 Nigeria Virtual Sports Market by Game
- 8.4.4.6.2 Nigeria Virtual Sports Market by Component
- 8.4.4.6.3 Nigeria Virtual Sports Market by Demographic
- 8.4.4.7 Rest of LAMEA Virtual Sports Market
- 8.4.4.7.1 Rest of LAMEA Virtual Sports Market by Game
- 8.4.4.7.2 Rest of LAMEA Virtual Sports Market by Component
- 8.4.4.7.3 Rest of LAMEA Virtual Sports Market by Demographic
- 8.4.4.1 Brazil Virtual Sports Market
- 8.4.1 LAMEA Virtual Sports Market by Game
Chapter 9. Company Profiles
- 9.1 Activision Blizzard, Inc. (Microsoft Corporation)
- 9.1.1 Company Overview
- 9.1.2 Financial Analysis
- 9.1.3 Segmental and Regional Analysis
- 9.1.4 Research & Development Expenses
- 9.1.5 Recent strategies and developments:
- 9.1.5.1 Product Launches and Product Expansions:
- 9.1.6 SWOT Analysis
- 9.2 Electronic Arts, Inc.
- 9.2.1 Company Overview
- 9.2.2 Financial Analysis
- 9.2.3 Research & Development Expenses
- 9.2.4 Recent strategies and developments:
- 9.2.4.1 Partnerships, Collaborations, and Agreements:
- 9.2.5 SWOT Analysis
- 9.3 Konami Holdings Corporation
- 9.3.1 Company Overview
- 9.3.2 Financial Analysis
- 9.3.3 Segmental Analysis
- 9.3.4 SWOT Analysis
- 9.4 Nintendo Co., Ltd. (Nintendo)
- 9.4.1 Company Overview
- 9.4.2 Financial Analysis
- 9.4.3 Segmental and Regional Analysis
- 9.4.4 Research & Development Expenses
- 9.4.5 Recent strategies and developments:
- 9.4.5.1 Partnerships, Collaborations, and Agreements:
- 9.4.5.2 Product Launches and Product Expansions:
- 9.4.6 SWOT Analysis
- 9.5 NACON (BIGBEN group)
- 9.5.1 Company Overview
- 9.5.2 SWOT Analysis
- 9.6 Dovetail Games (Focus Entertainment)
- 9.6.1 Company Overview
- 9.6.2 Financial Analysis
- 9.6.3 Regional Analysis
- 9.6.4 SWOT Analysis
- 9.7 Take-Two Interactive Software, Inc.
- 9.7.1 Company Overview
- 9.7.2 Financial Analysis
- 9.7.3 Regional Analysis
- 9.7.4 Research & Development Expenses
- 9.7.5 Recent strategies and developments:
- 9.7.5.1 Partnerships, Collaborations, and Agreements:
- 9.7.5.2 Acquisition and Mergers:
- 9.7.6 SWOT Analysis
- 9.8 Milestone S.r.L. (Plaion)
- 9.8.1 Company Overview
- 9.8.2 Recent strategies and developments:
- 9.8.2.1 Acquisition and Mergers:
- 9.8.3 SWOT Analysis
- 9.9 Netmarble Corp
- 9.9.1 Company Overview
- 9.9.2 Financial Analysis
- 9.9.3 Regional Analysis
- 9.9.4 Recent strategies and developments:
- 9.9.4.1 Partnerships, Collaborations, and Agreements:
- 9.9.4.2 Product Launches and Product Expansions:
- 9.9.5 SWOT Analysis
- 9.10. Square Enix Holdings Co., Ltd. (Square Enix)
- 9.10.1 Company Overview
- 9.10.2 Financial Analysis
- 9.10.3 Recent strategies and developments:
- 9.10.3.1 Partnerships, Collaborations, and Agreements:
- 9.10.4 SWOT Analysis

