|
|
市場調査レポート
商品コード
1580862
スポーツにおける人工知能(AI)の世界市場、2024~2028年Global Artificial Intelligence (AI) Market in Sports 2024-2028 |
||||||

|
|||||||
カスタマイズ可能
|
|||||||

| スポーツにおける人工知能(AI)の世界市場、2024~2028年 |
|
出版日: 2024年08月14日
発行: TechNavio
ページ情報: 英文 146 Pages
納期: 即納可能
|

全表示
- 概要
- 図表
- 目次
スポーツにおける人工知能(AI)市場、2024~2028年
スポーツにおける人工知能(AI)市場は、2023~2028年に64億2,210万米ドル、予測期間中のCAGRは33.13%で成長すると予測されます。当レポートでは、スポーツにおける人工知能(AI)市場について、全体的な分析、市場規模・予測、動向、成長促進要因・課題のほか、約25のベンダーを網羅したベンダー分析を掲載しています。
現在の市場シナリオ、最新動向と促進要因、市場環境全体に関する最新分析を提供しています。同市場は、データ統合とビジュアル分析に対する需要の高まり、スポーツにおける選手のデータのモニタリングとトラッキングに対する需要の高まり、パフォーマンス向上のためのリアルタイムデータ分析に対する要求によって牽引されています。
| 市場範囲 | |
|---|---|
| 基準年 | 2024年 |
| 終了年 | 2028年 |
| 予測期間 | 2024~2028年 |
| 成長モメンタム | 加速 |
| 前年比[2024年] | 26.95% |
| CAGR | 33.13% |
| 増分額 | 64億2,210万米ドル |
本調査では、クラウドベースのソリューションの採用が増加していることが、今後数年間のスポーツセグメントにおける人工知能(AI)市場の成長を促進する主要要因の1つであると指摘しています。また、インテリジェント処理への投資が増加し、AI技術の採用が増加することで、同市場では大きな需要が見込まれます。
目次
第1章 エグゼクティブサマリー
- 市場概要
第2章 市場情勢
- 市場エコシステム
- 市場の特徴
- バリューチェーン分析
第3章 市場規模の評価
- 市場の定義
- 市場セグメント分析
- 市場規模 2023年
- 市場の展望 2023~2028年
第4章 市場規模実績
- スポーツにおける人工知能(AI)の世界市場 2018~2022年
- タイプ別セグメント分析 2018~2022年
- 地域別セグメント分析 2018~2022年
- 国別セグメント分析 2018~2022年
第5章 ファイブフォース分析
- ファイブフォースの要約
- 買い手の交渉力
- 供給企業の交渉力
- 新規参入業者の脅威
- 代替品の脅威
- 競争の脅威
- 市況
第6章 市場セグメンテーション:タイプ別
- 市場セグメンテーション
- 比較:タイプ別
- フットボール:市場規模と予測 2023~2028年
- クリケット:市場規模と予測 2023~2028年
- テニス:市場規模と予測 2023~2028年
- バスケットボール:市場規模と予測 2023~2028年
- その他:市場規模と予測 2023~2028年
- タイプ別の市場機会
第7章 顧客情勢
- 顧客情勢概要
第8章 地域別情勢
- 地域別セグメンテーション
- 比較:地域別
- 北米:市場規模と予測 2023~2028年
- 欧州:市場規模と予測 2023~2028年
- アジア太平洋:市場規模と予測 2023~2028年
- 中東・アフリカ:市場規模と予測 2023~2028年
- 南米:市場規模と予測 2023~2028年
- 米国:市場規模と予測 2023~2028年
- 英国:市場規模と予測 2023~2028年
- フランス:市場規模と予測 2023~2028年
- 中国:市場規模と予測 2023~2028年
- オーストラリア:市場規模と予測 2023~2028年
- 地域情勢別の市場機会
第9章 促進要因・課題・機会・抑制要因
- 市場促進要因
- 市場課題
- 促進要因と課題の影響
- 市場の機会・抑制要因
第10章 競合情勢
- 概要
- 競合情勢
- 混乱の状況
- 業界のリスク
第11章 競合分析
- 企業プロファイル
- 企業の市場ポジショニング
- Advanced Micro Devices Inc.
- Catapult Group International Ltd.
- International Business Machines Corp.
- Meta Platforms Inc.
- Microsoft Corp.
- Salesforce Inc.
- SAP SE
- SAS Institute Inc.
- Sportradar Group AG
- Stats Perform group of companies
第12章 付録
Exhibits:
- Exhibits1: Executive Summary - Chart on Market Overview
- Exhibits2: Executive Summary - Data Table on Market Overview
- Exhibits3: Executive Summary - Chart on Global Market Characteristics
- Exhibits4: Executive Summary - Chart on Market By Geographical Landscape
- Exhibits5: Executive Summary - Chart on Market Segmentation by Type
- Exhibits6: Executive Summary - Chart on Incremental Growth
- Exhibits7: Executive Summary - Data Table on Incremental Growth
- Exhibits8: Executive Summary - Chart on Company Market Positioning
- Exhibits9: Parent Market
- Exhibits10: Data Table on - Parent Market
- Exhibits11: Market characteristics analysis
- Exhibits12: Value Chain Analysis
- Exhibits13: Offerings of companies included in the market definition
- Exhibits14: Market segments
- Exhibits15: Chart on Global - Market size and forecast 2023-2028 ($ million)
- Exhibits16: Data Table on Global - Market size and forecast 2023-2028 ($ million)
- Exhibits17: Chart on Global Market: Year-over-year growth 2023-2028 (%)
- Exhibits18: Data Table on Global Market: Year-over-year growth 2023-2028 (%)
- Exhibits19: Historic Market Size - Data Table on Global Artificial Intelligence (AI) Market In Sports 2018 - 2022 ($ million)
- Exhibits20: Historic Market Size - Type Segment 2018 - 2022 ($ million)
- Exhibits21: Historic Market Size - Geography Segment 2018 - 2022 ($ million)
- Exhibits22: Historic Market Size - Country Segment 2018 - 2022 ($ million)
- Exhibits23: Five forces analysis - Comparison between 2023 and 2028
- Exhibits24: Bargaining power of buyers - Impact of key factors 2023 and 2028
- Exhibits25: Bargaining power of suppliers - Impact of key factors in 2023 and 2028
- Exhibits26: Threat of new entrants - Impact of key factors in 2023 and 2028
- Exhibits27: Threat of substitutes - Impact of key factors in 2023 and 2028
- Exhibits28: Threat of rivalry - Impact of key factors in 2023 and 2028
- Exhibits29: Chart on Market condition - Five forces 2023 and 2028
- Exhibits30: Chart on Type - Market share 2023-2028 (%)
- Exhibits31: Data Table on Type - Market share 2023-2028 (%)
- Exhibits32: Chart on Comparison by Type
- Exhibits33: Data Table on Comparison by Type
- Exhibits34: Chart on Football - Market size and forecast 2023-2028 ($ million)
- Exhibits35: Data Table on Football - Market size and forecast 2023-2028 ($ million)
- Exhibits36: Chart on Football - Year-over-year growth 2023-2028 (%)
- Exhibits37: Data Table on Football - Year-over-year growth 2023-2028 (%)
- Exhibits38: Chart on Cricket - Market size and forecast 2023-2028 ($ million)
- Exhibits39: Data Table on Cricket - Market size and forecast 2023-2028 ($ million)
- Exhibits40: Chart on Cricket - Year-over-year growth 2023-2028 (%)
- Exhibits41: Data Table on Cricket - Year-over-year growth 2023-2028 (%)
- Exhibits42: Chart on Tennis - Market size and forecast 2023-2028 ($ million)
- Exhibits43: Data Table on Tennis - Market size and forecast 2023-2028 ($ million)
- Exhibits44: Chart on Tennis - Year-over-year growth 2023-2028 (%)
- Exhibits45: Data Table on Tennis - Year-over-year growth 2023-2028 (%)
- Exhibits46: Chart on Basketball - Market size and forecast 2023-2028 ($ million)
- Exhibits47: Data Table on Basketball - Market size and forecast 2023-2028 ($ million)
- Exhibits48: Chart on Basketball - Year-over-year growth 2023-2028 (%)
- Exhibits49: Data Table on Basketball - Year-over-year growth 2023-2028 (%)
- Exhibits50: Chart on Other - Market size and forecast 2023-2028 ($ million)
- Exhibits51: Data Table on Other - Market size and forecast 2023-2028 ($ million)
- Exhibits52: Chart on Other - Year-over-year growth 2023-2028 (%)
- Exhibits53: Data Table on Other - Year-over-year growth 2023-2028 (%)
- Exhibits54: Market opportunity by Type ($ million)
- Exhibits55: Data Table on Market opportunity by Type ($ million)
- Exhibits56: Analysis of price sensitivity, lifecycle, customer purchase basket, adoption rates, and purchase criteria
- Exhibits57: Chart on Market share By Geographical Landscape 2023-2028 (%)
- Exhibits58: Data Table on Market share By Geographical Landscape 2023-2028 (%)
- Exhibits59: Chart on Geographic comparison
- Exhibits60: Data Table on Geographic comparison
- Exhibits61: Chart on North America - Market size and forecast 2023-2028 ($ million)
- Exhibits62: Data Table on North America - Market size and forecast 2023-2028 ($ million)
- Exhibits63: Chart on North America - Year-over-year growth 2023-2028 (%)
- Exhibits64: Data Table on North America - Year-over-year growth 2023-2028 (%)
- Exhibits65: Chart on Europe - Market size and forecast 2023-2028 ($ million)
- Exhibits66: Data Table on Europe - Market size and forecast 2023-2028 ($ million)
- Exhibits67: Chart on Europe - Year-over-year growth 2023-2028 (%)
- Exhibits68: Data Table on Europe - Year-over-year growth 2023-2028 (%)
- Exhibits69: Chart on APAC - Market size and forecast 2023-2028 ($ million)
- Exhibits70: Data Table on APAC - Market size and forecast 2023-2028 ($ million)
- Exhibits71: Chart on APAC - Year-over-year growth 2023-2028 (%)
- Exhibits72: Data Table on APAC - Year-over-year growth 2023-2028 (%)
- Exhibits73: Chart on Middle East and Africa - Market size and forecast 2023-2028 ($ million)
- Exhibits74: Data Table on Middle East and Africa - Market size and forecast 2023-2028 ($ million)
- Exhibits75: Chart on Middle East and Africa - Year-over-year growth 2023-2028 (%)
- Exhibits76: Data Table on Middle East and Africa - Year-over-year growth 2023-2028 (%)
- Exhibits77: Chart on South America - Market size and forecast 2023-2028 ($ million)
- Exhibits78: Data Table on South America - Market size and forecast 2023-2028 ($ million)
- Exhibits79: Chart on South America - Year-over-year growth 2023-2028 (%)
- Exhibits80: Data Table on South America - Year-over-year growth 2023-2028 (%)
- Exhibits81: Chart on US - Market size and forecast 2023-2028 ($ million)
- Exhibits82: Data Table on US - Market size and forecast 2023-2028 ($ million)
- Exhibits83: Chart on US - Year-over-year growth 2023-2028 (%)
- Exhibits84: Data Table on US - Year-over-year growth 2023-2028 (%)
- Exhibits85: Chart on UK - Market size and forecast 2023-2028 ($ million)
- Exhibits86: Data Table on UK - Market size and forecast 2023-2028 ($ million)
- Exhibits87: Chart on UK - Year-over-year growth 2023-2028 (%)
- Exhibits88: Data Table on UK - Year-over-year growth 2023-2028 (%)
- Exhibits89: Chart on France - Market size and forecast 2023-2028 ($ million)
- Exhibits90: Data Table on France - Market size and forecast 2023-2028 ($ million)
- Exhibits91: Chart on France - Year-over-year growth 2023-2028 (%)
- Exhibits92: Data Table on France - Year-over-year growth 2023-2028 (%)
- Exhibits93: Chart on China - Market size and forecast 2023-2028 ($ million)
- Exhibits94: Data Table on China - Market size and forecast 2023-2028 ($ million)
- Exhibits95: Chart on China - Year-over-year growth 2023-2028 (%)
- Exhibits96: Data Table on China - Year-over-year growth 2023-2028 (%)
- Exhibits97: Chart on Australia - Market size and forecast 2023-2028 ($ million)
- Exhibits98: Data Table on Australia - Market size and forecast 2023-2028 ($ million)
- Exhibits99: Chart on Australia - Year-over-year growth 2023-2028 (%)
- Exhibits100: Data Table on Australia - Year-over-year growth 2023-2028 (%)
- Exhibits101: Market opportunity By Geographical Landscape ($ million)
- Exhibits102: Data Tables on Market opportunity By Geographical Landscape ($ million)
- Exhibits103: Impact of drivers and challenges in 2023 and 2028
- Exhibits104: Overview on criticality of inputs and factors of differentiation
- Exhibits105: Overview on factors of disruption
- Exhibits106: Impact of key risks on business
- Exhibits107: Companies covered
- Exhibits108: Matrix on companies position and classification
- Exhibits109: Advanced Micro Devices Inc. - Overview
- Exhibits110: Advanced Micro Devices Inc. - Business segments
- Exhibits111: Advanced Micro Devices Inc. - Key news
- Exhibits112: Advanced Micro Devices Inc. - Key offerings
- Exhibits113: Advanced Micro Devices Inc. - Segment focus
- Exhibits114: Catapult Group International Ltd. - Overview
- Exhibits115: Catapult Group International Ltd. - Product / Service
- Exhibits116: Catapult Group International Ltd. - Key offerings
- Exhibits117: International Business Machines Corp. - Overview
- Exhibits118: International Business Machines Corp. - Business segments
- Exhibits119: International Business Machines Corp. - Key news
- Exhibits120: International Business Machines Corp. - Key offerings
- Exhibits121: International Business Machines Corp. - Segment focus
- Exhibits122: Meta Platforms Inc. - Overview
- Exhibits123: Meta Platforms Inc. - Business segments
- Exhibits124: Meta Platforms Inc. - Key news
- Exhibits125: Meta Platforms Inc. - Key offerings
- Exhibits126: Meta Platforms Inc. - Segment focus
- Exhibits127: Microsoft Corp. - Overview
- Exhibits128: Microsoft Corp. - Business segments
- Exhibits129: Microsoft Corp. - Key news
- Exhibits130: Microsoft Corp. - Key offerings
- Exhibits131: Microsoft Corp. - Segment focus
- Exhibits132: Salesforce Inc. - Overview
- Exhibits133: Salesforce Inc. - Product / Service
- Exhibits134: Salesforce Inc. - Key news
- Exhibits135: Salesforce Inc. - Key offerings
- Exhibits136: SAP SE - Overview
- Exhibits137: SAP SE - Business segments
- Exhibits138: SAP SE - Key news
- Exhibits139: SAP SE - Key offerings
- Exhibits140: SAP SE - Segment focus
- Exhibits141: SAS Institute Inc. - Overview
- Exhibits142: SAS Institute Inc. - Product / Service
- Exhibits143: SAS Institute Inc. - Key news
- Exhibits144: SAS Institute Inc. - Key offerings
- Exhibits145: Sportradar Group AG - Overview
- Exhibits146: Sportradar Group AG - Product / Service
- Exhibits147: Sportradar Group AG - Key offerings
- Exhibits148: Stats Perform group of companies - Overview
- Exhibits149: Stats Perform group of companies - Product / Service
- Exhibits150: Stats Perform group of companies - Key offerings
- Exhibits151: Inclusions checklist
- Exhibits152: Exclusions checklist
- Exhibits153: Currency conversion rates for US$
- Exhibits154: Research methodology
- Exhibits155: Information sources
- Exhibits156: Data validation
- Exhibits157: Validation techniques employed for market sizing
- Exhibits158: Data synthesis
- Exhibits159: 360 degree market analysis
- Exhibits160: List of abbreviations
Artificial Intelligence (AI) In Sports Market 2024-2028
The artificial intelligence (AI) in sports market is forecasted to grow by USD 6422.1 mn during 2023-2028, accelerating at a CAGR of 33.13% during the forecast period. The report on the artificial intelligence (AI) in sports market provides a holistic analysis, market size and forecast, trends, growth drivers, and challenges, as well as vendor analysis covering around 25 vendors.
The report offers an up-to-date analysis regarding the current market scenario, the latest trends and drivers, and the overall market environment. The market is driven by increasing demand for data integration and visual analytics, rising demand for monitoring and tracking data of players in sports, and requirement of real-time data analytics to improve performance.
| Market Scope | |
|---|---|
| Base Year | 2024 |
| End Year | 2028 |
| Series Year | 2024-2028 |
| Growth Momentum | Accelerate |
| YOY 2024 | 26.95% |
| CAGR | 33.13% |
| Incremental Value | $6422.1 mn |
Technavio's artificial intelligence (AI) in sports market is segmented as below:
By Type
- Football
- Cricket
- Tennis
- Basketball
- Other
By Geographical Landscape
- North America
- Europe
- APAC
- Middle East and Africa
- South America
This study identifies the increasing adoption of cloud-based solutions as one of the prime reasons driving the artificial intelligence (AI) in sports market growth during the next few years. Also, increasing investment in intelligent processing and increasing adoption of AI technology will lead to sizable demand in the market.
The report on the artificial intelligence (AI) in sports market covers the following areas:
- Artificial intelligence (AI) in sports market sizing
- Artificial intelligence (AI) in sports market forecast
- Artificial intelligence (AI) in sports market industry analysis
The robust vendor analysis is designed to help clients improve their market position, and in line with this, this report provides a detailed analysis of several leading artificial intelligence (AI) in sports market vendors that include Advanced Micro Devices Inc., AIBrain Inc., Amazon.com Inc., Anodot Ltd., Appinventiv Technologies Pvt. Ltd., Apple Inc., Arm Ltd., Catapult Group International Ltd., Cisco Systems Inc., Fujitsu Ltd., International Business Machines Corp., Meta Platforms Inc., Microsoft Corp., RacksonsIT Developers Pvt. Ltd., Salesforce Inc., SAP SE, SAS Institute Inc., Sportradar Group AG, Stats Perform group of companies, and V7 Ltd.. Also, the artificial intelligence (AI) in sports market analysis report includes information on upcoming trends and challenges that will influence market growth. This is to help companies strategize and leverage all forthcoming growth opportunities.
The study was conducted using an objective combination of primary and secondary information including inputs from key participants in the industry. The report contains a comprehensive market and vendor landscape in addition to an analysis of the key vendors.
The publisher presents a detailed picture of the market by the way of study, synthesis, and summation of data from multiple sources by an analysis of key parameters such as profit, pricing, competition, and promotions. It presents various market facets by identifying the key industry influencers. The data presented is comprehensive, reliable, and a result of extensive primary and secondary research. The market research reports provide a complete competitive landscape and an in-depth vendor selection methodology and analysis using qualitative and quantitative research to forecast accurate market growth.
Table of Contents
1 Executive Summary
- 1.1 Market overview
- Executive Summary - Chart on Market Overview
- Executive Summary - Data Table on Market Overview
- Executive Summary - Chart on Global Market Characteristics
- Executive Summary - Chart on Market By Geographical Landscape
- Executive Summary - Chart on Market Segmentation by Type
- Executive Summary - Chart on Incremental Growth
- Executive Summary - Data Table on Incremental Growth
- Executive Summary - Chart on Company Market Positioning
2 Market Landscape
- 2.1 Market ecosystem
- Parent Market
- Data Table on - Parent Market
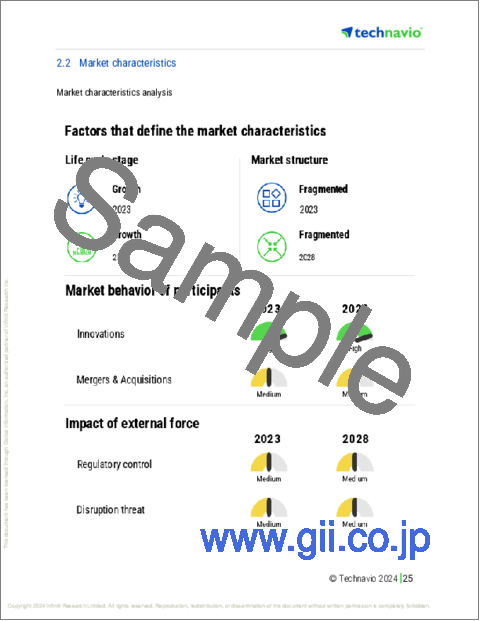
- 2.2 Market characteristics
- Market characteristics analysis
- 2.3 Value chain analysis
- Value Chain Analysis
3 Market Sizing
- 3.1 Market definition
- Offerings of companies included in the market definition
- 3.2 Market segment analysis
- Market segments
- 3.3 Market size 2023
- 3.4 Market outlook: Forecast for 2023-2028
- Chart on Global - Market size and forecast 2023-2028 ($ million)
- Data Table on Global - Market size and forecast 2023-2028 ($ million)
- Chart on Global Market: Year-over-year growth 2023-2028 (%)
- Data Table on Global Market: Year-over-year growth 2023-2028 (%)
4 Historic Market Size
- 4.1 Global Artificial Intelligence (AI) Market In Sports 2018 - 2022
- Historic Market Size - Data Table on Global Artificial Intelligence (AI) Market In Sports 2018 - 2022 ($ million)
- 4.2 Type segment analysis 2018 - 2022
- Historic Market Size - Type Segment 2018 - 2022 ($ million)
- 4.3 Geography segment analysis 2018 - 2022
- Historic Market Size - Geography Segment 2018 - 2022 ($ million)
- 4.4 Country segment analysis 2018 - 2022
- Historic Market Size - Country Segment 2018 - 2022 ($ million)
5 Five Forces Analysis
- 5.1 Five forces summary
- Five forces analysis - Comparison between 2023 and 2028
- 5.2 Bargaining power of buyers
- Bargaining power of buyers - Impact of key factors 2023 and 2028
- 5.3 Bargaining power of suppliers
- Bargaining power of suppliers - Impact of key factors in 2023 and 2028
- 5.4 Threat of new entrants
- Threat of new entrants - Impact of key factors in 2023 and 2028
- 5.5 Threat of substitutes
- Threat of substitutes - Impact of key factors in 2023 and 2028
- 5.6 Threat of rivalry
- Threat of rivalry - Impact of key factors in 2023 and 2028
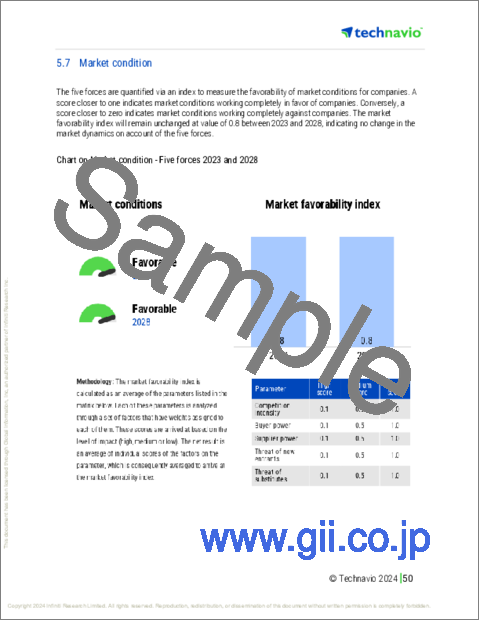
- 5.7 Market condition
- Chart on Market condition - Five forces 2023 and 2028
6 Market Segmentation by Type
- 6.1 Market segments
- Chart on Type - Market share 2023-2028 (%)
- Data Table on Type - Market share 2023-2028 (%)
- 6.2 Comparison by Type
- Chart on Comparison by Type
- Data Table on Comparison by Type
- 6.3 Football - Market size and forecast 2023-2028
- Chart on Football - Market size and forecast 2023-2028 ($ million)
- Data Table on Football - Market size and forecast 2023-2028 ($ million)
- Chart on Football - Year-over-year growth 2023-2028 (%)
- Data Table on Football - Year-over-year growth 2023-2028 (%)
- 6.4 Cricket - Market size and forecast 2023-2028
- Chart on Cricket - Market size and forecast 2023-2028 ($ million)
- Data Table on Cricket - Market size and forecast 2023-2028 ($ million)
- Chart on Cricket - Year-over-year growth 2023-2028 (%)
- Data Table on Cricket - Year-over-year growth 2023-2028 (%)
- 6.5 Tennis - Market size and forecast 2023-2028
- Chart on Tennis - Market size and forecast 2023-2028 ($ million)
- Data Table on Tennis - Market size and forecast 2023-2028 ($ million)
- Chart on Tennis - Year-over-year growth 2023-2028 (%)
- Data Table on Tennis - Year-over-year growth 2023-2028 (%)
- 6.6 Basketball - Market size and forecast 2023-2028
- Chart on Basketball - Market size and forecast 2023-2028 ($ million)
- Data Table on Basketball - Market size and forecast 2023-2028 ($ million)
- Chart on Basketball - Year-over-year growth 2023-2028 (%)
- Data Table on Basketball - Year-over-year growth 2023-2028 (%)
- 6.7 Other - Market size and forecast 2023-2028
- Chart on Other - Market size and forecast 2023-2028 ($ million)
- Data Table on Other - Market size and forecast 2023-2028 ($ million)
- Chart on Other - Year-over-year growth 2023-2028 (%)
- Data Table on Other - Year-over-year growth 2023-2028 (%)
- 6.8 Market opportunity by Type
- Market opportunity by Type ($ million)
- Data Table on Market opportunity by Type ($ million)
7 Customer Landscape
- 7.1 Customer landscape overview
- Analysis of price sensitivity, lifecycle, customer purchase basket, adoption rates, and purchase criteria
8 Geographic Landscape
- 8.1 Geographic segmentation
- Chart on Market share By Geographical Landscape 2023-2028 (%)
- Data Table on Market share By Geographical Landscape 2023-2028 (%)
- 8.2 Geographic comparison
- Chart on Geographic comparison
- Data Table on Geographic comparison
- 8.3 North America - Market size and forecast 2023-2028
- Chart on North America - Market size and forecast 2023-2028 ($ million)
- Data Table on North America - Market size and forecast 2023-2028 ($ million)
- Chart on North America - Year-over-year growth 2023-2028 (%)
- Data Table on North America - Year-over-year growth 2023-2028 (%)
- 8.4 Europe - Market size and forecast 2023-2028
- Chart on Europe - Market size and forecast 2023-2028 ($ million)
- Data Table on Europe - Market size and forecast 2023-2028 ($ million)
- Chart on Europe - Year-over-year growth 2023-2028 (%)
- Data Table on Europe - Year-over-year growth 2023-2028 (%)
- 8.5 APAC - Market size and forecast 2023-2028
- Chart on APAC - Market size and forecast 2023-2028 ($ million)
- Data Table on APAC - Market size and forecast 2023-2028 ($ million)
- Chart on APAC - Year-over-year growth 2023-2028 (%)
- Data Table on APAC - Year-over-year growth 2023-2028 (%)
- 8.6 Middle East and Africa - Market size and forecast 2023-2028
- Chart on Middle East and Africa - Market size and forecast 2023-2028 ($ million)
- Data Table on Middle East and Africa - Market size and forecast 2023-2028 ($ million)
- Chart on Middle East and Africa - Year-over-year growth 2023-2028 (%)
- Data Table on Middle East and Africa - Year-over-year growth 2023-2028 (%)
- 8.7 South America - Market size and forecast 2023-2028
- Chart on South America - Market size and forecast 2023-2028 ($ million)
- Data Table on South America - Market size and forecast 2023-2028 ($ million)
- Chart on South America - Year-over-year growth 2023-2028 (%)
- Data Table on South America - Year-over-year growth 2023-2028 (%)
- 8.8 US - Market size and forecast 2023-2028
- Chart on US - Market size and forecast 2023-2028 ($ million)
- Data Table on US - Market size and forecast 2023-2028 ($ million)
- Chart on US - Year-over-year growth 2023-2028 (%)
- Data Table on US - Year-over-year growth 2023-2028 (%)
- 8.9 UK - Market size and forecast 2023-2028
- Chart on UK - Market size and forecast 2023-2028 ($ million)
- Data Table on UK - Market size and forecast 2023-2028 ($ million)
- Chart on UK - Year-over-year growth 2023-2028 (%)
- Data Table on UK - Year-over-year growth 2023-2028 (%)
- 8.10 France - Market size and forecast 2023-2028
- Chart on France - Market size and forecast 2023-2028 ($ million)
- Data Table on France - Market size and forecast 2023-2028 ($ million)
- Chart on France - Year-over-year growth 2023-2028 (%)
- Data Table on France - Year-over-year growth 2023-2028 (%)
- 8.11 China - Market size and forecast 2023-2028
- Chart on China - Market size and forecast 2023-2028 ($ million)
- Data Table on China - Market size and forecast 2023-2028 ($ million)
- Chart on China - Year-over-year growth 2023-2028 (%)
- Data Table on China - Year-over-year growth 2023-2028 (%)
- 8.12 Australia - Market size and forecast 2023-2028
- Chart on Australia - Market size and forecast 2023-2028 ($ million)
- Data Table on Australia - Market size and forecast 2023-2028 ($ million)
- Chart on Australia - Year-over-year growth 2023-2028 (%)
- Data Table on Australia - Year-over-year growth 2023-2028 (%)
- 8.13 Market opportunity By Geographical Landscape
- Market opportunity By Geographical Landscape ($ million)
- Data Tables on Market opportunity By Geographical Landscape ($ million)
9 Drivers, Challenges, and Opportunity/Restraints
- 9.1 Market drivers
- 9.2 Market challenges
- 9.3 Impact of drivers and challenges
- Impact of drivers and challenges in 2023 and 2028
- 9.4 Market opportunities/restraints
10 Competitive Landscape
- 10.1 Overview
- 10.2 Competitive Landscape
- Overview on criticality of inputs and factors of differentiation
- 10.3 Landscape disruption
- Overview on factors of disruption
- 10.4 Industry risks
- Impact of key risks on business
11 Competitive Analysis
- 11.1 Companies profiled
- Companies covered
- 11.2 Market positioning of companies
- Matrix on companies position and classification
- 11.3 Advanced Micro Devices Inc.
- Advanced Micro Devices Inc. - Overview
- Advanced Micro Devices Inc. - Business segments
- Advanced Micro Devices Inc. - Key news
- Advanced Micro Devices Inc. - Key offerings
- Advanced Micro Devices Inc. - Segment focus
- 11.4 Catapult Group International Ltd.
- Catapult Group International Ltd. - Overview
- Catapult Group International Ltd. - Product / Service
- Catapult Group International Ltd. - Key offerings
- 11.5 International Business Machines Corp.
- International Business Machines Corp. - Overview
- International Business Machines Corp. - Business segments
- International Business Machines Corp. - Key news
- International Business Machines Corp. - Key offerings
- International Business Machines Corp. - Segment focus
- 11.6 Meta Platforms Inc.
- Meta Platforms Inc. - Overview
- Meta Platforms Inc. - Business segments
- Meta Platforms Inc. - Key news
- Meta Platforms Inc. - Key offerings
- Meta Platforms Inc. - Segment focus
- 11.7 Microsoft Corp.
- Microsoft Corp. - Overview
- Microsoft Corp. - Business segments
- Microsoft Corp. - Key news
- Microsoft Corp. - Key offerings
- Microsoft Corp. - Segment focus
- 11.8 Salesforce Inc.
- Salesforce Inc. - Overview
- Salesforce Inc. - Product / Service
- Salesforce Inc. - Key news
- Salesforce Inc. - Key offerings
- 11.9 SAP SE
- SAP SE - Overview
- SAP SE - Business segments
- SAP SE - Key news
- SAP SE - Key offerings
- SAP SE - Segment focus
- 11.10 SAS Institute Inc.
- SAS Institute Inc. - Overview
- SAS Institute Inc. - Product / Service
- SAS Institute Inc. - Key news
- SAS Institute Inc. - Key offerings
- 11.11 Sportradar Group AG
- Sportradar Group AG - Overview
- Sportradar Group AG - Product / Service
- Sportradar Group AG - Key offerings
- 11.12 Stats Perform group of companies
- Stats Perform group of companies - Overview
- Stats Perform group of companies - Product / Service
- Stats Perform group of companies - Key offerings
12 Appendix
- 12.1 Scope of the report
- 12.2 Inclusions and exclusions checklist
- Inclusions checklist
- Exclusions checklist
- 12.3 Currency conversion rates for US$
- Currency conversion rates for US$
- 12.4 Research methodology
- Research methodology
- 12.5 Data procurement
- Information sources
- 12.6 Data validation
- Data validation
- 12.7 Validation techniques employed for market sizing
- Validation techniques employed for market sizing
- 12.8 Data synthesis
- Data synthesis
- 12.9 360 degree market analysis
- 360 degree market analysis
- 12.10 List of abbreviations
- List of abbreviations
