|
|
市場調査レポート
商品コード
1384627
拡張アナリティクスの世界市場規模、シェア、産業動向分析レポート:企業タイプ別、エンドユーザー別、地域別展望と予測、2023年~2030年Global Augmented Analytics Market Size, Share & Industry Trends Analysis Report By Enterprise Type (Large Enterprises, Small & Medium Enterprises), By End User, By Regional Outlook and Forecast, 2023 - 2030 |
||||||
|
|
|||||||
|
|||||||


| 拡張アナリティクスの世界市場規模、シェア、産業動向分析レポート:企業タイプ別、エンドユーザー別、地域別展望と予測、2023年~2030年 |
|
出版日: 2023年10月31日
発行: KBV Research
ページ情報: 英文 246 Pages
納期: 即納可能
|

全表示
- 概要
- 図表
- 目次
拡張アナリティクス市場規模は2030年までに702億米ドルに達すると予測され、予測期間中のCAGRは22.3%の市場成長率で上昇する見込みです。
KBV Cardinalのマトリックスに示された分析によると、Microsoft Corporationが同市場におけるトップランナーです。オラクル・コーポレーション、SAP SE、IBMコーポレーションなどの企業は、この市場における主要なイノベーターです。例えば、2023年6月、Salesforce, Inc.は、Googleが提供するクラウドプラットフォームであるGoogle Cloudと提携しました。両社は、データおよびAIツールをCRMシステムに組み込むことで、企業のCRMシステム強化を促進することを目的としています。
市場成長要因
業界全体のデジタルトランスフォーメーションによる需要の高まり
企業はデジタルトランスフォーメーション活動の一環として、数え切れないほどの量のデータを収集・蓄積しています。有意義な洞察を引き出し、十分な情報に基づいた意思決定を推進するためには、高度な分析ツールが必要です。自動化と予測機能を備えたアナリティクス・ツールは、企業がこうしたデータを効果的に活用するのに役立ちます。デジタルトランスフォーメーションは、顧客体験の向上に重点を置くことが多いです。顧客データを分析し、嗜好や行動を把握することで、デジタル・トランスフォーメーションはこの点で重要な役割を果たします。これにより、組織はデジタルトランスフォーメーションの中心的な取り組みとして、よりパーソナライズされたオーダーメイドのエクスペリエンスを提供できるようになります。デジタルトランスフォーメーションには、クラウド技術の採用やデジタルインフラの拡張が含まれることが多いです。このため、強固なデータ・セキュリティと、GDPRやHIPAAといった法律の遵守がより強く求められるようになります。これらのツールは、機密データを保護し、規制コンプライアンスを確保するための高度なセキュリティ機能を提供します。したがって、これらの要因は、今後数年間、これらのアナリティクスの需要を促進すると思われます。
拡張アナリティクス・ソリューションのユーザーフレンドリーな性質
これらのツールのユーザーフレンドリーな性質は、データサイエンティストやアナリストだけでなく、より幅広い専門家がこれらのツールを使用できることを意味します。これにより、拡張アナリティクスの潜在的なユーザー層が広がり、さまざまな業界や分野での採用が増加します。従来のデータ分析手法では、広範なトレーニングや専門知識が必要とされることが多く、これらのツールを効果的に使用できる人の数が限られていました。オーグメンテッド・アナリティクスはスキルの障壁を低くし、さまざまなレベルの技術的専門知識を持つ専門家がデータ分析にアクセスできるようにします。つまり、組織内のより多くの人々が、大規模なトレーニングを受けることなく、データ分析に積極的に取り組めるようになり、その結果、導入プロセスがスピードアップします。データ分析の民主化は、組織内のデータ駆動型文化の発展を促します。さまざまなレベルの従業員がデータに簡単にアクセスして分析できるようになれば、それは意思決定プロセスに不可欠な要素となります。このような文化の変化は、より革新的で俊敏な組織を育みます。その結果、こうした要因が今後数年間の市場拡大に寄与すると思われます。
市場抑制要因
データ・プライバシーとセキュリティに対する懸念の高まり
欧州のGDPRやカリフォルニア州のCCPAなど、より厳格なデータプライバシー規制により、企業は厳格なデータ保護対策を遵守することが求められています。これらの規制を遵守するには、データの暗号化、安全な保管、法律相談への投資など、多額のコストがかかることが多いです。このため、これらのソリューションを導入するための全体的なコストが増大し、一部の組織では導入が敬遠されることもあります。データプライバシー対策の強化により、特に個人情報や機密情報が含まれる場合、拡張アナリティクスツールが特定のデータにアクセスして分析することが難しくなる可能性があります。この制限により、包括的なデータ分析が妨げられ、生成される潜在的な洞察が減少する可能性があります。組織は、コンプライアンスを確保するために、データアクセス、アクセス許可、暗号化を慎重に管理する必要があります。このような複雑さのため、これらのツールの導入とメンテナンスは困難な場合があります。こうした要因から、拡張アナリティクス市場は今後数年間で需要が減少する可能性があります。
企業タイプの展望
企業タイプに基づき、市場は大企業と中小企業に区分されます。2022年には、中小企業セグメントが市場で大きな収益シェアを獲得しました。これらのソリューションは、中小企業にとってますます手頃な価格で利用できるようになってきています。多くのベンダーがクラウドベースのサブスクリプションモデルを提供しているため、中小企業はハードウェアやソフトウェアに多額の先行投資をすることなく、高度な分析ツールにアクセスできます。この費用対効果の高さは、中小企業が拡張アナリティクスを導入する大きな動機となります。そのため、このセグメントは今後数年で急成長します。
エンドユーザーの展望
エンドユーザー別に見ると、市場はBFSI、IT&テレコム、政府、小売、ヘルスケア、製造、輸送&物流、エネルギー&ユーティリティ、その他に分けられます。BFSIセグメントは、2022年の市場において最大の収益シェアを記録しました。競争が激しくデータ中心の銀行・金融の世界では、データ主導の意思決定が不可欠です。BFSI部門では、リスク評価と管理が重視されています。拡張アナリティクスは、予測モデリングと潜在的リスクの特定を支援します。これにより、金融機関はより正確なリスクプロファイルを作成し、市場の変動に迅速に対応できるようになります。その結果、この分野での需要は増加すると思われます。
地域別展望
地域別に見ると、市場は北米、欧州、アジア太平洋、LAMEAに区分されます。北米セグメントは2022年の市場で最も高い収益シェアを獲得しました。同地域では、人工知能(AI)、機械学習、自然言語処理(NLP)などの先進技術の開発と導入が急増しています。同地域では、競争優位性を獲得し、十分な情報に基づいた意思決定を行う上で、データ分析が重要であることを理解しています。データ分析によりアクセスしやすく効率的な方法を提供するAIは、このような環境に自然に適合しています。このような側面から、北米セグメントでの需要増加が見込まれています。
目次
第1章 市場範囲と調査手法
- 市場の定義
- 目的
- 市場範囲
- セグメンテーション
- 調査手法
第2章 市場の概要
- 主なハイライト
第3章 市場概要
- イントロダクション
- 概要
- 市場構成とシナリオ
- 概要
- 市場に影響を与える主な要因
- 市場促進要因
- 市場抑制要因
第4章 競合分析- 世界
- KBV Cardinal Matrix
- 最近の業界全体の戦略的展開
- パートナーシップ、コラボレーション、および契約
- 製品の発売と製品の拡大
- 買収と合併
- 市場シェア分析2022年
- 主要成功戦略
- 主な戦略
- 主要な戦略的動き
- ポーターファイブフォース分析
第5章 世界の拡張アナリティクス市場:企業タイプ別
- 世界の大企業市場:地域別
- 世界の中小企業市場:地域別
第6章 世界の拡張アナリティクス市場:エンドユーザー別
- 世界のBFSI市場:地域別
- 世界のITおよびテレコム市場:地域別
- 世界の政府市場:地域別
- 世界の小売市場:地域別
- 世界のヘルスケア市場:地域別
- 世界の製造業市場:地域別
- 世界の輸送および物流市場:地域別
- 世界のエネルギーおよび公共事業市場:地域別
- 世界のその他の市場:地域別
第7章 世界の拡張アナリティクス市場:地域別
- 北米
- 欧州
- アジア太平洋
- ラテンアメリカ・中東・アフリカ
第8章 企業プロファイル
- QlikTech International AB
- MicroStrategy, Inc
- Salesforce, Inc
- IBM Corporation
- Microsoft Corporation
- Oracle Corporation
- Tibco Software, Inc(Vista Equity Partners)
- SAP SE
- SAS Institute, Inc
- Alteryx, Inc
第9章 市場の成功必須条件
LIST OF TABLES
- TABLE 1 Global Augmented Analytics Market, 2019 - 2022, USD Million
- TABLE 2 Global Augmented Analytics Market, 2023 - 2030, USD Million
- TABLE 3 Partnerships, Collaborations and Agreements- Augmented Analytics Market
- TABLE 4 Product Launches And Product Expansions- Augmented Analytics Market
- TABLE 5 Acquisition and Mergers- Augmented Analytics Market
- TABLE 6 Global Augmented Analytics Market, By Enterprise Type, 2019 - 2022, USD Million
- TABLE 7 Global Augmented Analytics Market, By Enterprise Type, 2023 - 2030, USD Million
- TABLE 8 Global Large Enterprises Market, By Region, 2019 - 2022, USD Million
- TABLE 9 Global Large Enterprises Market, By Region, 2023 - 2030, USD Million
- TABLE 10 Global Small & Medium Enterprises Market, By Region, 2019 - 2022, USD Million
- TABLE 11 Global Small & Medium Enterprises Market, By Region, 2023 - 2030, USD Million
- TABLE 12 Global Augmented Analytics Market, By End User, 2019 - 2022, USD Million
- TABLE 13 Global Augmented Analytics Market, By End User, 2023 - 2030, USD Million
- TABLE 14 Global BFSI Market, By Region, 2019 - 2022, USD Million
- TABLE 15 Global BFSI Market, By Region, 2023 - 2030, USD Million
- TABLE 16 Global IT & Telecom Market, By Region, 2019 - 2022, USD Million
- TABLE 17 Global IT & Telecom Market, By Region, 2023 - 2030, USD Million
- TABLE 18 Global Government Market, By Region, 2019 - 2022, USD Million
- TABLE 19 Global Government Market, By Region, 2023 - 2030, USD Million
- TABLE 20 Global Retail Market, By Region, 2019 - 2022, USD Million
- TABLE 21 Global Retail Market, By Region, 2023 - 2030, USD Million
- TABLE 22 Global Healthcare Market, By Region, 2019 - 2022, USD Million
- TABLE 23 Global Healthcare Market, By Region, 2023 - 2030, USD Million
- TABLE 24 Global Manufacturing Market, By Region, 2019 - 2022, USD Million
- TABLE 25 Global Manufacturing Market, By Region, 2023 - 2030, USD Million
- TABLE 26 Global Transport & Logistics Market, By Region, 2019 - 2022, USD Million
- TABLE 27 Global Transport & Logistics Market, By Region, 2023 - 2030, USD Million
- TABLE 28 Global Energy & Utility Market, By Region, 2019 - 2022, USD Million
- TABLE 29 Global Energy & Utility Market, By Region, 2023 - 2030, USD Million
- TABLE 30 Global Others Market, By Region, 2019 - 2022, USD Million
- TABLE 31 Global Others Market, By Region, 2023 - 2030, USD Million
- TABLE 32 Global Augmented Analytics Market, By Region, 2019 - 2022, USD Million
- TABLE 33 Global Augmented Analytics Market, By Region, 2023 - 2030, USD Million
- TABLE 34 North America Augmented Analytics Market, 2019 - 2022, USD Million
- TABLE 35 North America Augmented Analytics Market, 2023 - 2030, USD Million
- TABLE 36 North America Augmented Analytics Market, By Enterprise Type, 2019 - 2022, USD Million
- TABLE 37 North America Augmented Analytics Market, By Enterprise Type, 2023 - 2030, USD Million
- TABLE 38 North America Large Enterprises Market, By Country, 2019 - 2022, USD Million
- TABLE 39 North America Large Enterprises Market, By Country, 2023 - 2030, USD Million
- TABLE 40 North America Small & Medium Enterprises Market, By Country, 2019 - 2022, USD Million
- TABLE 41 North America Small & Medium Enterprises Market, By Country, 2023 - 2030, USD Million
- TABLE 42 North America Augmented Analytics Market, By End User, 2019 - 2022, USD Million
- TABLE 43 North America Augmented Analytics Market, By End User, 2023 - 2030, USD Million
- TABLE 44 North America BFSI Market, By Country, 2019 - 2022, USD Million
- TABLE 45 North America BFSI Market, By Country, 2023 - 2030, USD Million
- TABLE 46 North America IT & Telecom Market, By Country, 2019 - 2022, USD Million
- TABLE 47 North America IT & Telecom Market, By Country, 2023 - 2030, USD Million
- TABLE 48 North America Government Market, By Country, 2019 - 2022, USD Million
- TABLE 49 North America Government Market, By Country, 2023 - 2030, USD Million
- TABLE 50 North America Retail Market, By Country, 2019 - 2022, USD Million
- TABLE 51 North America Retail Market, By Country, 2023 - 2030, USD Million
- TABLE 52 North America Healthcare Market, By Country, 2019 - 2022, USD Million
- TABLE 53 North America Healthcare Market, By Country, 2023 - 2030, USD Million
- TABLE 54 North America Manufacturing Market, By Country, 2019 - 2022, USD Million
- TABLE 55 North America Manufacturing Market, By Country, 2023 - 2030, USD Million
- TABLE 56 North America Transport & Logistics Market, By Country, 2019 - 2022, USD Million
- TABLE 57 North America Transport & Logistics Market, By Country, 2023 - 2030, USD Million
- TABLE 58 North America Energy & Utility Market, By Country, 2019 - 2022, USD Million
- TABLE 59 North America Energy & Utility Market, By Country, 2023 - 2030, USD Million
- TABLE 60 North America Others Market, By Country, 2019 - 2022, USD Million
- TABLE 61 North America Others Market, By Country, 2023 - 2030, USD Million
- TABLE 62 North America Augmented Analytics Market, By Country, 2019 - 2022, USD Million
- TABLE 63 North America Augmented Analytics Market, By Country, 2023 - 2030, USD Million
- TABLE 64 US Augmented Analytics Market, 2019 - 2022, USD Million
- TABLE 65 US Augmented Analytics Market, 2023 - 2030, USD Million
- TABLE 66 US Augmented Analytics Market, By Enterprise Type, 2019 - 2022, USD Million
- TABLE 67 US Augmented Analytics Market, By Enterprise Type, 2023 - 2030, USD Million
- TABLE 68 US Augmented Analytics Market, By End User, 2019 - 2022, USD Million
- TABLE 69 US Augmented Analytics Market, By End User, 2023 - 2030, USD Million
- TABLE 70 Canada Augmented Analytics Market, 2019 - 2022, USD Million
- TABLE 71 Canada Augmented Analytics Market, 2023 - 2030, USD Million
- TABLE 72 Canada Augmented Analytics Market, By Enterprise Type, 2019 - 2022, USD Million
- TABLE 73 Canada Augmented Analytics Market, By Enterprise Type, 2023 - 2030, USD Million
- TABLE 74 Canada Augmented Analytics Market, By End User, 2019 - 2022, USD Million
- TABLE 75 Canada Augmented Analytics Market, By End User, 2023 - 2030, USD Million
- TABLE 76 Mexico Augmented Analytics Market, 2019 - 2022, USD Million
- TABLE 77 Mexico Augmented Analytics Market, 2023 - 2030, USD Million
- TABLE 78 Mexico Augmented Analytics Market, By Enterprise Type, 2019 - 2022, USD Million
- TABLE 79 Mexico Augmented Analytics Market, By Enterprise Type, 2023 - 2030, USD Million
- TABLE 80 Mexico Augmented Analytics Market, By End User, 2019 - 2022, USD Million
- TABLE 81 Mexico Augmented Analytics Market, By End User, 2023 - 2030, USD Million
- TABLE 82 Rest of North America Augmented Analytics Market, 2019 - 2022, USD Million
- TABLE 83 Rest of North America Augmented Analytics Market, 2023 - 2030, USD Million
- TABLE 84 Rest of North America Augmented Analytics Market, By Enterprise Type, 2019 - 2022, USD Million
- TABLE 85 Rest of North America Augmented Analytics Market, By Enterprise Type, 2023 - 2030, USD Million
- TABLE 86 Rest of North America Augmented Analytics Market, By End User, 2019 - 2022, USD Million
- TABLE 87 Rest of North America Augmented Analytics Market, By End User, 2023 - 2030, USD Million
- TABLE 88 Europe Augmented Analytics Market, 2019 - 2022, USD Million
- TABLE 89 Europe Augmented Analytics Market, 2023 - 2030, USD Million
- TABLE 90 Europe Augmented Analytics Market, By Enterprise Type, 2019 - 2022, USD Million
- TABLE 91 Europe Augmented Analytics Market, By Enterprise Type, 2023 - 2030, USD Million
- TABLE 92 Europe Large Enterprises Market, By Country, 2019 - 2022, USD Million
- TABLE 93 Europe Large Enterprises Market, By Country, 2023 - 2030, USD Million
- TABLE 94 Europe Small & Medium Enterprises Market, By Country, 2019 - 2022, USD Million
- TABLE 95 Europe Small & Medium Enterprises Market, By Country, 2023 - 2030, USD Million
- TABLE 96 Europe Augmented Analytics Market, By End User, 2019 - 2022, USD Million
- TABLE 97 Europe Augmented Analytics Market, By End User, 2023 - 2030, USD Million
- TABLE 98 Europe BFSI Market, By Country, 2019 - 2022, USD Million
- TABLE 99 Europe BFSI Market, By Country, 2023 - 2030, USD Million
- TABLE 100 Europe IT & Telecom Market, By Country, 2019 - 2022, USD Million
- TABLE 101 Europe IT & Telecom Market, By Country, 2023 - 2030, USD Million
- TABLE 102 Europe Government Market, By Country, 2019 - 2022, USD Million
- TABLE 103 Europe Government Market, By Country, 2023 - 2030, USD Million
- TABLE 104 Europe Retail Market, By Country, 2019 - 2022, USD Million
- TABLE 105 Europe Retail Market, By Country, 2023 - 2030, USD Million
- TABLE 106 Europe Healthcare Market, By Country, 2019 - 2022, USD Million
- TABLE 107 Europe Healthcare Market, By Country, 2023 - 2030, USD Million
- TABLE 108 Europe Manufacturing Market, By Country, 2019 - 2022, USD Million
- TABLE 109 Europe Manufacturing Market, By Country, 2023 - 2030, USD Million
- TABLE 110 Europe Transport & Logistics Market, By Country, 2019 - 2022, USD Million
- TABLE 111 Europe Transport & Logistics Market, By Country, 2023 - 2030, USD Million
- TABLE 112 Europe Energy & Utility Market, By Country, 2019 - 2022, USD Million
- TABLE 113 Europe Energy & Utility Market, By Country, 2023 - 2030, USD Million
- TABLE 114 Europe Others Market, By Country, 2019 - 2022, USD Million
- TABLE 115 Europe Others Market, By Country, 2023 - 2030, USD Million
- TABLE 116 Europe Augmented Analytics Market, By Country, 2019 - 2022, USD Million
- TABLE 117 Europe Augmented Analytics Market, By Country, 2023 - 2030, USD Million
- TABLE 118 Germany Augmented Analytics Market, 2019 - 2022, USD Million
- TABLE 119 Germany Augmented Analytics Market, 2023 - 2030, USD Million
- TABLE 120 Germany Augmented Analytics Market, By Enterprise Type, 2019 - 2022, USD Million
- TABLE 121 Germany Augmented Analytics Market, By Enterprise Type, 2023 - 2030, USD Million
- TABLE 122 Germany Augmented Analytics Market, By End User, 2019 - 2022, USD Million
- TABLE 123 Germany Augmented Analytics Market, By End User, 2023 - 2030, USD Million
- TABLE 124 UK Augmented Analytics Market, 2019 - 2022, USD Million
- TABLE 125 UK Augmented Analytics Market, 2023 - 2030, USD Million
- TABLE 126 UK Augmented Analytics Market, By Enterprise Type, 2019 - 2022, USD Million
- TABLE 127 UK Augmented Analytics Market, By Enterprise Type, 2023 - 2030, USD Million
- TABLE 128 UK Augmented Analytics Market, By End User, 2019 - 2022, USD Million
- TABLE 129 UK Augmented Analytics Market, By End User, 2023 - 2030, USD Million
- TABLE 130 France Augmented Analytics Market, 2019 - 2022, USD Million
- TABLE 131 France Augmented Analytics Market, 2023 - 2030, USD Million
- TABLE 132 France Augmented Analytics Market, By Enterprise Type, 2019 - 2022, USD Million
- TABLE 133 France Augmented Analytics Market, By Enterprise Type, 2023 - 2030, USD Million
- TABLE 134 France Augmented Analytics Market, By End User, 2019 - 2022, USD Million
- TABLE 135 France Augmented Analytics Market, By End User, 2023 - 2030, USD Million
- TABLE 136 Russia Augmented Analytics Market, 2019 - 2022, USD Million
- TABLE 137 Russia Augmented Analytics Market, 2023 - 2030, USD Million
- TABLE 138 Russia Augmented Analytics Market, By Enterprise Type, 2019 - 2022, USD Million
- TABLE 139 Russia Augmented Analytics Market, By Enterprise Type, 2023 - 2030, USD Million
- TABLE 140 Russia Augmented Analytics Market, By End User, 2019 - 2022, USD Million
- TABLE 141 Russia Augmented Analytics Market, By End User, 2023 - 2030, USD Million
- TABLE 142 Spain Augmented Analytics Market, 2019 - 2022, USD Million
- TABLE 143 Spain Augmented Analytics Market, 2023 - 2030, USD Million
- TABLE 144 Spain Augmented Analytics Market, By Enterprise Type, 2019 - 2022, USD Million
- TABLE 145 Spain Augmented Analytics Market, By Enterprise Type, 2023 - 2030, USD Million
- TABLE 146 Spain Augmented Analytics Market, By End User, 2019 - 2022, USD Million
- TABLE 147 Spain Augmented Analytics Market, By End User, 2023 - 2030, USD Million
- TABLE 148 Italy Augmented Analytics Market, 2019 - 2022, USD Million
- TABLE 149 Italy Augmented Analytics Market, 2023 - 2030, USD Million
- TABLE 150 Italy Augmented Analytics Market, By Enterprise Type, 2019 - 2022, USD Million
- TABLE 151 Italy Augmented Analytics Market, By Enterprise Type, 2023 - 2030, USD Million
- TABLE 152 Italy Augmented Analytics Market, By End User, 2019 - 2022, USD Million
- TABLE 153 Italy Augmented Analytics Market, By End User, 2023 - 2030, USD Million
- TABLE 154 Rest of Europe Augmented Analytics Market, 2019 - 2022, USD Million
- TABLE 155 Rest of Europe Augmented Analytics Market, 2023 - 2030, USD Million
- TABLE 156 Rest of Europe Augmented Analytics Market, By Enterprise Type, 2019 - 2022, USD Million
- TABLE 157 Rest of Europe Augmented Analytics Market, By Enterprise Type, 2023 - 2030, USD Million
- TABLE 158 Rest of Europe Augmented Analytics Market, By End User, 2019 - 2022, USD Million
- TABLE 159 Rest of Europe Augmented Analytics Market, By End User, 2023 - 2030, USD Million
- TABLE 160 Asia Pacific Augmented Analytics Market, 2019 - 2022, USD Million
- TABLE 161 Asia Pacific Augmented Analytics Market, 2023 - 2030, USD Million
- TABLE 162 Asia Pacific Augmented Analytics Market, By Enterprise Type, 2019 - 2022, USD Million
- TABLE 163 Asia Pacific Augmented Analytics Market, By Enterprise Type, 2023 - 2030, USD Million
- TABLE 164 Asia Pacific Large Enterprises Market, By Country, 2019 - 2022, USD Million
- TABLE 165 Asia Pacific Large Enterprises Market, By Country, 2023 - 2030, USD Million
- TABLE 166 Asia Pacific Small & Medium Enterprises Market, By Country, 2019 - 2022, USD Million
- TABLE 167 Asia Pacific Small & Medium Enterprises Market, By Country, 2023 - 2030, USD Million
- TABLE 168 Asia Pacific Augmented Analytics Market, By End User, 2019 - 2022, USD Million
- TABLE 169 Asia Pacific Augmented Analytics Market, By End User, 2023 - 2030, USD Million
- TABLE 170 Asia Pacific BFSI Market, By Country, 2019 - 2022, USD Million
- TABLE 171 Asia Pacific BFSI Market, By Country, 2023 - 2030, USD Million
- TABLE 172 Asia Pacific IT & Telecom Market, By Country, 2019 - 2022, USD Million
- TABLE 173 Asia Pacific IT & Telecom Market, By Country, 2023 - 2030, USD Million
- TABLE 174 Asia Pacific Government Market, By Country, 2019 - 2022, USD Million
- TABLE 175 Asia Pacific Government Market, By Country, 2023 - 2030, USD Million
- TABLE 176 Asia Pacific Retail Market, By Country, 2019 - 2022, USD Million
- TABLE 177 Asia Pacific Retail Market, By Country, 2023 - 2030, USD Million
- TABLE 178 Asia Pacific Healthcare Market, By Country, 2019 - 2022, USD Million
- TABLE 179 Asia Pacific Healthcare Market, By Country, 2023 - 2030, USD Million
- TABLE 180 Asia Pacific Manufacturing Market, By Country, 2019 - 2022, USD Million
- TABLE 181 Asia Pacific Manufacturing Market, By Country, 2023 - 2030, USD Million
- TABLE 182 Asia Pacific Transport & Logistics Market, By Country, 2019 - 2022, USD Million
- TABLE 183 Asia Pacific Transport & Logistics Market, By Country, 2023 - 2030, USD Million
- TABLE 184 Asia Pacific Energy & Utility Market, By Country, 2019 - 2022, USD Million
- TABLE 185 Asia Pacific Energy & Utility Market, By Country, 2023 - 2030, USD Million
- TABLE 186 Asia Pacific Others Market, By Country, 2019 - 2022, USD Million
- TABLE 187 Asia Pacific Others Market, By Country, 2023 - 2030, USD Million
- TABLE 188 Asia Pacific Augmented Analytics Market, By Country, 2019 - 2022, USD Million
- TABLE 189 Asia Pacific Augmented Analytics Market, By Country, 2023 - 2030, USD Million
- TABLE 190 China Augmented Analytics Market, 2019 - 2022, USD Million
- TABLE 191 China Augmented Analytics Market, 2023 - 2030, USD Million
- TABLE 192 China Augmented Analytics Market, By Enterprise Type, 2019 - 2022, USD Million
- TABLE 193 China Augmented Analytics Market, By Enterprise Type, 2023 - 2030, USD Million
- TABLE 194 China Augmented Analytics Market, By End User, 2019 - 2022, USD Million
- TABLE 195 China Augmented Analytics Market, By End User, 2023 - 2030, USD Million
- TABLE 196 Japan Augmented Analytics Market, 2019 - 2022, USD Million
- TABLE 197 Japan Augmented Analytics Market, 2023 - 2030, USD Million
- TABLE 198 Japan Augmented Analytics Market, By Enterprise Type, 2019 - 2022, USD Million
- TABLE 199 Japan Augmented Analytics Market, By Enterprise Type, 2023 - 2030, USD Million
- TABLE 200 Japan Augmented Analytics Market, By End User, 2019 - 2022, USD Million
- TABLE 201 Japan Augmented Analytics Market, By End User, 2023 - 2030, USD Million
- TABLE 202 India Augmented Analytics Market, 2019 - 2022, USD Million
- TABLE 203 India Augmented Analytics Market, 2023 - 2030, USD Million
- TABLE 204 India Augmented Analytics Market, By Enterprise Type, 2019 - 2022, USD Million
- TABLE 205 India Augmented Analytics Market, By Enterprise Type, 2023 - 2030, USD Million
- TABLE 206 India Augmented Analytics Market, By End User, 2019 - 2022, USD Million
- TABLE 207 India Augmented Analytics Market, By End User, 2023 - 2030, USD Million
- TABLE 208 South Korea Augmented Analytics Market, 2019 - 2022, USD Million
- TABLE 209 South Korea Augmented Analytics Market, 2023 - 2030, USD Million
- TABLE 210 South Korea Augmented Analytics Market, By Enterprise Type, 2019 - 2022, USD Million
- TABLE 211 South Korea Augmented Analytics Market, By Enterprise Type, 2023 - 2030, USD Million
- TABLE 212 South Korea Augmented Analytics Market, By End User, 2019 - 2022, USD Million
- TABLE 213 South Korea Augmented Analytics Market, By End User, 2023 - 2030, USD Million
- TABLE 214 Singapore Augmented Analytics Market, 2019 - 2022, USD Million
- TABLE 215 Singapore Augmented Analytics Market, 2023 - 2030, USD Million
- TABLE 216 Singapore Augmented Analytics Market, By Enterprise Type, 2019 - 2022, USD Million
- TABLE 217 Singapore Augmented Analytics Market, By Enterprise Type, 2023 - 2030, USD Million
- TABLE 218 Singapore Augmented Analytics Market, By End User, 2019 - 2022, USD Million
- TABLE 219 Singapore Augmented Analytics Market, By End User, 2023 - 2030, USD Million
- TABLE 220 Malaysia Augmented Analytics Market, 2019 - 2022, USD Million
- TABLE 221 Malaysia Augmented Analytics Market, 2023 - 2030, USD Million
- TABLE 222 Malaysia Augmented Analytics Market, By Enterprise Type, 2019 - 2022, USD Million
- TABLE 223 Malaysia Augmented Analytics Market, By Enterprise Type, 2023 - 2030, USD Million
- TABLE 224 Malaysia Augmented Analytics Market, By End User, 2019 - 2022, USD Million
- TABLE 225 Malaysia Augmented Analytics Market, By End User, 2023 - 2030, USD Million
- TABLE 226 Rest of Asia Pacific Augmented Analytics Market, 2019 - 2022, USD Million
- TABLE 227 Rest of Asia Pacific Augmented Analytics Market, 2023 - 2030, USD Million
- TABLE 228 Rest of Asia Pacific Augmented Analytics Market, By Enterprise Type, 2019 - 2022, USD Million
- TABLE 229 Rest of Asia Pacific Augmented Analytics Market, By Enterprise Type, 2023 - 2030, USD Million
- TABLE 230 Rest of Asia Pacific Augmented Analytics Market, By End User, 2019 - 2022, USD Million
- TABLE 231 Rest of Asia Pacific Augmented Analytics Market, By End User, 2023 - 2030, USD Million
- TABLE 232 LAMEA Augmented Analytics Market, 2019 - 2022, USD Million
- TABLE 233 LAMEA Augmented Analytics Market, 2023 - 2030, USD Million
- TABLE 234 LAMEA Augmented Analytics Market, By Enterprise Type, 2019 - 2022, USD Million
- TABLE 235 LAMEA Augmented Analytics Market, By Enterprise Type, 2023 - 2030, USD Million
- TABLE 236 LAMEA Large Enterprises Market, By Country, 2019 - 2022, USD Million
- TABLE 237 LAMEA Large Enterprises Market, By Country, 2023 - 2030, USD Million
- TABLE 238 LAMEA Small & Medium Enterprises Market, By Country, 2019 - 2022, USD Million
- TABLE 239 LAMEA Small & Medium Enterprises Market, By Country, 2023 - 2030, USD Million
- TABLE 240 LAMEA Augmented Analytics Market, By End User, 2019 - 2022, USD Million
- TABLE 241 LAMEA Augmented Analytics Market, By End User, 2023 - 2030, USD Million
- TABLE 242 LAMEA BFSI Market, By Country, 2019 - 2022, USD Million
- TABLE 243 LAMEA BFSI Market, By Country, 2023 - 2030, USD Million
- TABLE 244 LAMEA IT & Telecom Market, By Country, 2019 - 2022, USD Million
- TABLE 245 LAMEA IT & Telecom Market, By Country, 2023 - 2030, USD Million
- TABLE 246 LAMEA Government Market, By Country, 2019 - 2022, USD Million
- TABLE 247 LAMEA Government Market, By Country, 2023 - 2030, USD Million
- TABLE 248 LAMEA Retail Market, By Country, 2019 - 2022, USD Million
- TABLE 249 LAMEA Retail Market, By Country, 2023 - 2030, USD Million
- TABLE 250 LAMEA Healthcare Market, By Country, 2019 - 2022, USD Million
- TABLE 251 LAMEA Healthcare Market, By Country, 2023 - 2030, USD Million
- TABLE 252 LAMEA Manufacturing Market, By Country, 2019 - 2022, USD Million
- TABLE 253 LAMEA Manufacturing Market, By Country, 2023 - 2030, USD Million
- TABLE 254 LAMEA Transport & Logistics Market, By Country, 2019 - 2022, USD Million
- TABLE 255 LAMEA Transport & Logistics Market, By Country, 2023 - 2030, USD Million
- TABLE 256 LAMEA Energy & Utility Market, By Country, 2019 - 2022, USD Million
- TABLE 257 LAMEA Energy & Utility Market, By Country, 2023 - 2030, USD Million
- TABLE 258 LAMEA Others Market, By Country, 2019 - 2022, USD Million
- TABLE 259 LAMEA Others Market, By Country, 2023 - 2030, USD Million
- TABLE 260 LAMEA Augmented Analytics Market, By Country, 2019 - 2022, USD Million
- TABLE 261 LAMEA Augmented Analytics Market, By Country, 2023 - 2030, USD Million
- TABLE 262 Brazil Augmented Analytics Market, 2019 - 2022, USD Million
- TABLE 263 Brazil Augmented Analytics Market, 2023 - 2030, USD Million
- TABLE 264 Brazil Augmented Analytics Market, By Enterprise Type, 2019 - 2022, USD Million
- TABLE 265 Brazil Augmented Analytics Market, By Enterprise Type, 2023 - 2030, USD Million
- TABLE 266 Brazil Augmented Analytics Market, By End User, 2019 - 2022, USD Million
- TABLE 267 Brazil Augmented Analytics Market, By End User, 2023 - 2030, USD Million
- TABLE 268 Argentina Augmented Analytics Market, 2019 - 2022, USD Million
- TABLE 269 Argentina Augmented Analytics Market, 2023 - 2030, USD Million
- TABLE 270 Argentina Augmented Analytics Market, By Enterprise Type, 2019 - 2022, USD Million
- TABLE 271 Argentina Augmented Analytics Market, By Enterprise Type, 2023 - 2030, USD Million
- TABLE 272 Argentina Augmented Analytics Market, By End User, 2019 - 2022, USD Million
- TABLE 273 Argentina Augmented Analytics Market, By End User, 2023 - 2030, USD Million
- TABLE 274 UAE Augmented Analytics Market, 2019 - 2022, USD Million
- TABLE 275 UAE Augmented Analytics Market, 2023 - 2030, USD Million
- TABLE 276 UAE Augmented Analytics Market, By Enterprise Type, 2019 - 2022, USD Million
- TABLE 277 UAE Augmented Analytics Market, By Enterprise Type, 2023 - 2030, USD Million
- TABLE 278 UAE Augmented Analytics Market, By End User, 2019 - 2022, USD Million
- TABLE 279 UAE Augmented Analytics Market, By End User, 2023 - 2030, USD Million
- TABLE 280 Saudi Arabia Augmented Analytics Market, 2019 - 2022, USD Million
- TABLE 281 Saudi Arabia Augmented Analytics Market, 2023 - 2030, USD Million
- TABLE 282 Saudi Arabia Augmented Analytics Market, By Enterprise Type, 2019 - 2022, USD Million
- TABLE 283 Saudi Arabia Augmented Analytics Market, By Enterprise Type, 2023 - 2030, USD Million
- TABLE 284 Saudi Arabia Augmented Analytics Market, By End User, 2019 - 2022, USD Million
- TABLE 285 Saudi Arabia Augmented Analytics Market, By End User, 2023 - 2030, USD Million
- TABLE 286 South Africa Augmented Analytics Market, 2019 - 2022, USD Million
- TABLE 287 South Africa Augmented Analytics Market, 2023 - 2030, USD Million
- TABLE 288 South Africa Augmented Analytics Market, By Enterprise Type, 2019 - 2022, USD Million
- TABLE 289 South Africa Augmented Analytics Market, By Enterprise Type, 2023 - 2030, USD Million
- TABLE 290 South Africa Augmented Analytics Market, By End User, 2019 - 2022, USD Million
- TABLE 291 South Africa Augmented Analytics Market, By End User, 2023 - 2030, USD Million
- TABLE 292 Nigeria Augmented Analytics Market, 2019 - 2022, USD Million
- TABLE 293 Nigeria Augmented Analytics Market, 2023 - 2030, USD Million
- TABLE 294 Nigeria Augmented Analytics Market, By Enterprise Type, 2019 - 2022, USD Million
- TABLE 295 Nigeria Augmented Analytics Market, By Enterprise Type, 2023 - 2030, USD Million
- TABLE 296 Nigeria Augmented Analytics Market, By End User, 2019 - 2022, USD Million
- TABLE 297 Nigeria Augmented Analytics Market, By End User, 2023 - 2030, USD Million
- TABLE 298 Rest of LAMEA Augmented Analytics Market, 2019 - 2022, USD Million
- TABLE 299 Rest of LAMEA Augmented Analytics Market, 2023 - 2030, USD Million
- TABLE 300 Rest of LAMEA Augmented Analytics Market, By Enterprise Type, 2019 - 2022, USD Million
- TABLE 301 Rest of LAMEA Augmented Analytics Market, By Enterprise Type, 2023 - 2030, USD Million
- TABLE 302 Rest of LAMEA Augmented Analytics Market, By End User, 2019 - 2022, USD Million
- TABLE 303 Rest of LAMEA Augmented Analytics Market, By End User, 2023 - 2030, USD Million
- TABLE 304 Key Information - QlikTech International AB
- TABLE 305 Key Information - MicroStrategy, Inc.
- TABLE 306 Key Information - Salesforce, Inc.
- TABLE 307 Key Information - IBM Corporation
- TABLE 308 Key Information - Microsoft Corporation
- TABLE 309 Key Information - Oracle Corporation
- TABLE 310 Key Information - Tibco Software, Inc.
- TABLE 311 Key Information - SAP SE
- TABLE 312 Key Information - SAS Institute, Inc.
- TABLE 313 Key Information - Alteryx, Inc.
The Global Augmented Analytics Market size is expected to reach $70.2 billion by 2030, rising at a market growth of 22.3% CAGR during the forecast period.
Businesses in the retail sector must comprehend consumer behavior and preferences. Augmented analytics helps retailers make data-driven decisions that improve efficiency and reduce operational costs. Consequently, the retail segment captured $2,248.3 in the market in 2022. Retailers are leveraging augmented analytics to gain deeper insights into their operations. They use data analysis to optimize inventory management, supply chain processes, and pricing strategies. Augmented analytics tools enable retailers to analyze large volumes of customer data, such as purchase history, online behavior, and feedback. This analysis helps retailers personalize marketing efforts and enhance the customer experience.
The major strategies followed by the market participants are Partnerships as the key developmental strategy to keep pace with the changing demands of end users. For instance, In October, 2023, MicroStrategy, Inc. partnered with Microsoft, to integrate its advanced analytics capabilities Microsoft's with Azure OpenAI Service. The partnership aids MicroStrategy in strengthening its analytics platform, MicroStrategy ONE. However, In August, 2023, IBM Corporation partnered with Salesforce, an American software company, to aid businesses worldwide in AI integration into their CRM systems.
Based on the Analysis presented in the KBV Cardinal matrix; Microsoft Corporation is the forerunner in the Market. Companies such as Oracle Corporation, SAP SE, IBM Corporation are some of the key innovators in the Market. For Instance, In June, 2023, Salesforce, Inc. came into partnership with Google Cloud, a cloud platform offered by Google. The two companies aimed to facilitate businesses in enhancing their CRM systems by including data and AI tools in them.
Market Growth Factors
Rising Demand Due to Digital Transformation Across Industries
Countless amounts of data are being gathered and stored by enterprises as part of digital transformation activities. They require advanced analytics tools to extract meaningful insights and drive informed decisions. With its automation and predictive capabilities, it helps organizations leverage this data effectively. Digital transformation often focuses on improving the customer experience. It plays a crucial role in this by analyzing customer data to understand preferences and behaviors. This enables organizations to provide more personalized and tailored experiences central to digital transformation efforts. Digital transformation often involves adopting cloud technologies and expanding digital infrastructures. This enhances the requirement for strong data security and adherence to laws like GDPR and HIPAA. These tools offer advanced security features to protect sensitive data and ensure regulatory compliance. Therefore, these factors will drive the demand for these analytics in the coming years.
User-Friendly Nature of Augmented Analytics Solutions
The user-friendly nature of these tools means that a broader range of professionals, beyond data scientists and analysts, can use these tools. This widens the potential user base for augmented analytics, increasing its adoption across various industries and sectors. Traditional data analysis methods often required extensive training and expertise, limiting the number of individuals who could effectively use these tools. It lowers the skill barriers, making data analysis accessible to professionals with varying levels of technical expertise. This means that more people within an organization can actively engage in data analysis without undergoing extensive training, thus speeding up the adoption process. The democratization of data analysis encourages the development of a data-driven culture within organizations. When employees at various levels can easily access and analyze data, it becomes an integral part of their decision-making processes. This cultural shift fosters a more innovative and agile organization. As a result, these factors will help in the expansion of the market in the coming years.
Market Restraining Factors
Rising Concerns Over Data Privacy and Security
Stricter data privacy regulations, such as GDPR in Europe and CCPA in California, require organizations to adhere to stringent data protection measures. Complying with these regulations often entails significant costs, including investments in data encryption, secure storage, and legal consultation. This can increase the overall cost of implementing these solutions, discouraging some organizations from adopting them. Enhanced data privacy measures can make it more challenging for augmented analytics tools to access and analyze certain data, especially when it contains personal or sensitive information. This limitation can hinder the comprehensive data analysis, reducing the potential insights generated. Organizations must carefully manage data access, permissions, and encryption to ensure compliance. Due to this complexity, the implementation and maintenance of these tools may be difficult. Owing to these factors, the augmented analytics market can witness decreased demand in the upcoming years.
Enterprise Type Outlook
Based on enterprise type, the market is segmented into large enterprises and small & medium enterprises. In 2022, the small and medium enterprises segment garnered a significant revenue share in the market. These solutions are becoming increasingly affordable and accessible to SMEs. Many vendors offer cloud-based, subscription-based models, allowing SMEs to access advanced analytics tools without substantial upfront investments in hardware or software. This cost-effectiveness is a significant incentive for SMEs to adopt augmented analytics. Therefore, the segment will grow rapidly in the upcoming years.
End User Outlook
On the basis of end user, the market is divided into BFSI, IT & telecom, government, retail, healthcare, manufacturing, transport & logistics, energy & utility, and others. The BFSI segment recorded the maximum revenue share in the market in 2022. In the highly competitive and data-centric world of banking and finance, data-driven decision-making is imperative. The BFSI sector places a strong emphasis on risk assessment and management. Augmented analytics aids in predictive modeling and the identification of potential risks. It enables financial institutions to create more accurate risk profiles and react swiftly to market fluctuations. As a result, there will be increased demand in the segment.
Regional Outlook
By region, the market is segmented into North America, Europe, Asia Pacific, and LAMEA. The North America segment procured the highest revenue share in the market in 2022. The region has seen a surge in developing and adopting advanced technologies, including artificial intelligence (AI), machine learning, and natural language processing (NLP). They understand the importance of data analysis in gaining a competitive edge and making informed decisions. It offers a more accessible and efficient way to analyze data, making it a natural fit for this environment. These aspects are expected to increase the demand in the North America segment.
The market research report covers the analysis of key stake holders of the market. Key companies profiled in the report include QlikTech International AB, Salesforce Inc., IBM Corporation, Microsoft Corporation, Oracle Corporation, TIBCO Software Inc., SAP SE, SAS Institute Inc., MicroStrategy, Inc. and Alteryx, Inc.
Recent Strategies Deployed in Augmented Analytics Market
Partnerships, Collaborations & Agreements:
Oct-2023: MicroStrategy, Inc. partnered with Microsoft, an American technology company, to integrate its advanced analytics capabilities Microsoft's with Azure OpenAI Service. The partnership aids MicroStrategy in strengthening its analytics platform, MicroStrategy ONE.
Aug-2023: IBM Corporation partnered with Salesforce, an American software company, to aid businesses worldwide in AI integration into their CRM systems. The partnership would help the joint customers of the companies to meet their business needs using the power of generative AI.
Jun-2023: Salesforce, Inc. came into partnership with Google Cloud, a cloud platform offered by Google. The two companies aimed to facilitate businesses in enhancing their CRM systems by including data and AI tools in them.
May-2023: SAP SE entered a partnership with Accenture, an Irish IT company, to develop business models based on the SAP Business Technology Platform (SAP BTP). The models developed as a result of this partnership would aid their customers to streamline and improve their business operations.
May-2023: SAP SE signed a partnership with Google Cloud, a cloud platform offered by Google, to integrate Google Cloud's Data and Analytics Technology with SAP's portfolio. The partnership enables SAP to serve its customers in a better way by providing them with a portfolio that would simplify the data landscapes, perform advanced analysis, and provide quick access to important business-related data.
Jul-2021: IBM Corporation partnered with SAP SE, a German software company, to facilitate the IBM cloud adoption in the financial services industry by integrating IBM cloud with SAP's portfolio of finance and data management solutions. The partnership aids IBM in serving its customers in a better way by helping them increase operational efficiencies through the use of the cloud.
Jun-2021: Salesforce, Inc. signed a partnership with Amazon Web Services, Inc., a subsidiary of Amazon, to provide customers with digital transformation solutions. The companies aimed to achieve the objective by unifying their respective offerings.
May-2021: SAP extended its partnership with Team Liquid, a leading worldwide professional esports organization. By using the power of SAP HANA, predictive & and machine learning functionalities, and the SAP Business Technology Platform, Team Liquid would more rapidly and efficiently evaluate opponents' approaches.
Jan-2021: SAS extended its 40-year partnership with the US Food and Drug Administration (FDA). Under this expansion, SAS aimed to expand its capabilities in natural language processing, AI, and ML capabilities via the SAS Viya platform with the support of the FDA's mission as an important public health agency. This partnership would help FDA to advance CDER's initiative to modernize drug regulatory programs, better meet the centre's mission, and offer analytically driven drug manufacturing facility surveillance via other core initiatives.
Product Launches and Product Expansions:
Oct-2023: MicroStrategy, Inc. released MicroStrategy AI, a tool that facilitates users to smoothly integrate generative AI into their data applications. The capabilities of the tool include Auto Answers, Auto Dashboard., Auto SQL, and Auto Expert.
Sep-2023: Oracle Corporation released new AI-powered capabilities for its Oracle Analytics Cloud. The new features utilize Oracle Cloud Infrastructure (OCI) Generative AI service to aid analytics self-service users in conducting sophisticated analysis in a quicker way. The new capabilities include Generative AI Data Interactions, AI-Powered Document Understanding, Contextual Insights, and Collaboration Software Integrations.
Sep-2023: Oracle Corporation released Fusion Data Intelligence Platform, an AI-powered business tool for providing 360-degree data models and enhanced interactive analytics. The tool combines data-driven insights with intelligent decisions and actions for delivering better business outcomes.
Jun-2023: QlikTech International AB released Qlik OpenAI Analytics Connector, a suite of OpenAI connectors that helps users to bring Generative AI content into Qlik that would facilitate a wide variety of cloud analytics. Using the product, Users would be able to integrate powerful natural language insights directly from OpenAI into analytics apps and conduct direct queries of ChatGPT augmented with data from Qlik.
May-2023: Microsoft Corporation unveiled Microsoft Fabric, an end-to-end, unified analytics platform that aids organizations with all the data and analytics tools they need. The fabric features seven workloads namely, Data Factory, Synapse Data Engineering, Synapse Data Science, Synapse Data Warehousing, Synapse Real-Time Analytics, Power BI, and Data Activator.
Mar-2023: Salesforce, Inc. unveiled Einstein GPT. The Einstein GPT is an AI-powered CRM technology used for delivering AI-created content at a hyper-scale across different interactions. The Einstein GPT features Salesforce's unique AI models and compatibility with Salesforce Data Cloud.
Feb-2023: Alteryx, Inc. announced new features for the Alteryx Analytics Cloud Platform. The new features include the Alteryx Designer Cloud interface, Reporting functionality, and Alteryx Metrics Store.
Nov-2022: IBM Corporation announced the launch of IBM Business Analytics Enterprise. The Business Analytics Enterprise is a collection of business intelligence services used for planning, forecasting, and reporting for a business. The Business Analytics Enterprise features IBM Analytics Content Hub that provides analytics and planning dashboards, it features algorithms used for advising role-based content for assistance in decision making.
Mergers & Acquisition:
May-2023: IBM Corporation announced the acquisition of Polar Security, an Israeli software company. The acquisition enhances IBM's Security Guardium platform.
Feb-2022: Alteryx, Inc. took over Trifacta, a software company headquartered in the United States. The acquisition makes Alteryx a special provider of a comprehensive offering of end-to-end automated analytics solutions.
Sep-2021: QlikTech International AB acquired Big Squid, a provider of no-code automated machine learning (AutoML). The acquisition allows QlikTech to provide the industry's most robust augmented analytics capabilities suite for cloud analytics and reinforces its vision of Active Intelligence.
Jan-2021: Tibco Software, Inc. announced the acquisition of Information Builders, Inc., a data analytics solutions provider. The acquisition enhances TIBCO's offerings by adding Information Builders' data analytics and management capabilities to TIBCO's Connected Intelligence platform.
Jan-2021: SAS acquired Boemska, a privately held technology company. This acquisition aimed to improve SAS Viya, a cloud-native, advanced analytics platform, with enriching capabilities that accelerate SAS' objective of supporting the whole analytics life cycle and facilitating customer transformation to the cloud.
Scope of the Study
Market Segments covered in the Report:
By Enterprise Type
- Large Enterprises
- Small & Medium Enterprises
By End User
- BFSI
- IT & Telecom
- Government
- Retail
- Healthcare
- Manufacturing
- Transport & Logistics
- Energy & Utility
- Others
By Geography
- North America
- US
- Canada
- Mexico
- Rest of North America
- Europe
- Germany
- UK
- France
- Russia
- Spain
- Italy
- Rest of Europe
- Asia Pacific
- China
- Japan
- India
- South Korea
- Singapore
- Malaysia
- Rest of Asia Pacific
- LAMEA
- Brazil
- Argentina
- UAE
- Saudi Arabia
- South Africa
- Nigeria
- Rest of LAMEA
Companies Profiled
- QlikTech International AB
- Salesforce Inc.
- IBM Corporation
- Microsoft Corporation
- Oracle Corporation
- TIBCO Software Inc.
- SAP SE
- SAS Institute Inc.
- MicroStrategy, Inc.
- Alteryx, Inc.
Unique Offerings from KBV Research
- Exhaustive coverage
- Highest number of market tables and figures
- Subscription based model available
- Guaranteed best price
- Assured post sales research support with 10% customization free
Table of Contents
Chapter 1. Market Scope & Methodology
- 1.1 Market Definition
- 1.2 Objectives
- 1.3 Market Scope
- 1.4 Segmentation
- 1.4.1 Global Augmented Analytics Market, by Enterprise Type
- 1.4.2 Global Augmented Analytics Market, by End User
- 1.4.3 Global Augmented Analytics Market, by Geography
- 1.5 Methodology for the research
Chapter 2. Market at a Glance
- 2.1 Key Highlights
Chapter 3. Market Overview
- 3.1 Introduction
- 3.1.1 Overview
- 3.1.1.1 Market Composition and Scenario
- 3.1.1 Overview
- 3.2 Key Factors Impacting the Market
- 3.2.1 Market Drivers
- 3.2.2 Market Restraints
Chapter 4. Competition Analysis - Global
- 4.1 KBV Cardinal Matrix
- 4.2 Recent Industry Wide Strategic Developments
- 4.2.1 Partnerships, Collaborations and Agreements
- 4.2.2 Product Launches and Product Expansions
- 4.2.3 Acquisition and Mergers
- 4.3 Market Share Analysis, 2022
- 4.4 Top Winning Strategies
- 4.4.1 Key Leading Strategies: Percentage Distribution (2019-2023)
- 4.4.2 Key Strategic Move: (Partnerships, Collaborations & Agreements: 2020, Jun - 2023, Oct) Leading Players
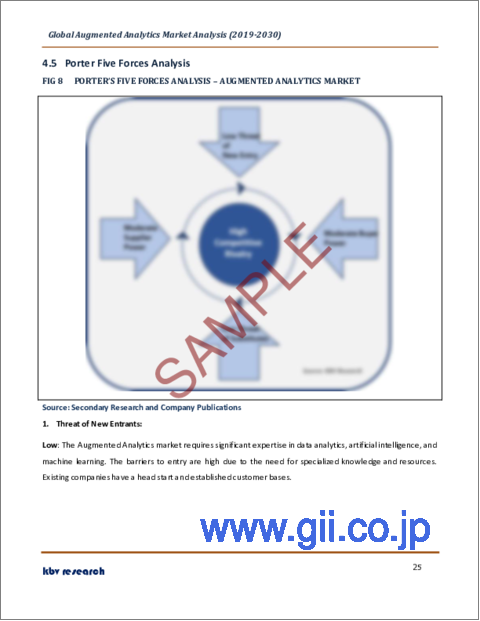
- 4.5 Porter Five Forces Analysis
Chapter 5. Global Augmented Analytics Market, By Enterprise Type
- 5.1 Global Large Enterprises Market, By Region
- 5.2 Global Small & Medium Enterprises Market, By Region
Chapter 6. Global Augmented Analytics Market, By End User
- 6.1 Global BFSI Market, By Region
- 6.2 Global IT & Telecom Market, By Region
- 6.3 Global Government Market, By Region
- 6.4 Global Retail Market, By Region
- 6.5 Global Healthcare Market, By Region
- 6.6 Global Manufacturing Market, By Region
- 6.7 Global Transport & Logistics Market, By Region
- 6.8 Global Energy & Utility Market, By Region
- 6.9 Global Others Market, By Region
Chapter 7. Global Augmented Analytics Market, By Region
- 7.1 North America Augmented Analytics Market
- 7.1.1 North America Augmented Analytics Market, By Enterprise Type
- 7.1.1.1 North America Large Enterprises Market, By Country
- 7.1.1.2 North America Small & Medium Enterprises Market, By Country
- 7.1.2 North America Augmented Analytics Market, By End User
- 7.1.2.1 North America BFSI Market, By Country
- 7.1.2.2 North America IT & Telecom Market, By Country
- 7.1.2.3 North America Government Market, By Country
- 7.1.2.4 North America Retail Market, By Country
- 7.1.2.5 North America Healthcare Market, By Country
- 7.1.2.6 North America Manufacturing Market, By Country
- 7.1.2.7 North America Transport & Logistics Market, By Country
- 7.1.2.8 North America Energy & Utility Market, By Country
- 7.1.2.9 North America Others Market, By Country
- 7.1.3 North America Augmented Analytics Market, By Country
- 7.1.3.1 US Augmented Analytics Market
- 7.1.3.1.1 US Augmented Analytics Market, By Enterprise Type
- 7.1.3.1.2 US Augmented Analytics Market, By End User
- 7.1.3.2 Canada Augmented Analytics Market
- 7.1.3.2.1 Canada Augmented Analytics Market, By Enterprise Type
- 7.1.3.2.2 Canada Augmented Analytics Market, By End User
- 7.1.3.3 Mexico Augmented Analytics Market
- 7.1.3.3.1 Mexico Augmented Analytics Market, By Enterprise Type
- 7.1.3.3.2 Mexico Augmented Analytics Market, By End User
- 7.1.3.4 Rest of North America Augmented Analytics Market
- 7.1.3.4.1 Rest of North America Augmented Analytics Market, By Enterprise Type
- 7.1.3.4.2 Rest of North America Augmented Analytics Market, By End User
- 7.1.3.1 US Augmented Analytics Market
- 7.1.1 North America Augmented Analytics Market, By Enterprise Type
- 7.2 Europe Augmented Analytics Market
- 7.2.1 Europe Augmented Analytics Market, By Enterprise Type
- 7.2.1.1 Europe Large Enterprises Market, By Country
- 7.2.1.2 Europe Small & Medium Enterprises Market, By Country
- 7.2.2 Europe Augmented Analytics Market, By End User
- 7.2.2.1 Europe BFSI Market, By Country
- 7.2.2.2 Europe IT & Telecom Market, By Country
- 7.2.2.3 Europe Government Market, By Country
- 7.2.2.4 Europe Retail Market, By Country
- 7.2.2.5 Europe Healthcare Market, By Country
- 7.2.2.6 Europe Manufacturing Market, By Country
- 7.2.2.7 Europe Transport & Logistics Market, By Country
- 7.2.2.8 Europe Energy & Utility Market, By Country
- 7.2.2.9 Europe Others Market, By Country
- 7.2.3 Europe Augmented Analytics Market, By Country
- 7.2.3.1 Germany Augmented Analytics Market
- 7.2.3.1.1 Germany Augmented Analytics Market, By Enterprise Type
- 7.2.3.1.2 Germany Augmented Analytics Market, By End User
- 7.2.3.2 UK Augmented Analytics Market
- 7.2.3.2.1 UK Augmented Analytics Market, By Enterprise Type
- 7.2.3.2.2 UK Augmented Analytics Market, By End User
- 7.2.3.3 France Augmented Analytics Market
- 7.2.3.3.1 France Augmented Analytics Market, By Enterprise Type
- 7.2.3.3.2 France Augmented Analytics Market, By End User
- 7.2.3.4 Russia Augmented Analytics Market
- 7.2.3.4.1 Russia Augmented Analytics Market, By Enterprise Type
- 7.2.3.4.2 Russia Augmented Analytics Market, By End User
- 7.2.3.5 Spain Augmented Analytics Market
- 7.2.3.5.1 Spain Augmented Analytics Market, By Enterprise Type
- 7.2.3.5.2 Spain Augmented Analytics Market, By End User
- 7.2.3.6 Italy Augmented Analytics Market
- 7.2.3.6.1 Italy Augmented Analytics Market, By Enterprise Type
- 7.2.3.6.2 Italy Augmented Analytics Market, By End User
- 7.2.3.7 Rest of Europe Augmented Analytics Market
- 7.2.3.7.1 Rest of Europe Augmented Analytics Market, By Enterprise Type
- 7.2.3.7.2 Rest of Europe Augmented Analytics Market, By End User
- 7.2.3.1 Germany Augmented Analytics Market
- 7.2.1 Europe Augmented Analytics Market, By Enterprise Type
- 7.3 Asia Pacific Augmented Analytics Market
- 7.3.1 Asia Pacific Augmented Analytics Market, By Enterprise Type
- 7.3.1.1 Asia Pacific Large Enterprises Market, By Country
- 7.3.1.2 Asia Pacific Small & Medium Enterprises Market, By Country
- 7.3.2 Asia Pacific Augmented Analytics Market, By End User
- 7.3.2.1 Asia Pacific BFSI Market, By Country
- 7.3.2.2 Asia Pacific IT & Telecom Market, By Country
- 7.3.2.3 Asia Pacific Government Market, By Country
- 7.3.2.4 Asia Pacific Retail Market, By Country
- 7.3.2.5 Asia Pacific Healthcare Market, By Country
- 7.3.2.6 Asia Pacific Manufacturing Market, By Country
- 7.3.2.7 Asia Pacific Transport & Logistics Market, By Country
- 7.3.2.8 Asia Pacific Energy & Utility Market, By Country
- 7.3.2.9 Asia Pacific Others Market, By Country
- 7.3.3 Asia Pacific Augmented Analytics Market, By Country
- 7.3.3.1 China Augmented Analytics Market
- 7.3.3.1.1 China Augmented Analytics Market, By Enterprise Type
- 7.3.3.1.2 China Augmented Analytics Market, By End User
- 7.3.3.2 Japan Augmented Analytics Market
- 7.3.3.2.1 Japan Augmented Analytics Market, By Enterprise Type
- 7.3.3.2.2 Japan Augmented Analytics Market, By End User
- 7.3.3.3 India Augmented Analytics Market
- 7.3.3.3.1 India Augmented Analytics Market, By Enterprise Type
- 7.3.3.3.2 India Augmented Analytics Market, By End User
- 7.3.3.4 South Korea Augmented Analytics Market
- 7.3.3.4.1 South Korea Augmented Analytics Market, By Enterprise Type
- 7.3.3.4.2 South Korea Augmented Analytics Market, By End User
- 7.3.3.5 Singapore Augmented Analytics Market
- 7.3.3.5.1 Singapore Augmented Analytics Market, By Enterprise Type
- 7.3.3.5.2 Singapore Augmented Analytics Market, By End User
- 7.3.3.6 Malaysia Augmented Analytics Market
- 7.3.3.6.1 Malaysia Augmented Analytics Market, By Enterprise Type
- 7.3.3.6.2 Malaysia Augmented Analytics Market, By End User
- 7.3.3.7 Rest of Asia Pacific Augmented Analytics Market
- 7.3.3.7.1 Rest of Asia Pacific Augmented Analytics Market, By Enterprise Type
- 7.3.3.7.2 Rest of Asia Pacific Augmented Analytics Market, By End User
- 7.3.3.1 China Augmented Analytics Market
- 7.3.1 Asia Pacific Augmented Analytics Market, By Enterprise Type
- 7.4 LAMEA Augmented Analytics Market
- 7.4.1 LAMEA Augmented Analytics Market, By Enterprise Type
- 7.4.1.1 LAMEA Large Enterprises Market, By Country
- 7.4.1.2 LAMEA Small & Medium Enterprises Market, By Country
- 7.4.2 LAMEA Augmented Analytics Market, By End User
- 7.4.2.1 LAMEA BFSI Market, By Country
- 7.4.2.2 LAMEA IT & Telecom Market, By Country
- 7.4.2.3 LAMEA Government Market, By Country
- 7.4.2.4 LAMEA Retail Market, By Country
- 7.4.2.5 LAMEA Healthcare Market, By Country
- 7.4.2.6 LAMEA Manufacturing Market, By Country
- 7.4.2.7 LAMEA Transport & Logistics Market, By Country
- 7.4.2.8 LAMEA Energy & Utility Market, By Country
- 7.4.2.9 LAMEA Others Market, By Country
- 7.4.3 LAMEA Augmented Analytics Market, By Country
- 7.4.3.1 Brazil Augmented Analytics Market
- 7.4.3.1.1 Brazil Augmented Analytics Market, By Enterprise Type
- 7.4.3.1.2 Brazil Augmented Analytics Market, By End User
- 7.4.3.2 Argentina Augmented Analytics Market
- 7.4.3.2.1 Argentina Augmented Analytics Market, By Enterprise Type
- 7.4.3.2.2 Argentina Augmented Analytics Market, By End User
- 7.4.3.3 UAE Augmented Analytics Market
- 7.4.3.3.1 UAE Augmented Analytics Market, By Enterprise Type
- 7.4.3.3.2 UAE Augmented Analytics Market, By End User
- 7.4.3.4 Saudi Arabia Augmented Analytics Market
- 7.4.3.4.1 Saudi Arabia Augmented Analytics Market, By Enterprise Type
- 7.4.3.4.2 Saudi Arabia Augmented Analytics Market, By End User
- 7.4.3.5 South Africa Augmented Analytics Market
- 7.4.3.5.1 South Africa Augmented Analytics Market, By Enterprise Type
- 7.4.3.5.2 South Africa Augmented Analytics Market, By End User
- 7.4.3.6 Nigeria Augmented Analytics Market
- 7.4.3.6.1 Nigeria Augmented Analytics Market, By Enterprise Type
- 7.4.3.6.2 Nigeria Augmented Analytics Market, By End User
- 7.4.3.7 Rest of LAMEA Augmented Analytics Market
- 7.4.3.7.1 Rest of LAMEA Augmented Analytics Market, By Enterprise Type
- 7.4.3.7.2 Rest of LAMEA Augmented Analytics Market, By End User
- 7.4.3.1 Brazil Augmented Analytics Market
- 7.4.1 LAMEA Augmented Analytics Market, By Enterprise Type
Chapter 8. Company Profiles
- 8.1 QlikTech International AB
- 8.1.1 Company Overview
- 8.1.2 Recent strategies and developments:
- 8.1.2.1 Partnerships, Collaborations, and Agreements:
- 8.1.2.2 Product Launches and Product Expansions:
- 8.1.2.3 Acquisition and Mergers:
- 8.1.3 SWOT Analysis
- 8.2 MicroStrategy, Inc.
- 8.2.1 Company Overview
- 8.2.2 Financial Analysis
- 8.2.3 Regional Analysis
- 8.2.4 Research & Development Expenses
- 8.2.5 Recent strategies and developments:
- 8.2.5.1 Partnerships, Collaborations, and Agreements:
- 8.2.5.2 Product Launches and Product Expansions:
- 8.2.6 SWOT Analysis
- 8.3 Salesforce, Inc.
- 8.3.1 Company Overview
- 8.3.2 Financial Analysis
- 8.3.3 Regional Analysis
- 8.3.4 Research & Development Expense
- 8.3.5 Recent strategies and developments:
- 8.3.5.1 Partnerships, Collaborations, and Agreements:
- 8.3.5.2 Product Launches and Product Expansions:
- 8.3.5.3 Acquisition and Mergers:
- 8.3.6 SWOT Analysis
- 8.4 IBM Corporation
- 8.4.1 Company Overview
- 8.4.2 Financial Analysis
- 8.4.3 Segmental and Regional Analysis
- 8.4.4 Research & Development Expenses
- 8.4.5 Recent strategies and developments:
- 8.4.5.1 Partnerships, Collaborations, and Agreements:
- 8.4.5.2 Product Launches and Product Expansions:
- 8.4.5.3 Acquisition and Mergers:
- 8.4.6 SWOT Analysis
- 8.5 Microsoft Corporation
- 8.5.1 Company Overview
- 8.5.2 Financial Analysis
- 8.5.3 Segmental and Regional Analysis
- 8.5.4 Research & Development Expenses
- 8.5.5 Recent strategies and developments:
- 8.5.5.1 Product Launches and Product Expansions:
- 8.5.5.2 Acquisition and Mergers:
- 8.5.6 SWOT Analysis
- 8.6 Oracle Corporation
- 8.6.1 Company Overview
- 8.6.2 Financial Analysis
- 8.6.3 Segmental and Regional Analysis
- 8.6.4 Research & Development Expense
- 8.6.5 Recent strategies and developments:
- 8.6.5.1 Product Launches and Product Expansions:
- 8.6.6 SWOT Analysis
- 8.7 Tibco Software, Inc. (Vista Equity Partners)
- 8.7.1 Company Overview
- 8.7.2 Recent strategies and developments:
- 8.7.2.1 Acquisition and Mergers:
- 8.7.3 SWOT Analysis
- 8.8 SAP SE
- 8.8.1 Company Overview
- 8.8.2 Financial Analysis
- 8.8.3 Segmental and Regional Analysis
- 8.8.4 Research & Development Expense
- 8.8.5 Recent strategies and developments:
- 8.8.5.1 Partnerships, Collaborations, and Agreements:
- 8.8.6 SWOT Analysis
- 8.9 SAS Institute, Inc.
- 8.9.1 Company Overview
- 8.9.2 Recent strategies and developments:
- 8.9.2.1 Partnerships, Collaborations, and Agreements:
- 8.9.2.2 Acquisition and Mergers:
- 8.9.3 SWOT Analysis
- 8.10. Alteryx, Inc.
- 8.10.1 Company Overview
- 8.10.2 Financial Analysis
- 8.10.3 Regional Analysis
- 8.10.4 Research & Development Expense
- 8.10.5 Recent strategies and developments:
- 8.10.5.1 Product Launches and Product Expansions:
- 8.10.5.2 Acquisition and Mergers:
- 8.10.6 SWOT Analysis

